
Elevated NPL ratios remain an important problem in several euro area countries. Moreover, the Covid-19 pandemic is likely to trigger a significant increase in NPLs across the euro area. This policy note examines the interlinkages and feedback loops between NPLs, bank credit, and the real economy, using a panel Bayesian VAR model. We find that an exogenous increase in the change in NPL ratios depresses bank lending, widens lending spreads and leads to a fall in real GDP growth and residential real estate prices. Conditional forecast analysis provides additional evidence that a decline in NPL ratios results in significant economic and financial benefits for euro area countries. Overall, the results provide additional evidence for the economic merits associated with effective policy measures to speed up the resolution of NPLs. Given the expected Covid-19 induced surge in NPLs, the economic argument in favour of such policies is stronger than ever before.
Non-performing loans (NPLs) are a long-standing policy issue in the euro area and are likely to become again an important problem due to the Covid-19 pandemic. The share of defaulted euro area loans (the ‘NPL ratio’) peaked around 8% in 2014, driven by the severe and protracted recession in parts of the euro area as well as several market failures and structural problems, slowing down NPL resolution. The economic recovery in the second half of the decade and a range of policy measures to tackle NPLs, helped to reduce the euro area NPL ratio to 3.6% at the end of 2019. Despite a range of policy measures targeted to help borrowers and banks, however, the Covid-19 Pandemic is likely to result in a renewed and possibly very pronounced increase of the euro area NPL ratio in the coming years.
A high share of defaulted loans can adversely affect the soundness of the banking system and its ability to lend to the real economy. NPLs reduce bank profits, increase banks’ capital needs and can divert important managerial resources away from the core and more profitable activities.3 Given the importance of bank lending for the euro area economy, it is important to get a clear understand of the interlinkages and feedback loops between NPLs, bank credit, and the real economy.
A number of papers looked at the impact of economic developments on NPLs, identifying economic activity, inflation, interest rates, and the exchange rate as key relevant drivers (Anastasiou and Tsionas 2016; Jimenez and Saurina 2006; Louzis, Vouldis and Metaxas 2012). There are also a few papers looking at the impact of NPLs on bank lending and economic activity, e.g. Balgova and Plekhanov (2016) as well as Accornero, Alessandri, Carpinelli and Sorrentino (2017). All these papers struggle, however, with the identification of cause and effect, given that economic developments impact NPLs and vice versa.
Structural time series models can help overcoming this problem. Such models combine NPL ratios and economic activity in a VAR, together with a broader set of banking and macroeconomic variables (see e.g. Espinoza and Prasad (2010), Nkusu (2011), De Bock and Demyanets (2012) and Klein (2013)). These studies generally find significant negative feedback effects from NPLs to the real economy.
The paper underlying this policy note (Huljak, Martin, Moccero and Pancaro 2020), contributes to this strand of literature by estimating the impact of exogenous NPL shocks on bank lending and the macroeconomy. Exogenous NPL shocks occur frequently, for example due to regulatory and legal changes impacting the speed of NPL resolution, changes in NPL reporting requirements, NPL sales or changes in banks’ risk appetite. All of these factors result in changes to the stock of NPLs and the NPL ratio that are independent from changes in economic fundamentals.
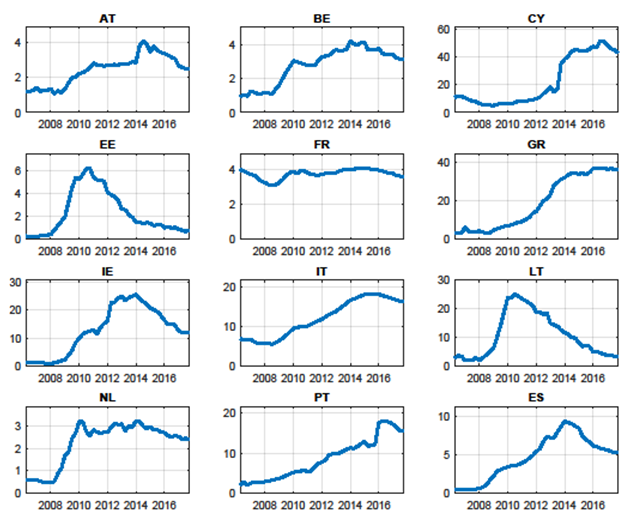
The underlying paper (Huljak, Martin, Moccero and Pancaro 2020) looks at 12 euro area countries during the 2006 to 2017 period relying on quarterly data.4 The evolution of NPL ratios across these countries was quite diverse, with very different starting levels, peaks and troughs (see Figure 1). The countries most affected by the euro area sovereign debt crisis (Greece, Ireland, Spain, Cyprus, Italy, and Portugal) generally show the most dynamic developments. A few years earlier, the two Baltic countries in the sample, in particular Lithuania also experienced a strong increase and subsequent decline of their NPL ratios.
Figure 1: Non-performing loan ratios in euro area countries

Note: The data sample spans from 2006Q1 to 2017Q3. The displayed NPL ratios are based on data sourced from the IMF FSI, Banque de France, Banco de España, Central Bank of Cyprus and Bankscope.
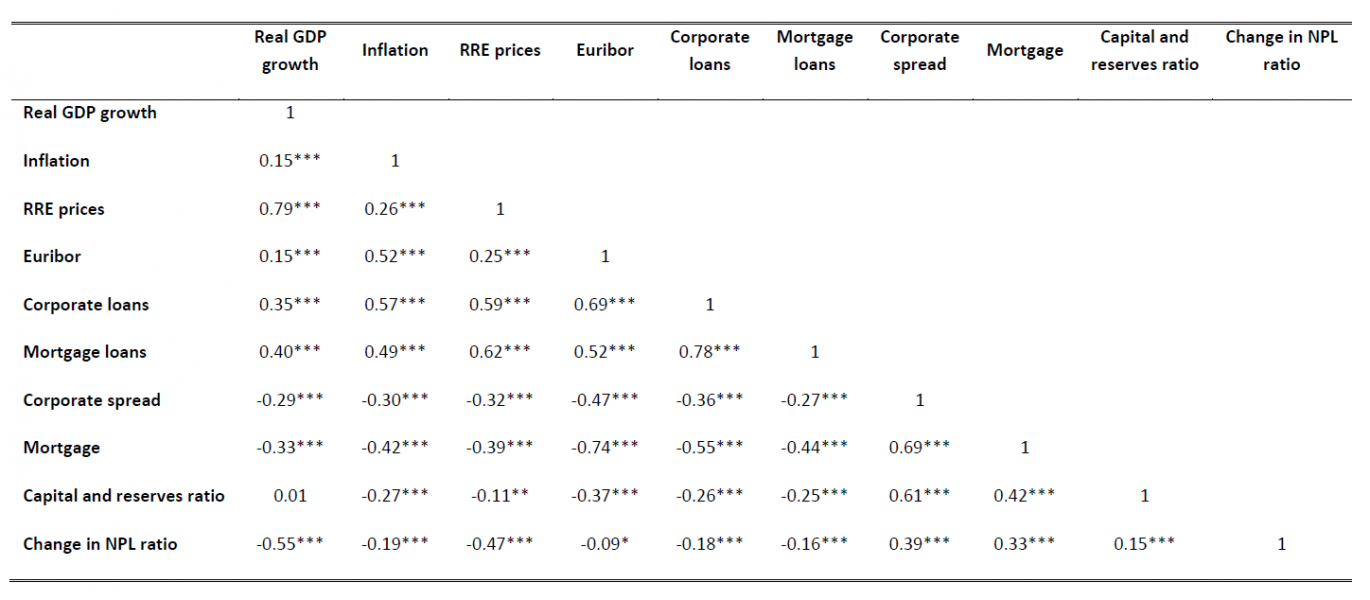
Correlations between the changes in NPL ratios, macroeconomic and banking sector variables suggest that an exogenous increase in NPL ratios correlates negatively with economic activity (GDP growth), inflation, residential real estate prices and bank lending volumes. By contrast, bank lending spreads widen and the capital and reserve ratio increases. An increase in GDP growth correlates positively with all variables except bank lending spreads and the NPL ratio. The results of this correlation matrix are intuitive but insufficient to establish causalities and to identify the source of variation of these variables.
Given the ‘chicken and egg’ problem in disentangling cause and effect of NPLs, we estimate a rather large panel Bayesian VAR with ten variables to identify the dynamic interaction between NPLs, macroeconomic, and banking variables and to capture country-specific dynamics. Besides the NPL ratio, the panel contains the policy interest rate, economic activity, inflation, residential real estate prices, bank lending volumes and spreads for mortgages and company loans and capital and reserves over total assets.
More specifically, we use Cholesky decomposition to disentangle the shocks to the change in NPL ratios (see e.g. De Bock and Demyanets (2012); Espinoza and Prasad (2010) and Klein (2013). This approach implies ranking the variables in the VAR based on the degree of their exogeneity. We consider monetary policy as the least exogenous variable, given that monetary policy responds to a large number of indicators (Ciccarelli, Maddaloni, and Peydro 2013; ECB 2011). The capital and reserves-to-asset ratio is ranked second to last, given that it is affected by bank lending and lending spreads. Third, we rank bank lending spreads, which are assumed to move faster than macroeconomic variables (GDP and inflation). We rank real estate prices forth, followed by inflation and GDP growth, the change in the NPL ratio and finally lending volumes. This ordering is similar to Hancock, Laing and Wilcox (1995), Klein (2013) and De Bock and Demyanets (2012).
The VAR model allows estimating the impulse responses of shocks to the NPL ratio. In this note, we report the maximum, minimum, median, and interquartile range of the impulse responses to a one standard deviation shock. For each variable, we are looking at the maximum impact recorded across the 12 countries over a four-year horizon.5
The impulse responses to a one-standard-deviation shock to the change in NPL ratios are displayed in Figure 2.
Figure 2: Response to a shock to the change in the NPL ratio

Note: The chart shows standard statistics for the maximum or minimum impact (depending on the variable) recorded across countries. In particular, the strongest response to the shock over a four-year horizon (16 quarters) is taken for all the countries. Then the maximum, minimum, median and interquartile range of this distribution across the 12 euro area countries is reported. Insignificant responses are excluded, based on 16% and 84% Bayesian credibility bands. The size of the shock considered is a one standard deviation shock to the relevant variable. Loans (to HHs and NFCs), real GDP growth and RRE prices are defined as annual percentage changes, while spreads (to HHs and NFCs) are defined in percentage points. The maximum (minimum) impact for the change in the NPL ratio (residential real estate prices) is recorded for Cyprus (4.3% and 3.4%, respectively, not reported in the chart).
The size of the one standard deviation shock ranges between 0.1 (France) and 4.3 percentage points (Cyprus) with a median impact is 0.3 percentage point. The large differences are reflecting historic variations in NPL volatility with the countries hardest hit by the crisis exhibiting the largest shocks (Cyprus, Ireland, Lithuania, Portugal, Greece, Spain, and Italy).
The one standard deviation shock to NPLs leads to a decline in bank lending, in particular for non-financial corporations. The annual growth of firm lending declines by up to 1.7 percentage points (in Cyprus) while it decreases ‘only’ by up to 1 percentage point for mortgages (also in Cyprus). The median response to company loans is also notably stronger than for mortgages.6 The shock also leads to a slight widening in bank lending spreads for NFCs and mortgages.
Residential property prices decline significantly with a median impact of 0.6 percentage points and a maximum decline of 3.4 percentage points in Cyprus. Impulse responses for real estate prices in Ireland, Lithuania, and Estonia are also quite strong. In most countries, the NPL shock leads to a decline in real GDP growth (by between 0.07 and 1 percentage point), with a median response of 0.2 percentage points, whereas the response to inflation is rather heterogeneous across countries.
Overall, these findings suggest sizable impacts of changes in NPL ratio to bank lending and the real economy, with the magnitude of the impact depending mainly on the size of the one standard deviation shock.7
Another way to gauge the impact of NPL ratios on economic developments is an out-of-sample scenario analysis, providing a quantitative illustration of the possible economic and financial benefits associated with a decline in NPL ratios in euro area countries. In the interest of brevity, we focus on the six most relevant variables in the VAR and on the six countries that exhibited the most sizable increase in NPL ratios during the crisis, namely Cyprus, Ireland, Spain, Italy, Greece, and Portugal.
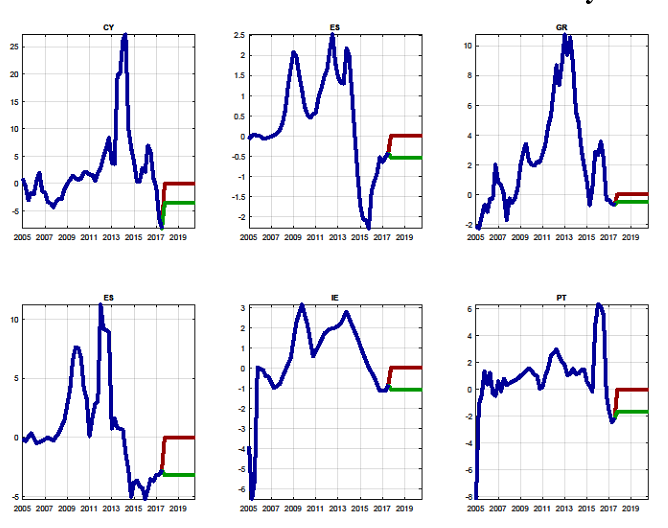
Under the ‘baseline scenario’, the future change in the NPL ratio for each country equals the average change recorded during the last four quarters of historical data.8 Under the ‘adverse scenario’, the out of sample change in the NPL ratio equals zero. Under both scenarios, the other economic and financial variables in the VAR are projected conditional on the assumed evolution of the change in the NPL ratio.9 The observed and out of sample evolution of the change in NPL ratios for the two scenarios are depicted in Figure 3.
Figure 3: Observed and assumed out-of-sample baseline and adverse change in NPL ratios for the structural scenario analysis

Note: The data sample spans from 2006Q1 to 2017Q3. The out-of-sample assumptions for the baseline and adverse paths for the change in NPL ratios span from 2017Q4 to 2020Q3. The data are sourced from the IMF FSI, Banque de France, Banco de España, Central Bank of Cyprus and Bankscope.
By construction, the gap between the baseline and the adverse changes in the NPL ratio depends on how strongly the variable evolved in the last four quarters of historical data. This gap is the widest for Cyprus, followed by Ireland, Portugal, Italy, and then Spain and Greece.
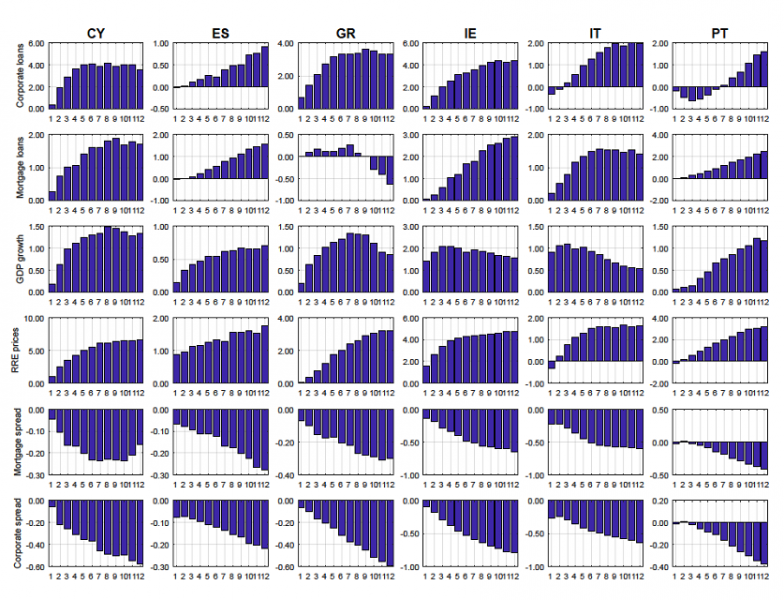
Figure 4 shows the differences between the conditional forecasts for the six main variables under the baseline and the adverse scenarios for the development of the NPL ratios.
Figure 4: Difference in the structural scenario forecasts between the baseline and the adverse path for the main variables included in the panel VAR

Note: The figure reports the difference between the baseline and the adverse structural scenario forecasts of the main variables in the panel VAR. Under both the baseline the adverse assumption, the forecasts for the variables in the VAR are computed assuming that only the structural shock to the change in NPL ratios adjusts to ensure the conditioning path for this variable. Real GDP growth, headline inflation, residential real estate prices and corporate and mortgage loans are expressed in annual growth rates. The Euribor, bank lending spreads, the change in NPL ratios and the capital and reserves-to-asset ratio are expressed in percentage points.
The results of this structural out-of-sample forecast illustrates that a reduction in NPL ratios can generate significant economic benefits in euro area countries. At the end of the forecast horizon, the annual rate of growth of mortgage lending under the baseline scenario is between 1.4 (Italy) and 2.9 (Ireland) percentage points higher than under the adverse scenario, while the annual rate of growth of corporate lending increases faster by between 0.9 (Spain) and 4.4 (Ireland) percentage points. Bank lending spreads are narrower, by between 0.2 and 0.6 percentage points for mortgages and by between 0.2 and 0.8 for loans to non-financial corporations under the baseline scenario. Stronger lending and lower spreads lead to higher residential real estate prices, with annual rates of growth being between 1.6 (Italy) and 6.7 (Cyprus) percentage points higher under the baseline than the adverse. Finally, the rate of growth of real GDP is higher by between 0.5 (Italy) and 1.6 (Ireland) percentage points.
Despite a gradual decline from the peak in 2014, NPL ratios remained an important problem in several euro area countries. Moreover, the economic implications of the global Covid-19 pandemic are likely to reverse recent successes in dealing with the stock of euro area NPLs and to result in a significant increase in the share of defaulting loans.
Against this background, the paper underlying this policy note aims to contribute to a better understanding of the interlinkages and feedback loops between NPLs, bank credit, and the real economy. Given the relatively short time series available for NPL ratios and the large number of parameters to be estimated, we deploy a panel Bayesian VAR model with hierarchical priors that allow for country-specific coefficients.
We illustrate the impact of shocks to NPLs ratios using two sets of results. Looking first at impulse response functions, we find that an exogenous increase in the change in NPL ratios depresses bank lending, widens lending spreads and leads to a fall in real GDP growth and residential real estate prices. In addition, three-year structural out of sample forecast analysis provides quantitative evidence that a continuation of the decline in NPL ratios observed in 2016 and 2017, would result in significant economic and financial benefits to euro area countries.
The results presented in this note provide additional evidence for the economic merits associated with effective prudential and structural policy measures to speed up the resolution of the NPLs. Given the Covid-19 induced, expected surge in defaulting loans in the years ahead, the economic argument for the implementation of such policies is stronger than ever before.
APPENDIX
Table 1: Correlation matrix among the variables included in the panel VAR

Note: The data sample spans from 2006Q1 to 2017Q3. (***), (**) and (*) denote statistical significance at the 1%, 5% and 10% levels, respectively.
Sources: Data constructed based on the IMF, ECB, Banque de France, Banco de España, Central Bank of Cyprus, Central Statistics Office of Ireland and Bankscope.
This note is based on Huljak, I., Martin, R., Moccero, D. and Pancaro, C. (2020), Do non-performing loans matter for bank lending and the business cycle in euro area countries, ECB Working Paper No 2411, May 2020.
Ivan Huljak is Principal Advisor at the Croatian National Bank, Reiner Martin is Lead Economist at the Joint Vienna Institute, Diego Moccero is Principal Financial Stability Expert at the European Central Banks and Cosimo Pancaro is Team Lead Financial Stability Expert at the European Central Bank. The views expressed here are those of the authors and do not necessarily reflect those of their respective institutions.
Fell, Grodzicki, Martin and O’Brien (2016a) elaborate on the challenges for the banking system stemming from the accumulation of NPLs and suitable policies to resolve this issue.
Austria, Belgium, Cyprus, Estonia, France, Greece, Ireland, Italy, Lithuania, Spain, the Netherlands and Portugal. For the remaining euro area countries the data was insufficient to conduct this type of analysis.
We exclude insignificant responses, based on 16% and 84% Bayesian credibility bands.
This is consistent with Fell, Grodzicki, Metzler and O’Brien (2018). Using bank level data, they find that there is a significant negative relationship between the ratio of NPLs over Tier 1 capital and loan origination. This relationship appears to be stronger for lending to non-financial corporations than for mortgages.
The findings are broadly in line with those of empirical papers like Klein (2013) and Espinoza and Prasad (2010) as
well as theoretical models like Curdia and Woodford (2010).
This implies an out of sample change in the NPL ratio of -3.6% for Cyprus, -0.5% for Spain, -0.5% for Greece, -3.2%
for Ireland, -1.1% for Italy and -1.7% for Portugal.
This follows the methodology proposed by Antolin-Diaz, Petrella and Rubio-Ramirez (2018).