

The interest rate-growth differential (i−g) is an important determinant of government debt dynamics and sovereign sustainability analysis. A persistently negative differential could in principle enable lowering debt ratios even in the absence of primary surpluses. Many advanced economies had recently – before the COVID 19-crisis hit – exhibited a strong negative inertia in their i−g. But to which extent can this be sustained? We use panel econometric techniques to identify the determinants of i−g across euro area countries and then employ a panel BVAR model to forecast i−g. We conclude that the differential is likely to remain negative after the COVID 19-crisis and well below its long-term average for most euro area countries, but several factors will likely push it up. This would warrant caution in the conduct of fiscal policy over the medium term for the high debt countries.
The difference between the average (implicit) interest rate that governments pay on their debt and the (nominal) growth rate of the economy, the so-called interest rate-growth differential (i−g), is a key variable for debt dynamics and sovereign sustainability analysis.
![]()
The equation above provides a simple accounting framework to decompose the change in the government gross debt-to-GDP ratio (Δbt) into its key drivers, consisting of: (i) the “snowball effect”, i.e. the impact from the difference between the average nominal interest rate charged on government debt (it) and the nominal GDP growth rate (gt) multiplied by the debt-to-GDP ratio in the previous period (bt-1); (ii) the primary budget balance ratio (pbt); and (iii) the deficit-debt adjustment as a share of GDP (ddat), comprising factors that affect debt, but are not included in the deficit (such as acquisitions or sales of financial assets, valuation effects, etc.). With dda generally assumed to be close to zero over longer periods, the debt ratio will stabilise when pbt ≈ (it−gt)bt-1. Thus, if i > g a primary surplus is needed to stop the debt ratio from rising and an even larger surplus is needed to reduce it. That primary surplus will need to be larger, the higher the initial debt level. Conversely, a persistently negative i−g differential on government debt (i < g) would imply that debt ratios could be reduced even in the presence of primary budget deficits (lower than the snowball effect).
Most of the theoretical and empirical literature has so far assumed or inferred that the interest rate–growth differential should be positive over the longer-run, at least in advanced, mature economies, close to their steady-state.
A debate on the role of fiscal policy with a persistently negative interest rate-growth differential was revived by O. Blanchard in his 2019 AEA Presidential address. Using the US example, Blanchard (2019) makes the point that the costs of government debt may be smaller than generally assumed in the policy discussion. This is because the (US) safe interest rate (a proxy of marginal bond rates) is below the nominal GDP growth rate and this is more the historical norm rather than the exception. With a negative i−g, public debt may have no fiscal cost. It may still have welfare costs, but these may also be lower than typically assumed. An implication of this proposition would be that the US can sustain high(er) debts without significant costs. The author stressed, however, that the purpose of his lecture was not to argue for higher debt per se, but to allow for a richer discussion of debt policy and appropriate debt rules than is currently the case.
On the empirical side, Mauro and Zhou (2020) documents that negative differentials have occurred more often than not in both advanced and emerging economies over a long period spanning up to 200 years. Yet, while for the full sample of advanced economies, the central tendency indicators (both median and mean) are negative, for the longest period covered in the sample (before WWII) and for the most recent period (post-1980s), they are positive. It is mainly the post-WWII period and the high inflation years in the 70s that drive the results. Finally, the paper asks the question whether “one can sleep more soundly” with such negative (automatic debt reduction) differentials. The answer the authors give is “not really”: in fact, governments tended to loosen fiscal positions and accumulate more debt and lower differentials are not found to be associated with a lower frequency of sovereign defaults over the period of analysis.
To start with, in our paper (Checherita-Westphal and Domingues Semeano, 2020), we provide stylised facts for the interest rate-growth differential before the COVID-19 crisis in the mature euro area countries (first 12 members of the euro area, EA-12) and other advanced economies. In most of these countries, the long-term historical average of i−g since the early 1980s or over the EMU period (since 1999) is positive and hover around 1 percentage point. Even when including the high inflation period of the 1970s, the differential remains positive in many of the matured economies (Table 1). For the euro area aggregate, the differential has been positive, on average, over the EMU period. Only as of 2015, it has turned negative (Table 2).
Table 1: Mean i−g and components in advanced economies over historical periods
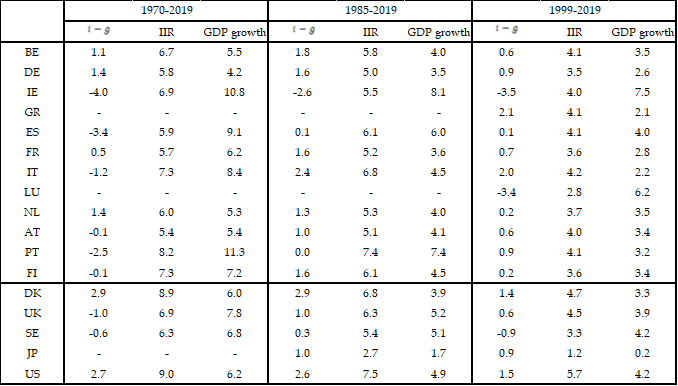 Source of data: Ameco, OECD, World Bank and authors’ calculations. Notes: The main source of data for calculations is Ameco (Spring 2020 vintage). Where data is not available, the series were extrapolated with the growth rate of respective variables from other sources. Data for LU available as of 1990, JP 1981, FR 1978, PT 1977, NL 1976, DE, IE, DK 1972, GR 1995 (from Ameco). Implicit interest rate calculated in annual terms as the ratio between government interest payments in year t and the debt stock in year t-1, then averaged over the respective period. Extreme outliers for Ireland in 2015 (and 2016) as a result of GDP statistical reevaluations are excluded throughout the analysis.
Table 2: Mean i−g for the EA aggregate over the EMU period and various sub-periods

Source of data: Ameco (Spring 2020 vintage) and authors’ calculations. EA aggregate is the GDP-weighted average of the 19 euro area countries (for each individual variable entering the i-g calculation; see also notes to Table 1).
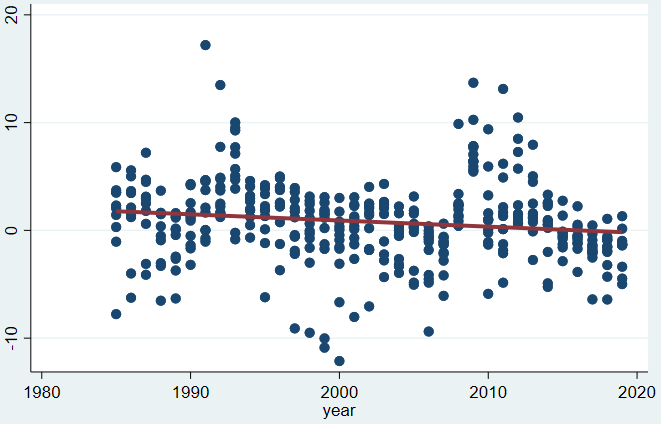
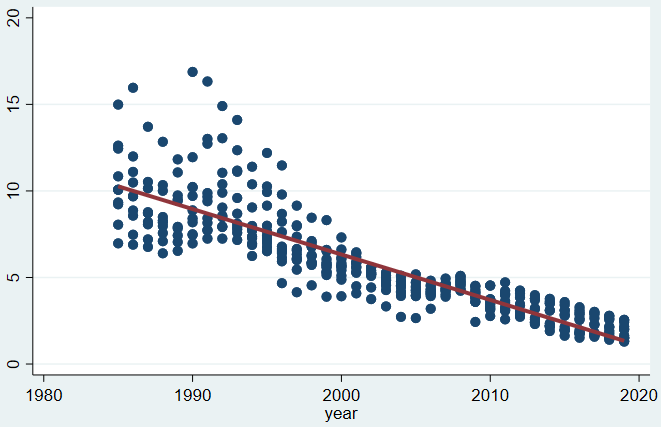
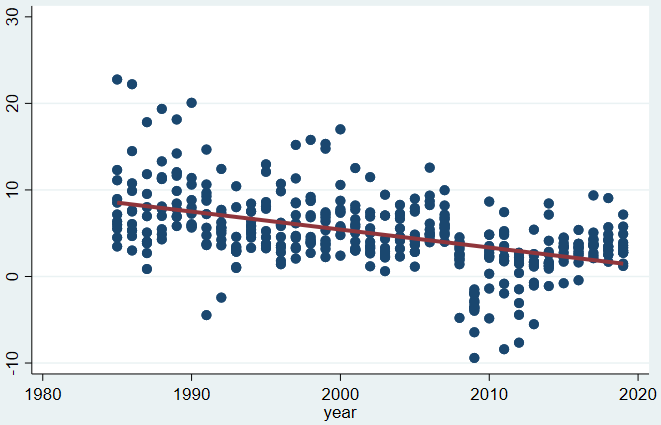
While recent policy discussions have focused on the declining (equilibrium) interest rates since the 1980s, as highlighted by the “new” literature on secular stagnation,1 potential and nominal output growth have also dropped. Thus, the average cross-country i−g differential on government debt has followed a less pronounced decline and showed no apparent trend until more recently. Chart 1 illustrates these dynamics for the matured EA countries.
Chart 1: Interest rate-growth differential across EA-12 over 1985-2019
| Interest rate growth differential (i−g) | Implicit interest rate (i) | Nominal GDP growth (g) |
 |
 |
 |
Notes: Own calculations based mainly on the European Commissions’ Ameco dataset (Spring 2020 vintage). EA-12 comprises Austria, Belgium, Germany, Spain, Finland, France, Greece, Ireland, Italy, Luxembourg, the Netherlands and Portugal.
Next, we seek to identify the main driving factors for the interest rate-growth differentials on government debt for euro area countries using panel econometric techniques. In line with the literature, we investigate the fiscal and macroeconomic fundamentals, as well as the financial, demographic and institutional factors that may be relevant across a core group of euro area countries. Various robustness checks are performed including: (i) across country groups: apart from the first 12 members of the euro area (EA-12) as the core group of matured, high income economies in the euro area, we also look at larger samples, including other OECD advanced economies (Denmark, Sweden, United Kingdom, United States and Japan) and the other euro area countries; (ii) across various periods: apart from 1985-2017 as a base period for which good data coverage is available for the EA core economies, we focus also on the euro area period (since 1999); (iii) across panel econometric techniques.2
We find that countries with a higher public debt burden, higher primary deficits or an increase in public debt are more likely to have a higher interest rate-growth differential (even after controlling for the position in the economic cycle). The differential tends to increase significantly and to add quickly to the public debt burden in bad economic times, as was the case in the financial, economic and sovereign debt crisis post-2007 (and reflected even more sharply in the current COVID-19 crisis). For the euro area period, monetary policy loosening is associated with a lower differential. Equivalently, a monetary policy tightening, proxied by an increase in the short-term interest rate or other monetary policy rates or a decline in monetary policy assets, would induce an increase in the interest rate-growth differential on government debt. On the other hand, technological progress or any other factors that increase total factor productivity (TFP) growth promote a decrease in i−g.
The impact of ageing is more difficult to disentangle. A higher dependency ratio is generally found to be associated with lower i−g, while slower population growth tends to increase the differential. This result could be justified in so far as ageing induces predominantly a higher savinglower interest rate configuration, while lower population growth may have a more pronounced and quicker effect on growth.
As to the impact of other variables, there is some evidence that the global saving glut hypothesis is associated not only with a decline in interest rates, but also in the interest rate-growth differential.
With respect to various time periods and events, after controlling for the relevant macroeconomic and financial variables, the one-off introduction of the euro seems to have promoted some decline in the interest-rate growth differential mainly stemming from the reduction in the implicit interest rate. Regarding the effect of the financial and sovereign debt crisis, the post-crisis dummy (after 2007) is found positive and statistically significant. That is, the interest rate-growth differential since the financial crisis has been higher, on average, than before (1985-2007). However, controlling for other relevant factors, including the fiscal position and monetary policy responses, the post-crisis differential has actually been statistically significantly lower than before. Trends in the differential are also explained by common external factors, with i−g in the US being positively correlated with i−g across the euro area countries.
In the final part of our paper we use a panel Bayesian vector auto regression (BVAR) to forecast the medium term developments in the differential. The model is set for the 1999-2017 period for the mature euro area countries, sample from which we exclude Ireland and Luxembourg as outliers restricting the forecast accuracy.3 The BVAR specifications are simplified versions of the panel specification described above, consisting of government debt level (variant 1) or primary balance (variant 2), short term interest rates and i−g as endogenous variables, and TFP growth and population growth as exogenous variables. Three different Ameco vintages (autumn 2018, autumn 2019 and spring 2020) were used in order to comment on the stability of the results. The EC spring 2020 forecast includes the projected impact at the time of the COVID-19 pandemic. The results based on this latest vintage must be interpreted with additional caution, given the high uncertainty surrounding the still on-going crisis and the rebound from it.
The results in Table 3 show that the differential is expected to be negative for most countries in 2022 regardless of the vintage. We observe that using more recent vintages (meaning we estimate based on a different set, start the forecast with different initial conditions and forecast for shorter horizons) brings down the forecast median values.
Although the forecast points to increasingly favourable differentials for 2022, on average over the period 2018-2022, the differential is projected to increase in almost all countries in the latest vintage. This owes, first, to the unanticipated (in the first two vintage) crisis effect, which brings about a large increase in the differential in 2020, only partly compensated in the next two years. See also Chart 2 for examples of the forecast path for Germany and Italy. The second reason is related to the upward revisions in the historical i−g values in several countries across the vintages and a general tendency of the model to under-predict the differential.
Table 3: BVAR model median forecast for i−g with three data vintages
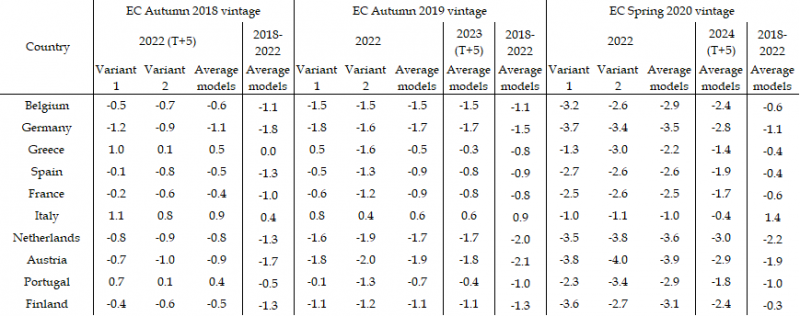
Source: Author’s calculations based on real time AMECO data and forecasts (EC autumn 2018, autumn 2019 and spring 2020 forecasts). Notes: Variants 1 and 2 are panel Bayesian VARs with the short term interest rates and a fiscal variable (debt ratio in Variant 1 and primary balance ratio in Variant 2) as endogenous variables and TFP growth and dependency ratio variation as exogenous variables. The forecast starts in year 2018 for the autumn 2018 vintage, 2019 for the autumn 2019 vintage and 2020 for the spring 2020 vintage.
Chart 2: BVAR model median forecast for i−g for selected countries
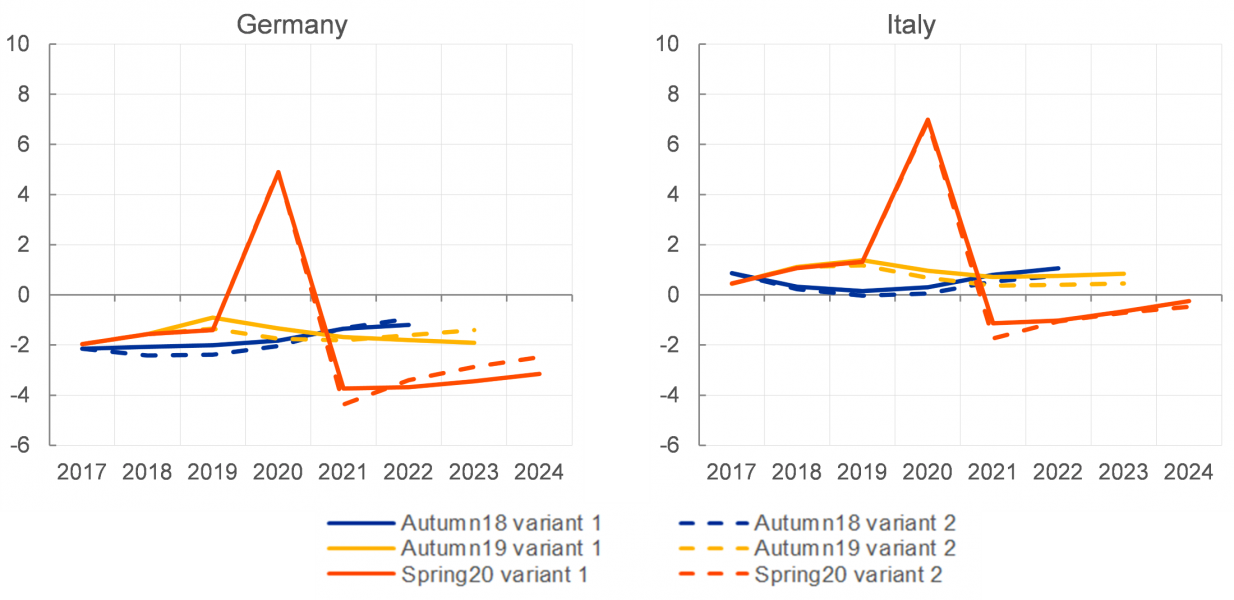
Source: Authors’ calculations based on real time AMECO data and forecasts (EC autumn 2018, autumn 2019 and spring 2020 forecasts). Notes: see explanations for Table 3.
Two final takeaways from the BVAR forecasts: first, the differentials tend to be higher for high debt countries also in the medium term and, second, for most countries there is an upward trend in i−g.
In our empirical analysis, we first investigate the macroeconomic, financial, demographic and institutional determinants of i−g across euro area countries. While we control for many relevant variables and conduct a variety of robustness checks (across countries, periods and estimators, with lagged explanatory variables and GMM dynamic panel models to control for endogeneity), given the highly endogenous nature of these factors, our analysis unveils mostly correlations, with causation likely to work both ways in many instances.
We find that countries with a higher public debt burden, higher primary deficits or an increase in public debt are more likely to have a higher interest rate-growth differential, even after controlling for the position in the economic cycle. The differential tends to increase significantly in bad economic times, which signals that any deviations from baseline scenarios of “steady-state” economic developments may quickly bring i−g into highly unfavourable territory. For the euro area period, monetary policy loosening is associated with a lower differential. Equivalently, a monetary policy tightening, proxied by an increase in the short-term interest rate and other monetary policy interest rates or a decline in monetary policy assets, would induce an increase in the interest rate-growth differential on government debt.
On the other hand, technological progress or any other factors that increase total factor productivity (TFP) growth promote a decrease in i−g.
A panel BVAR forecast exercise suggests that i−g differentials for the majority of the euro area countries will likely remain negative after the COVID 19-crisis, but increasing over the medium-term. The peak experienced due to the pandemic crisis will push the average differential over 2018-22 above what was previously forecast. Furthermore, high debt countries consistently present the highest differentials.
Overall, while i−g is projected to remain well below its historical average over the medium term according to these models, this analysis advises caution, especially for the high debt countries. Whereas effective public spending and investment can lift a country’s medium-term growth potential and mitigate the negative cyclical effects of a downturn, particularly in an environment of low interest rates for long, currently high debt burdens in many economies remain a source of vulnerability.
Checherita-Westphal, C. and Domingues Semeano, J. (2020), “Interest rate-growth differentials on government debt: an empirical investigation for the euro area”, ECB Working paper No 2486.
Blanchard, O. (2019), “Public Debt and Low Interest Rates,” American Economic Review, vol 109(4), pages 1197-1229.
Mauro, P. and J. Zhou (2020), “r-g<0: Can We Sleep More Soundly?”, IMF Working paper, WP/20/52, Washington DC.
Teulings, C. and Baldwin, R., (ed.) (2014) “Secular Stagnation: Facts, Causes and Cures”, CEPR Press.
See Teulings and Baldwin, ed. (2014) for a review.
The starting point for our analysis is an unbalanced annual panel for the period 1985-2017, for which consistent time series for most explanatory variables are available (at least) for the core EA countries. The base specification employs the Driscoll-Kray fixed effects panel estimator on the EA-12 panel. The robustness of this specification was tested with the recourse to various variants of the model. Most of the variables proved robust to the use of the lagged form or 5 year non-overlapping averages. The results of the base specification remain generally robust to the choice of several empirical estimators, in particular, the Arellano-Bond dynamic panel estimator intended to better control for endogeneity, as well as dynamics effects.
Ireland exhibits extremely low i−g for 2015 due to a statistical reclassification affecting growth. Luxembourg has also persistently very low i−g , as well as low government debt with very limited bond issuances, non-typical for the other advanced economies. The exclusion of these two countries as outliers does not affect the conclusions of the analysis on determinants, where the results remain robust across specifications when regressions are run on the EA-10 sample.