Mutual fund risk-taking via active portfolio rebalancing varies both in the cross-section and over time. In this policy brief, I show that the same is true for funds’ off-balance sheet risk-taking, even after controlling for on-balance sheet activities. For this purpose, I propose a novel measure of synthetic leverage, which can be estimated based on publicly available information. The empirical application for German equity funds shows that risk-taking via synthetic leverage depends on the macro-financial environment and that synthetically leveraged funds display higher levels of fragility. Funds’ synthetic leverage should therefore be closely monitored.
Mutual fund risk-taking varies both in the cross-section and over time (e.g., Huang, Sialm, and Zhang (2011)). An increased risk-taking is of concern for policymakers, regulators, and market participants due to its potential to amplify structural run and liquidity risks within the fund sector (e.g., Goldstein, Jiang, and Ng (2017)). Prior work on fund risk-taking mainly focuses on active portfolio rebalancing (e.g., reach-for-yield behavior as in Choi and Kronlund (2018)).
In this policy brief, I summarize recent research (Fricke (2021)) that investigates fund risk-taking via off-balance sheet activities (which I refer to as synthetic leverage). The idea is that mutual funds can increase their risk exposures not only by active portfolio rebalancing but also by means of leverage. While it is well-documented that financial leverage does not play an important role for the typical fund (e.g., Fricke and Wilke (2020)), there is, however, a long-standing policy discussion as to whether funds engage in risk-taking via synthetic leverage (e.g., ECB (2014)).
Broadly speaking, synthetic leverage refers to (mainly off-balance sheet) activities that tilt an investor’s risk-return profile (Breuer (2002)). The two most prominent examples of such activities are derivatives trading and, albeit to a lesser extent, securities financing transactions (SFTs, i.e., repurchase agreements and securities lending). In line with the idea that fund managers respond to incentives (e.g., Chevalier and Ellison (1997)), anecdotal evidence suggests that both competition within the fund sector and the current macro-financial environment may induce fund managers to engage in such activities to take additional risks. For example, derivatives contracts are often considered a relatively cheap way to express investment views, since they may involve only small upfront costs and may be more liquid than some of the underlying products.
While questions on synthetic leverage of investment funds have been widely discussed in policy circles, the academic literature on the topic remains sparse. Two aspects in particular have impeded a structured investigation of the effects of synthetic leverage usage: (i) despite ongoing efforts aimed at increasing the transparency and robustness of SFT and derivatives markets, data availability issues remain; and (ii) the lacking consensus on an economically meaningful measure of synthetic leverage. To fill these gaps, I propose a new measure of synthetic leverage, which can be estimated based on publicly available information as it does not require detailed data on funds’ derivatives/SFT activities.
Conceptually, the fundamental idea of my methodology is to think of synthetic leverage as the unobserved actions of a fund manager. These unobserved actions will affect the distribution of the fund‘s realized returns. By finding a suitable benchmark to compare the realized return (distribution) against, we can uncover the economic effect of the fund’s unobserved actions. In this regard, the return gap (Kacperczyk, Sialm, and Zheng (2008)), denoted as Δ, turns out to be very useful. The return gap is the difference between a fund’s realized gross return (R) and its hypothetical holdings-based return (RH). The holdings- based return, RH, is based on a fund’s most recently disclosed portfolio holdings. The return gap is a measure of the net effect of a fund’s unobserved actions, since the realized return captures all unobserved actions, while the holdings-based return does not.
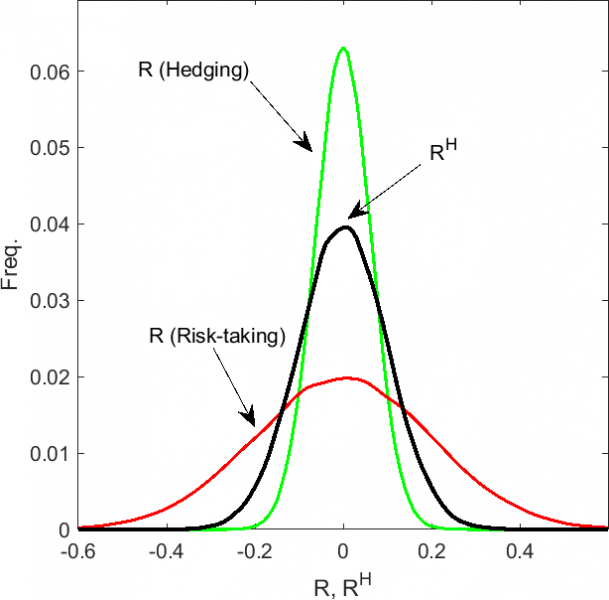
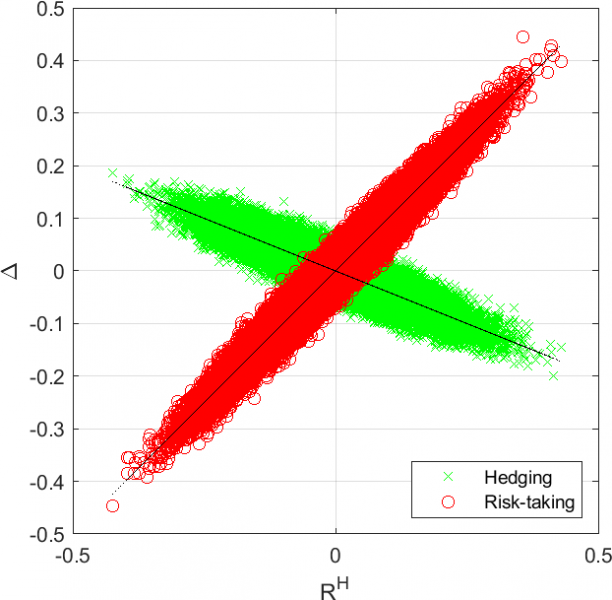
Figure 1: Illustration of hedging, risk-taking, and the return gap.
Left: distributions for RH and R for different βH. Right: relationship between Δ and RH.
 |
 |
Source: Fricke (2021).
My methodology identifies synthetically leveraged funds by comparing the distributions of RH and R (cf. left panel of Figure 1): in the absence of any unobserved actions, I expect R ≈ RH. On the other hand, if a fund manager engages in unobserved actions to hedge or take risks, this should have a measurable impact on the fund’s realized return distribution and lead to systematic differences between R and RH. For example, as illustrated by the left panel of Figure 1, for funds that follow a hedging (risk-taking) strategy, the distribution of R has less (more) probability mass in the tails of the distribution relative to RH. In light of the broad definition of synthetic leverage given above, risk-taking funds are those that make use of synthetic leverage, since their unobserved actions increase the variance of realized returns relative to the holdings-based benchmark.
This simple idea can be brought to the data via dynamic fund-specific regressions of the return gap on RH (right panel of Figure 1). The estimated coefficient, denoted as βH, makes it possible to place funds on the spectrum of hedging (βH < 0) and risk-taking (βH > 0). I propose βH as a natural indicator for fund-level synthetic leverage usage. A major concern is that systematic differences between R and RH could be driven by unobserved actions that are unrelated to the concept of synthetic leverage, most importantly fund managers’ active portfolio rebalancing. I tackle this issue in two ways: first, I explicitly control for such actions in my estimation of βH. Second, I decompose Δ into its individual components and explicitly adjust Δ for active portfolio rebalancing.
In the empirical application, I draw upon a unique dataset on German equity funds for the period September 2009 to May 2020.2 The results suggest that my proposed measure of synthetic leverage mainly picks up the effects of funds’ derivatives usage. Of lesser importance are securities lending activities, which is in line with the idea that SFTs should mainly affect the mean of the return distribution, not necessarily the variance.
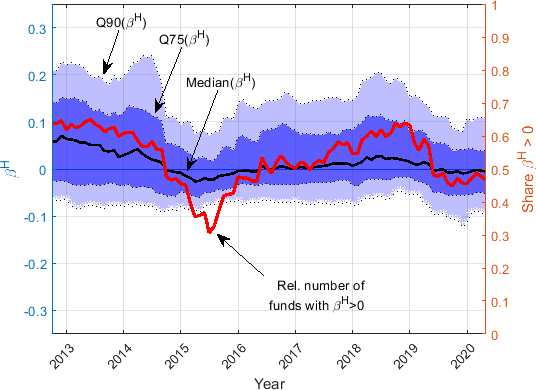
For my sample, I find that the share of funds that make use of derivatives and/or securities lending is relatively stable over time. What does vary strongly is the economic purpose of such activities, as I find a relatively steady increase in funds’ risk-taking via synthetic leverage from 2015 onwards (cf. Figure 2), which suggests that funds’ risk-taking behavior depends on the macro-financial environment.
I also find that synthetically leveraged funds (those that make use of risk-taking strategies) differ from other funds across various characteristics. For example, they tend to underperform on a risk-adjusted basis relative to other funds. Importantly, while synthetically leveraged funds displayed substantially larger outflows during the COVID-19-induced market stress period in March 2020, their flow-performance sensitivity does not differ systematically from that of other funds. Hence, investors in these funds generally do not appear to react more strongly to fund performance. However, synthetically leveraged funds show larger flow externalities, since their asset sales to meet investor redemptions result in larger losses. These larger flow externalities seem to be concentrated on periods with high levels of market volatility. This suggests that synthetically leveraged funds tend to be more fragile.
Figure 2: Cross-sectional distribution of βH over time.
Left-hand y-axis: different percentiles of βH (the median is shown as the black line).
Right-hand y-axis: the solid red line shows that relative number of funds with positive βH (Share βH > 0).
Source: Fricke (2021).
Taken together, the empirical results indicate that synthetic leverage should be closely monitored. My proposed methodology should serve as a useful framework to in this regard. Looking ahead, more work is needed to assess whether and how synthetic leverage adds fragility to the financial sector.
Breuer, P. (2002). Measuring off-balance-sheet leverage. Journal of Banking & Finance 26, 223–242.
Chevalier, J. and G. Ellison (1997). Risk taking by mutual funds as a response to incentives. Journal of Political Economy 105 (6), 1167–1200.
Choi, J. and M. Kronlund (2018). Reaching for yield in corporate bond mutual funds. Review of Financial Studies 31 (5), 1930–1965.
European Central Bank (2014). Structural and systemic risk features of Euro Area investment funds. Financial Stability Review.
Fricke, D. (2021). Synthetic leverage and fund risk-taking. Deutsche Bundesbank Discussion Paper 09/2021.
Fricke, D. and H. Wilke (2020). Connected funds. Deutsche Bundesbank Discussion Paper 48/2020.
Goldstein, I., H. Jiang, and D. Ng (2017). Investor flows and fragility in corporate bond funds. Journal of Financial Economics 126 (3), 592–613.
Huang, J., C. Sialm, and H. Zhang (2011). Risk shifting and mutual fund performance. Review of Financial Studies 24, 2575–2616.
Kacperczyk, M., C. Sialm, and L. Zheng (2008). Unobserved actions of mutual funds. Review of Financial Studies 21, 2379–2416.
Deutsche Bundesbank, Directorate General Markets, Wilhelm-Epstein Str. 14, 60431 Frankfurt am Main. Phone: +49 (0)69 9566 1279. E-Mail: daniel.fricke@bundesbank.de. The views expressed represent the author’s personal opinions and do not necessarily reflect the views of the Deutsche Bundesbank or the Eurosystem.
The dataset combines information from the investment fund statistics of the Deutsche Bundesbank, Morningstar, the Eurosystem’s Centralised Securities Database and the Securities Holdings Statistics. See Fricke (2021) for details.