
This policy brief offers an overview of an analysis of business cycle dynamics in Slovenia and the euro area. Firstly, it examines the characteristics of contractions and expansions in the two focal economies using a commonly used non-parametric approach. Furthermore, it explores alternative parametric modelling methods to challenge the findings obtained from the non-parametric counterpart. Secondly, it analyses the duration dependence of different phases of the business cycle by employing relevant (non-parametric) weak-form and strong-form testing procedures. Finally, recognising the potential usefulness of the Markov-switching modelling concept for real-time business cycle analysis, it considers a Markov-switching Bayesian dynamic factor model to estimate the probability of being in a low growth regime in the current quarter for both Slovenia and the euro area.
A widely accepted theoretical perspective on modern economies is that they fluctuate around a trend growth rate. Within this context, negative oscillations are referred to as contraction phases, while positive ones are considered expansions. Contractions are typically accompanied by higher unemployment rates, lower real income, a decrease in profitable economic opportunities, and a significant decline in production and sales for firms. Therefore, understanding business cycle fluctuations is crucial for the welfare of all economic agents and forms the basis for informed macroeconomic policy decisions.
This analysis seeks to investigate three wider research areas in the field of business cycles that have not yet been explored in the context of a small open economy within a monetary union. Firstly, it focuses on detecting turning points, examining business cycles phases, and determining the synchronisation of macroeconomic developments between Slovenia and the euro area. These aspects are analysed using dating methodologies extensively discussed by Bry and Boschan (1971) and Harding and Pagan (2002, 2003). The paper also considers parametric modelling alternatives initially proposed by Hamilton (1989) and Estrella and Mishkin (1998) to challenge existing findings. Secondly, the analysis discusses duration dependence in different phases of the business cycle, employing weak-form and strong-form testing procedures first suggested by Diebold and Rudebusch (1990, 1991), Mudambi and Taylor (1991, 1995), Pagan (1998), and Ohn et al. (2004). Finally, to analyse the current state of the business cycle, the analysis combines two distinct research fields by integrating mixed-frequency dynamic factor modelling concepts (e.g. Giannone et al., 2008; Camacho et al., 2013; Bańbura & Modugno, 2014 and Poncela et al. 2021) with Hamilton’s (1989) Markov-switching (MS) idea. This leads to the development of a mixed-frequency Markov-switching dynamic factor modelling (MS-DFM) framework, originally formulated in a Bayesian setting by Chauvet and Piger (2008).
The modified Bry-Boschan (MBBQ) algorithm is utilised to identify turning points in economic activity for both Slovenia and the euro area from 1995Q1 to 2020Q1.
Table 1: Peak and trough dates for Slovenia and the euro area based on the MBBQ algorithm

Source: Own calculations.
According to Table 1, both economies experienced two periods of economic contraction. In Slovenia, the first contraction period lasted from 2008Q2 to 2010Q1. The euro area had a similar contraction, starting one quarter earlier and ending two quarters before Slovenia’s case. The second crisis period began in Slovenia after 2011Q1 and lasted until 2012Q4, while in the euro area, it started after 2011Q3 and ended in 2013Q1. When analysing the expansion phases, three episodes can be identified in both economies. The first period lasts from the first available observation in the sample (1995Q1) until the first peak. The second period starts from the first identified trough and ends with the second identified peak. The last period extends from the second identified trough until at least the last available observation in the sample (2020Q1). The timing of all identified phases is very similar for both economies. Calculating the concordance index (Harding & Pagan, 2002; Artis et al., 2005; Claessens et al., 2012), which represents the amount of time in which the two economies are found to be in the same phase of the business cycle, yields a value of 0.93, confirming the strong integration of the small open Slovenian economy within the wider euro area economy.
Further examination of additional business cycle characteristics of Slovenia and the euro area reveals the following findings.
Table 2: : Business cycle characteristics of Slovenia and the euro area based on the MBBQ

Source: Own calculations.
In terms of the average duration of each phase, there are relatively minor differences between the two economies. However, when examining the average amplitude and average cumulative movements in each phase, greater heterogeneity becomes evident. These measures suggest that the Slovenian economy, on average, experiences contractions that are more substantial. This difference could be attributed to the size of the economies and their levels of economic development. Additionally, as a small open economy, Slovenia is highly influenced by global macroeconomic trends, making it more susceptible to adverse effects during general downturns in economic activity (López, 2015 and Corsetti et al., 2016). On the other hand, in line with the “plucking” theory (Dupraz et al., 2019 and Tasci & Zevanove, 2019) and the catching-up nature of the Slovene economy, the expansions of economic activity in Slovenia are, on average, stronger compared to those in the euro area. When examining average excess movements, Slovenia experiences convex-shaped contractions of economic activity, while the opposite holds true for the euro area. Concerning expansions, both economies display convex shapes. Coefficients of variation indicate that during expansions, there is greater diversity in terms of duration and amplitude compared to contractions. This trend is observed in both economies. Lastly, contractions, as well as expansions, tend to be steeper on average in Slovenia compared to the euro area.
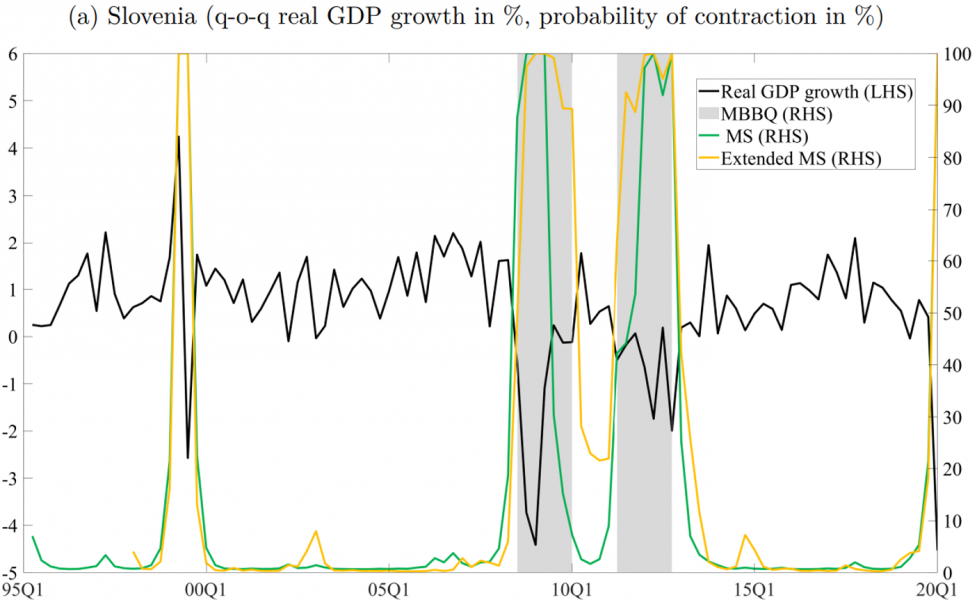
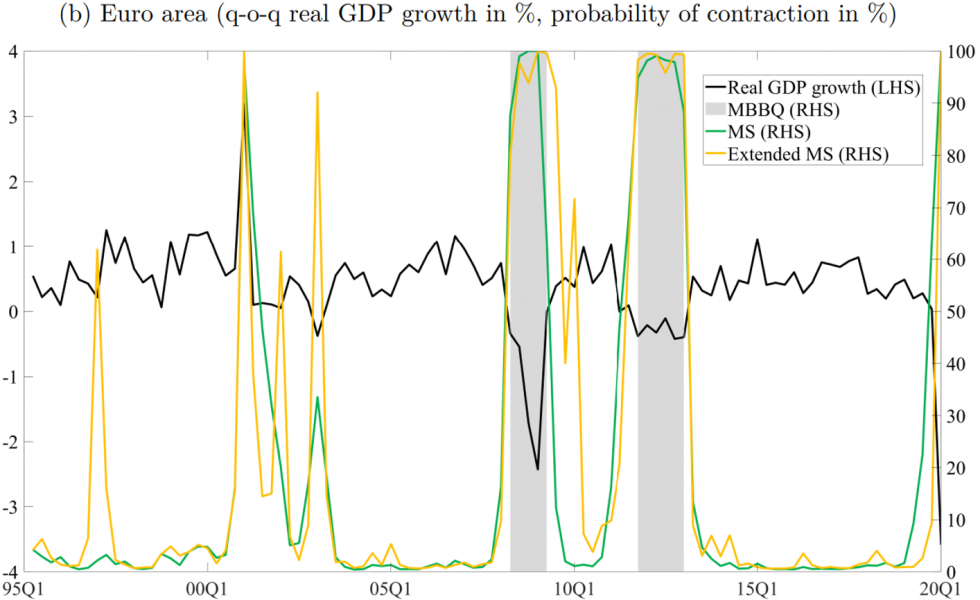
Figure 1: MBBQ algorithm vs. (basic and extended) univariate MS estimation results for Slovenia and the euro area – full-sample estimates


Source: Own calculations.
Referring to the results obtained from different parametric modelling alternatives, Figure 1 demonstrates that the employed MS models effectively identify the highest probability of contraction during the global financial crisis (first shaded area) and the subsequent contractionary wave caused by the sovereign debt crisis (second shaded area). However, due to different characteristics of the MBBQ algorithm and the univariate MS modelling approach, the latter method detects an additional period of low growth rate in the case of Slovenia1, as well as two such episodes in the euro area.2 Additionally, because the real GDP data for 2020Q2 was not available at the time of the analysis, and specific censoring rules were applied, the MBBQ algorithm fails to identify a contraction at the end of the observed sample. On the other hand, all univariate MS specifications clearly indicate a significant increase in the likelihood of a contraction related to the COVID-19 pandemic. When utilising logit model specifications for a similar analysis, certain challenges arise when identifying the sovereign debt crisis as a period of subdued economic growth.3
To analyse duration dependence in business cycle phases, it is essential to compare the probability density function of the duration data in the n-th phase with the assumed probability density function under duration independence, which implies a constant hazard rate. For the applied weak-form and strong-form testing procedures, the choice between an exponential or geometric probability density functions under the null hypothesis depends on whether the duration data is considered continuous or discrete. Since the quarterly frequency sample for Slovenia and the euro area is insufficient for conducting such an analysis, we use a measure that pertains to production in the aggregate industrial sector (excl. construction). This series serves as a relevant monthly aggregate economic activity series. The monthly variable used covers the period from 1998M01 (1995M01) up until 2020M06 for Slovenia (the euro area). To obtain duration data, we employ the monthly version of the MBBQ algorithm.
The results regarding contractions4 indicate that in Slovenia, the likelihood of exiting this phase positively increases with its duration. This suggests potential evidence of positive duration dependence. Specifically, the Shapiro-Wilk test statistic demonstrates a significant deviation from exponentiality under the null hypothesis. This finding is further supported by the significant deviations of the (modified) Brain-Shapiro and state-based test statistics from the standard normal and standard t distributions, respectively, under their respective null hypotheses. Moreover, the test statistics utilising assumed known minimum duration broadly validate the discussed findings. However, the GMD test statistic yields statistically insignificant results. In contrast, for the euro area, there is no evidence of duration dependence.
To analyse and predict the current state of the business cycle, the MS-BDFM framework is proposed, which addresses two defining characteristics of business cycles, namely the co-movement across real activity indicators and the non-linear dynamics in the contractionary and expansionary phases (Burns & Mitchell, 1946). The choice of variables for both studied economies generally aligns with previous research conducted by Stock and Watson (1989,1991), Kim and Nelson (1998), Chauvet and Piger (2008), Camacho et al. (2018), Doz et al. (2020), and Leiva-León et al. (2020), and largely coincides with the national accounts configuration. In addition to the quarter-on-quarter real GDP growth, we aim to utilise two monthly variables that capture supply side developments,5 as well as two monthly variables that relate to domestic and external demand side dynamics.6 At the time of analysis, quarterly real GDP growth was available up until 2020Q1, supply side variables until 2020M06, and demand side aggregates until 2020M05.
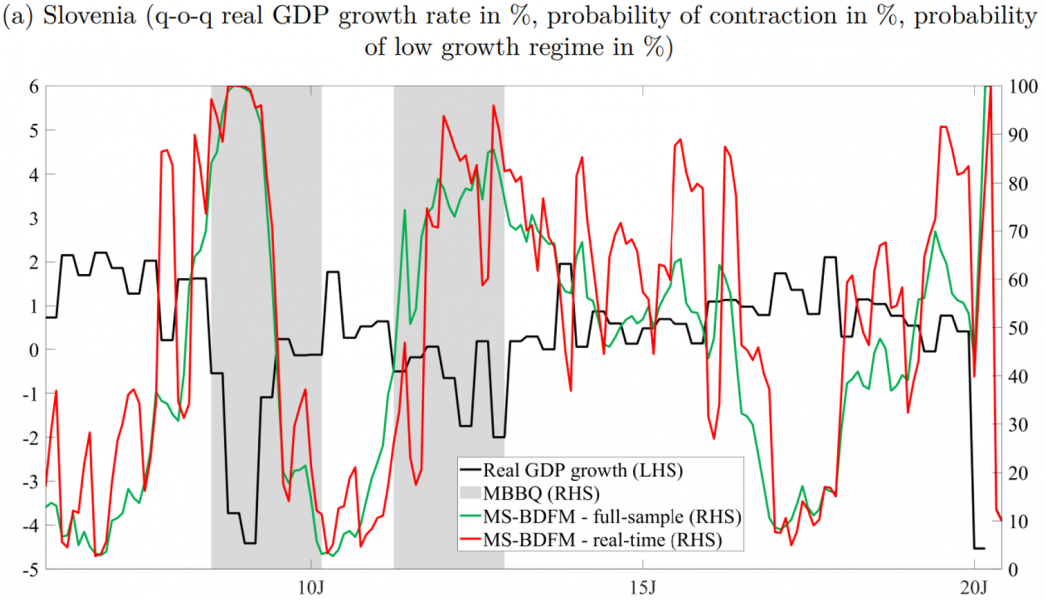
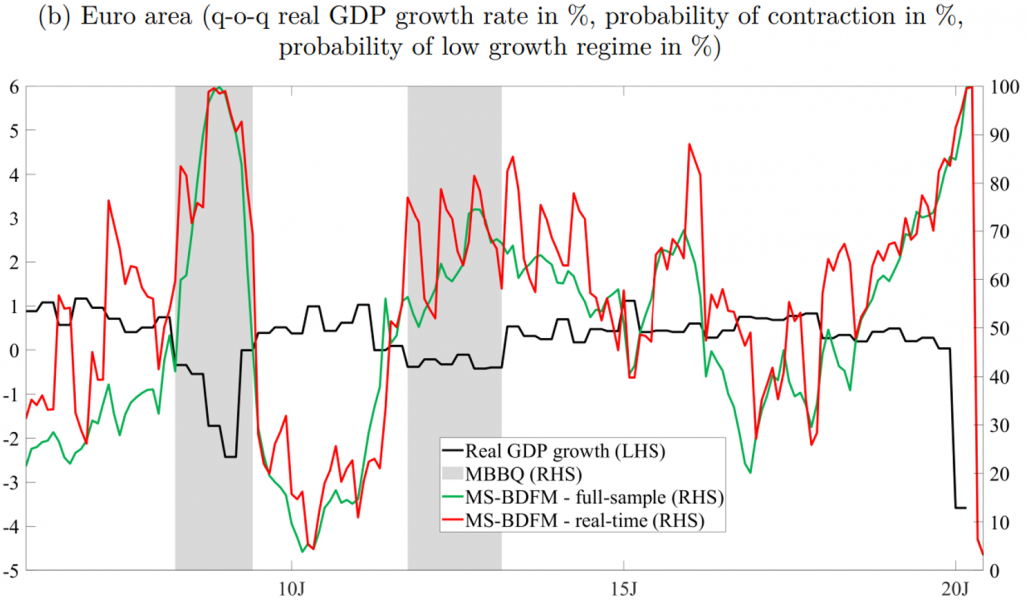
Figure 2 illustrates the probability of the low growth regime in Slovenia and the euro area, where a 50% threshold for smoothed probabilities roughly differentiates the low and normal growth regimes. Similar to Figure 1, the application of our modelling methodology to the full-sample accurately identifies the periods with the highest probability of the low growth rate regime, which have already been discussed earlier. This yields promising results for effectively capturing real-time signals. To further assess the stability of our estimates, we conduct a pseudo real-time out-of-sample recursive exercise, considering the prevailing ragged edge pattern at the time when the full-sample estimates were obtained. The estimated probabilities demonstrate the success of our approach in capturing various types of contractions in a real-time environment, which is vital for timely policymaking decisions.
Figure 2: MS-BDFM estimation results for Slovenia and the euro area (low growth regime) – full sample vs. real-time estimates


Source: Own calculations.
Based on analysing business cycle fluctuations in Slovenia and the euro area, three noteworthy results emerge. Firstly, the contractions and expansions identified in the studied economies occur at similar times, and the concordance index calculation confirms the strong integration of the small open Slovenian economy in the euro area. However, when additional business cycle characteristics are taken into account, greater heterogeneity is revealed. In terms of the applied parametric modelling alternatives, the MS modelling methodology shows promising results in identifying different phases, while logit model specifications face some challenges. Secondly, examining the presence of duration dependence in particular phase of the business cycle reveals positive duration dependence of contractions in the case of Slovenia, while the results remain largely inconclusive for the euro area. Lastly, the application of a MS-BDFM demonstrates the usefulness of the applied modelling methodology in capturing different types and magnitudes of contractions, thereby allowing the measurement of weakness in economic activity in real-time.
Artis, M. J., Marcellino, M., & Proietti, T. (2005). Dating the Euro Area Business Cycle. In L. Reichlin (ed.), Euro Area Business Cycle: Stylized Facts and Measurement Issues (p. 83-93). CEPR.
Bańbura, M., & Modugno, M. (2014). Maximum Likelihood Estimation of Large Factor Model on Datasets with Arbitrary Pattern of Missing Data. Journal of Applied Econometrics, 29(1), p. 133-160.
Bry, G., & Boschan, C. (1971). Cyclical Analysis of Time Series: Selected Procedures and Computer Programs. NBER Books.
Burns, A. F., & Mitchell, W. C. (1946). Measuring Business Cycles. NBER Books.
Camacho, M., Perez-Quiros, G., & Poncela, P. (2013). Short-Term Forecasting for Empirical Economists: A Survey of the Recently Proposed Algorithms. Foundations and Trends® in Econometrics, 6(2), p. 101-161.
Camacho, M., Perez-Quiros, G., & Poncela, P. (2018). Markov-Switching Dynamic Factor Models in Real Time. International Journal of Forecasting, 34(4), p. 598-611.
Chauvet, M., & Piger, J. (2008). A Comparison of the Real-Time Performance of Business Cycle Dating Methods. Journal of Business & Economic Statistics, 26(1), p. 42-49.
Claessens, S. Kose, M. A., & Terrones, M. E. (2012). How do Business and Financial Cycles Interact? Journal of International Economics, 87(1), p. 178-190.
Corsetti, G., Kuester, K., & Müller, G. J. (2016). The Case for Flexible Exchange Rates in a Great Recession. Cambridge Working Papers in Economics 1644.
Diebold, F. X., & Rudebusch, G. D. (1990). A Nonparametric Investigation of Duration Dependence in the American Business Cycle. Journal of Political Economy, 98(3), p. 596-616.
Diebold, F. X., & Rudebusch, G. D. (1991). Turning Point Prediction with the Composite Leading Index: An Ex Ante Analysis. In K. Lahiri & G. H. Moore (eds.), Leading Economic Indicators: New Approaches and Forecasting Records (p. 231-256). Cambridge: Cambridge University Press.
Doz, C., Ferrara, L., & Pionnier, P.-A. (2020). Business Cycle Dynamics After the Great Recession: An Extended Markov-Switching Dynamic Factor Model. OECD Statistics Working Papers 2020/01.
Dupraz, S., Nakamura, E., & Steinsson, J. (2019). A Plucking Model of Business Cycles. NBER Working Papers 26351.
Estrella, A., & Mishkin, F. S. (1998). Predicting U.S. Recessions: Financial Variables as Leading Indicators. The Review of Economics and Statistics, 80(1), p. 45-61.
European Commission (2001). European Economy. Directorate – General for Economic and Financial Affairs, 73.
European Commission (2003). European Economy. Directorate – General for Economic and Financial Affairs, 6.
Giannone, D., Reichlin. L., & Small. D. (2008). Nowcasting: The Real-Time Informational Content of Macroeconomic Data. Journal of Monetary Economics, 55(4), p. 665-676.
Hamilton, J. D. (1989). A New Approach to the Economic Analysis of Nonstationary Time Series and the Business Cycle. Econometrica, 57(2), p. 357-384.
Harding, D. E., & Pagan. A. R. (2002). Dissecting the Cycle: A Methodological Investigation. Journal of Monetary Economics, 49(2), p.365-381.
Harding, D. E., & Pagan. A. R. (2003). A Comparison of Two Business Cycle Dating Methods. Journal of Economics Dynamics and Control, 27(9), p. 1681-1690.
Kim, C.-J., & Nelson, C. R. (1998). Business Cycle Turning Points, a New Coincident Index, and Tests of Duration Dependence Based on a Dynamic Factor Model with Regime Switching. The Review of Economics and Statistics, 80(2), p. 188-201.
Leiva-León, D., Perez-Quiors, G., & Rots, E. (2020). Real-Time Weakness of the Global Economy: A First Assessment of the Coronavirus Crisis. ECB Working Paper Series 2381.
López, M. (2015). Asset Price Bubbles and Monetary Policy in a Small Open Economy. Ensayos Sobre Política Ecónomica, 33, p. 93-102.
Mudambi, R., & Taylor. L. W. (1991). A Nonparametric Investigation of Duration Dependence in the American Business Cycle: A Note. Journal of Political Economy, 99(3), p. 654-656.
Mudambi, R., & Taylor. L. W. (1995). Some Non-Parametric Tests for Duration Dependence: An Application to UK Business Cycle Data. Journal of Applied Statistics, 22(1), p. 163-177.
Ohn, J., Pagan, A. R., & Taylor, L. W. (2004). Testing for Duration Dependence in Economic Cycles. The Econometrics Journal, 7(2), p. 28-549.
Pagan, A. R. (1998). Bulls and Bears: A Tale of Two States. Walras-Bowley Lecture. Montreal: Econometric Society.
Poncela, P., Ruiz, E., & Miranda, K. (2021). Factor Extraction Using Kalman Filter and Smoothing: This is Not Just Another Survey. International Journal of Forecasting, 37(4), p. 1399-1425.
Radovan, J. (2023). An Analysis of Business Cycle Fluctuations in Slovenia and the Euro Area. Banka Slovenije Working Papers 03/2023.
Sila, U., Jemec, N., & Morgavi, H. (2015). Raising Competitiveness and Long-Term Growth of the Slovenian Economy. OECD Economics Department Working Papers 1241.
Stock, J. H., & Watson, M. W. (1989). New Indexes of Coincident and Leading Economic Indicators. In O. Blanchard & S. Fischer (eds.), NBER Macroeconomics Annual 1989, 4 (p. 351-409). Cambridge (Massachusetts): MIT Press.
Stock, J. H., & Watson, M. W. (1991). A Probability Model of the Coincident Economic Indicators. In K. Lahiri & G. H. Moore (eds.), Leading Economic Indicators: New Approaches and Forecasting Records (p. 63-89). Cambridge: Cambridge University Press.
Tasci, M., & Zevanove, N. (2019). Do Longer Expansions Lead to More Severe Recessions? Federal Reserve Bank of Cleveland Economic Commentary 2019-02.
This period corresponds to the structural break in productivity growth that occurred in 1999Q3, as mentioned by Sila et al. (2015).
These are related to the prolonged period of sluggish growth driven by the surge in oil prices, the crisis in the information and communications technology sector and the slowdown of economic activity in the United States in 2001, and a global economic uncertainty arising from the Iraq conflict at the beginning of 2003 (European Commission, 2001, 2003).
For detailed results, please refer to Radovan (2023).
For detailed tables containing the test statistics results, please refer to Radovan (2023). Regarding expansions, the findings indicate no evidence of duration dependence in Slovenia, whereas for the euro area, the results remain inconclusive.
These are industrial production index (excl. construction) and assessment of order-book levels (i.e. industrial orders).
These are total imports and exports of goods.