
This Policy Brief is based on Banco de España Documentos Ocasionales. N.º 2319. The opinions and analyses are the responsibility of the authors and do not necessarily coincide with those of the Banco de España, World Bank, or the Eurosystem.
We estimate the probability of default (PD) of Spanish non-financial corporations. We define default as having non-performing loans during at least three months of a given year. This broader definition allows us to predict firms’ financial distress at an earlier stage, before their financial conditions are too deteriorated. We estimate, by means of logistic regressions, both a general model that uses all the firms in the sample and six models for different size-sector combinations. The selected explanatory variables are five accounting ratios, which summarize firms’ creditworthiness, and the growth rate of aggregate credit to non-financial corporations to capture the role of credit availability in mitigating the risk of default. Finally, we apply our estimated PDs to the assess the impact of a program implemented by the Spanish government to provide direct aid to firms severely affected by the Covid-19 crisis.
A firm’s probability of default (PD) is a synthetic measure of its financial health. Therefore, estimated PDs are useful indicators of firms’ creditworthiness, as they can be used to classify firms according to their riskiness. This classification has clear practical applications, for example, in analyses of the impact of a particular shock on the financial health of firms or in the study of firms’ access to external finance depending on their riskiness.
In this paper we present a methodology for the estimation of the one-year ahead PDs of Spanish non-financial corporations (NFCs), summarize the main results and apply it to assess the impact of a program implemented by the Spanish government to provide direct aid to firms severely affected by the Covid-19 crisis.
While most of the literature considers that a firm is in default if it files for bankruptcy, we define default as having non-performing loans during at least three months of a given year. This broader definition of default allows us to predict firms’ financial distress at an earlier stage, before their financial conditions are too deteriorated and they must file for bankruptcy or engage in out-of-court restructuring agreements with their creditors.
We estimate firms’ PDs by means of logistic regressions, combining two large proprietary datasets of Banco de España, the Central Balance Sheet Data Office (CBSDO) and the Credit Register (CR). The CBSDO contains the financial statements, as well as other non-financial characteristics, of a large sample of Spanish NFCs. The CR contains monthly information on all bank-firm relationships over a reporting threshold of €6,000 for credit institutions operating in Spain (since 2016 there is no reporting threshold).
We merge the CBSDO with the CR to construct an unbalanced panel with annual information on nearly one million privately-owned NFCs with bank debt for the period 1996-2019, which amounts to more than 5.5 million observations. Micro-firms account for 76.7% of the observations, while the rest (large, medium, and small firms) account for the remaining 23.3%.
We estimate a general logit model that uses all the firms in our sample and six logit models for different size-sector combinations, which enables us to adjust the regressors and their coefficients to different types of firms. We consider three sectors: construction, manufacturing and other sectors. The size breakdown, motivated by the large proportion of micro-firms in the sample, is implemented by considering small, medium and large firms in one group and micro-firms in another one.
The explanatory variables are accounting ratios, which summarize firms’ financial conditions, and the growth rate of the aggregate credit to NFCs to take into account the role of credit availability in mitigating the risk of default.
In order to summarize firms’ financial conditions, we consider five groups of variables: activity (e.g., sales), current assets & liabilities, leverage (e.g., total liabilities), profitability (e.g., ROA), and liquidity (e.g., cash). We include several accounting ratios from each group based on their popularity in the literature and choose the 5 ratios with the highest explanatory power.
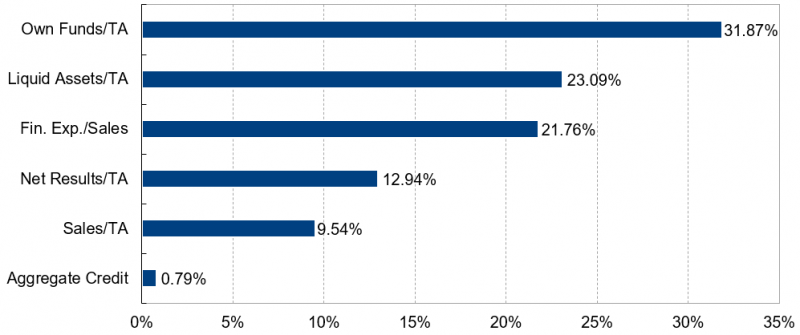
Figure 1 shows that the ratios with the highest explanatory power in the general model are the ratio of own funds to total assets, the liquidity ratio (i.e., the ratio of liquid assets to total assets), and the ratio of financial expenditures to sales, as they account for 31.9%, 23.1% and 21.8% of the variation of the R-squared, respectively.
Figure 1: Contribution of each regressor to the R-squared
(Regressors’ relative contribution – Shorrocks-Shapley decomposition)

We also compute the Receiver Operating Characteristic (ROC) curve of the general model. The ROC curve is created by plotting the sensitivity (i.e., the true positive rate) against (1-specificity) (i.e., the false positive rate) at various threshold settings. The area under the ROC curve, which ranges from zero to one, is a measure of how good a model is in discriminating the ones (in our application, a default event) from the zeroes (non-default). As we find that the area under the ROC curve equals 0.71, the model has an acceptable discriminating capacity.2
As regards the six sector-size models, the estimated coefficients have the expected sign and are statistically significant at standard levels. In particular, the coefficients of own funds to total assets, liquidity ratio, and gross value added to total assets are negative and significant, indicating that firms with more capital, more liquid assets and more gross value added relative to their size exhibit a lower PD, regardless of their sector of activity. The coefficients of ROA are also negative and significant in most sectors. In order words, a higher profitability of the firm is associated to a lower PD. By contrast, the coefficients of the ratio of financial expenditures to sales are positive and significant, indicating that firms with a lower interest burden have a lower PD in any sector. Finally, the coefficients of aggregate credit growth are negative and significant, suggesting that more credit availability mitigates the risk of default.
As there is substantial heterogeneity in the estimated coefficients of the six models, the size-sector models provide better estimates of firms’ PDs than the general model. This is confirmed by computing the area under the ROC curve, which is higher than 0.71 -the value obtained for the general model- for all the sector-size combinations, except for the model that uses micro-firms that operate in the industry labeled as “Other sectors”.
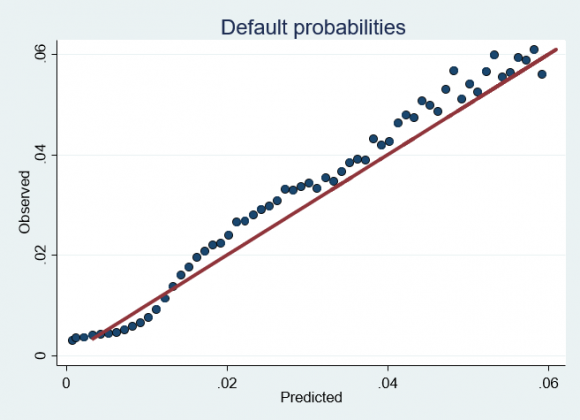
Another method to evaluate the accuracy of our models is by plotting the predicted PDs against the observed probabilities. Figure 2 shows that, for very low values, the predicted probabilities are slightly greater than the observed ones, implying that the size-sector models overpredict the PDs somewhat at the left tail of the distribution. By contrast, for values slightly greater than 1%, the models tend to underpredict the PDs, as the blue dots are nearly always above the red line. In any case, as the blue dots stay relatively close to the 45-degree line for all values, we may conclude that the models estimate fairly well the PD across different firm sizes and sectors.
Figure 2: Estimated vs. observed probabilities of default

Against the backdrop of the Covid-19 crisis, the Spanish government established the “COVID line of direct aid to sole proprietors and companies”. The program, funded with a total of €7 billion, channeled direct aid to firms and sole proprietors whose activity had been most adversely affected by the economic effects of the pandemic3 for the repayment of debts incurred by firms since March 2020. The direct aid was granted in 2021.
To assess the program we first identify firms whose expected PD increased between 2020 and 2022, was lower than 1% in 20194, and it was greater than or equal to 1% in 2022. These firms, which will be referred to as fallen angels, should have been the main beneficiaries of the program, as they were creditworthy before the pandemic and experienced a sharp deterioration in their financial conditions during the Covid-19 crisis that made them vulnerable. However, only 7.8% of them obtained direct aid and they accounted for only 4.6% of all the firms that benefited from this program.
We then evaluate the impact of the program on firms’ PDs in 2022 for different groups of companies using the six sector-size models. To do so, we transform one of the explanatory variables of the sector-size models, the ratio of own funds to total assets, to take into account the debt reduction experienced by firms that obtained direct aid. As paying off debt is, in accounting terms, equivalent to increasing a firm’s capital, the ratio of own funds to total assets of the companies that received those grants raises accordingly. We then use those models to estimate the PDs in 2022 under two scenarios: (i) the ratio of own funds to total assets taking into account the debt reduction (observed scenario); (ii) the ratio of own funds to total assets without such reduction (counterfactual scenario).
We find that the provision of direct aid reduced marginally the PDs of beneficiary firms. While the median PD of the firms that obtained direct aid is 0.72, the median PD of the same firms, had they not obtained direct aid, is 0.78, i.e., a reduction of only 0.06 pp. The program lowered more the 90th percentile of the distribution (by 0.07 pp.) than its 10th percentile (by 0.02 pp.), but still the reduction was rather small.
We also find that the effect of the program on the PDs of the fallen angels that obtained direct aid is limited, but larger than in the previous analysis. While the median PD of the fallen angels that obtained direct aid is 1.19, the median PD of the same firms, had they not obtained direct aid, is 1.29, i.e., a reduction of 0.1 pp. As before, the program lowered more the 90th percentile of the distribution (by 0.24 pp.) than its 10th percentile (by 0.10 pp.), but these reductions are larger than in the case of all firms.
Finally, we analyze the impact of the program on all fallen angels, regardless of whether they were beneficiaries of the program or not. We find that, for this group of firms, the distribution of their PDs did not change much as a result of the program, as most of them did not benefit from it.5
Blanco, R., Fernández, E., García-Posada, M., and S. Mayordomo (2023): “An estimation of the default probabilities of Spanish non-financial corporations and their applications to evaluate public policies”, Banco de España Occasional Papers, No. 2319.
Blanco, R., and S. Mayordomo (2023): “Evidence on the impact of the public guarantee and direct aid schemes on Spanish firms during the covid-19 crisis”, Banco de España Occasional Papers, No. 2317.
Hosmer, D. W. and S. Lemeshow (2000): Applied Logistic Regression. Second Edition. Wiley Series in Probability and Statistics. A Wiley-Interscience Publication.
For further details on the methodology and results, see Blanco et al. (2023).
If the area under the ROC curve ranges between 0.6 and 0.7, its accuracy is poor; if it ranges between 0.7 and 0.8, its accuracy is acceptable; if it ranges between 0.8 and 0.9, its accuracy is good; if it exceeds 0.9, its accuracy is excellent (Hosmer and Lemeshow, 2000).
Insofar as their income in 2020 had fallen by more than 30% of that in 2019.
We use this threshold because, according to the Eurosystem credit assessment framework, an asset is eligible as collateral as long as its expected probability of default is below 1%.
This result is consistent with the findings by Blanco and Mayordomo (2023) using a different measure of solvency.