menu
close

Author(s):

Sergio Gorjón | Banco de España
Jose Manuel Carbó | Banco de España

Keywords:

Bitcoin , machine learning , LSTM , interpretability techniques

JEL Codes:

C40 , C45 , G12 , G15
Historically, the price of bitcoin has been subject to large and abrupt fluctuations, as demonstrated once again by its sudden drop following the all-time high of $68,000 in November 2021 and, more recently, on the occasion of the crypto-asset market turmoil sparked by the likes of the Terra/Luna crash or the Celsius Networks collapse. Thus, a legit question arises as to which are the determinants that influence bitcoin the most. In this article we attempt to answer that question, using a flexible machine learning model, specifically a Long Short Term Memory (LSTM) neural network, to establish the price of bitcoin as a function of a number of economic, technological and investor attention variables. We then use an interpretability technique called SHAP to understand with are the most important features to the LSTM outcome. We conclude that the importance of the different variables in the formation of the price of bitcoin changes substantially throughout the analysed period. What’s more, we also find that not only does their influence vary, but that new explanatory factors seem to appear often over time that, at least for the most part, remain unknown.

1. Crypto-asset markets: latest developments and policy issues

Crypto-asset markets have been gaining increased attention from both the private and the public sector ever since its early inception in 2009. Despite the fact that their growth has been uneven for most of their existence, in recent years they showed a constant upward trend that caused an unprecedented expansion. As such, market capitalization rose from merely 15 billion US dollars, in early 2017, to around 300 billion in 2020, right before the pandemic outbreak. It then skyrocketed until a peak of around 3 trillion US dollars was finally reached in November 2021. However, 2022 has seen the market plunge again as investors sought safe haven from risky assets and events such as the collapse of Terra led to massive selloffs across the entire crypto space. In fact, one of its most prominent examples -namely, bitcoin- described a downward spiral that saw it dip below the USD 20.000 support level in June, thus losing over 40% of its January value. Since the volume of bitcoin exhibits a constant growth rate, these fluctuations in capitalization are derived from the large variations in the price of bitcoin.
Notwithstanding the above, crypto-asset markets have in parallel experienced profound transformations, giving rise -among other things- to greater institutional and retail involvement. This was mainly driven by both an increased role of traditional financial institutions in certain segments and the deployment of more sophisticated investment products such as ETFs, futures contracts and other collective investment vehicles. The market has further spread to encompass other applications like Non-Fungible Tokens (NFTs). In addition, it has also supported the emergence of so-called decentralized finance (DeFi): a highly speculative niche that offers significant returns against equally great risks. As result crypto-asset markets are progressively becoming more intertwined with the formal financial and monetary system, thus amplifying their potential to spill their inherent vulnerabilities over to the economy at large. All these changes signal the true potential of crypto-assets to become a critical element of both the financial and economic blood circuit of the society at large. They also highlight the sheer size of challenges that financial authorities need to face speedily in order to safeguard the orderly functioning of both the system as a whole and of its underlying parts. Authorities are presently engaged in a comprehensive and globally coordinated exercise to review thoroughly applicable regulatory and supervisory frameworks so as to decide when and how to adapt current rules and standards (e.g. Basel III) and when to complement those with novel ones (e.g. MiCA).
Despite the fact that its total market share has dropped from 75% in 2017 to 43% in July 2022, bitcoin continues to play a critical role to explain overall market trends in the crypto sphere, and in the development of a large number of other initiatives, either as a role model to follow, or as an example of problems/shortcomings that may have to be addressed to promote greater take-up. As a result, ascertaining the determinants of bitcoin price formation and assessing their stability over time can shed light and help steer ongoing discussions on the best way to approach increased direct and indirect exposures of critical financial market participants to crypto-assets more broadly. This knowledge will allow to establish the actual materiality of the underlying risks and consistently guide the decision on the proportionality of applicable requirements.

2. The price of bitcoin as a function of economic, technological and investor-related variables

Data and periods
In accordance with most the existing literature, we consider three different types of potential explanatory factors linked to the price of bitcoin: (i) the specific technology features of bitcoin, (ii) the evolution of the economy, and (iii) the level of attention/interest it arises among the public at large. With this in mind in order to represent the technology dimension we took into account the difficulty in finding the hash, the unique addresses, the commissions to miners (fees), the hash rate, the sum of blocks, the average block size, the sum of transfers, and the average transfer size. Regarding the economic variables, we chose to include the following ones: the price of gold and oil (separately), the SP500, the FTSE, the DOW30, the NASDAQ, and the exchange rate of several international currencies (i.e. the Euro, the British Pound, the Yuan, the Yen and the Swiss Franc) and the US dollar. Finally, as a proxy for the level of public attention we placed our focus on (i) how the search term “bitcoin” was captured in Google Trends, and (ii) the number of Tweets per day that were published with “bitcoin” as the distinctive hashtag.1
Our aim is neither to build a perfect predictive model nor to develop a sound investment tool. In fact, we are not interested in analyzing how the price of bitcoin reacts to past prices, or to strongly endogenous variables (such as bitcoin’s market capitalization). On the contrary, the purpose of this article is to understand if there is a set of factors that confidently explain the fluctuations in the price of bitcoin, and to analyze if these potential relationships are stable over time. This should help provide authorities with additional input to underpin their reflections on how to deal best with the emerging reality of crypto-assets.
Our set of data further relied on daily frequencies (business days only) from January 2015 to July 2021. Moreover, we divided the sample into three periods of time. We decided to call the first slot “launch period” (from 1 April 2015 to 1 April 2017) as it distinctively shows a steady growth in the price of bitcoin. The second slot was referred to as the “expansion period” (1 April 2016 to 1 April 2018). It features the first spike in the price of bitcoin, namely in December 2017, when it topped 20.000 US dollars. The third and last slot goes from 15 June 2019 to 15 June 2021. This was referred to as the “consolidation period” and runs from early post-pandemic days until reaching the heights of the price of bitcoin in March and April 2021 (i.e. 60.000 US dollars). In order to ensure that are conclusions were not biased, we performed robustness analysis by selecting different start and end dates. Specifically, we carried out our exercise on different start and end dates, choosing dates between four weeks before and four weeks after the original start and end dates. We found that our results did not change significantly.
LSTM model
When analysing which variables influence the price at which bitcoin is traded on exchanges we are mindful of two distinctive issues. First of all, the fact that unlike other financial instruments bitcoin lacks intrinsic value nor is it backed by a pool of assets like the so-called stablecoins. And secondly, there is no agreed theoretical model that explains ex-ante the determinants of the price of bitcoin. For this reason, we decided to use a flexible machine learning (ML) model, specifically, a long and short term memory (LSTM) neural network in order to anticipate the price of bitcoin based on a series of the aforementioned explanatory variables. LSTM (Hochreiter and Schmidhuber, 1997), is a variation of feedforward neural networks which are capable of learning the time dimension of the data. This model is consistent with our goals and the underlying circumstances surrounding bitcoin in that it allows for a flexible approach which does not impose ex-ante restrictions on the relationship between the various features2 and the price of bitcoin. Furthermore, the model can also accommodate multiple features in non-linear and non-stationary time series (Abbasimehr et al 2020 and Chen et al 2021).
We used the LSTM model in the three periods of interest. The target variable was the price of bitcoin in t, while as features we used the 25 listed elements mentioned in the previous section, with their values in t-1. Finally, we checked the accuracy of our model by making predictions in the test sample. In this way, we were able to assess the performance of the model against data sets which had not been directly involved in the training process. We followed this approach for each of the three periods of observation in which we chose to break up the lifecycle of bitcoin, dividing the sample as follows: 70% was used to train, 5% was used to validate (so that we had at least 30 days of validation) and 25% was used to test.
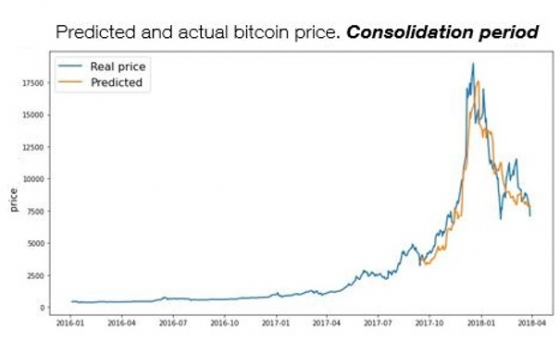
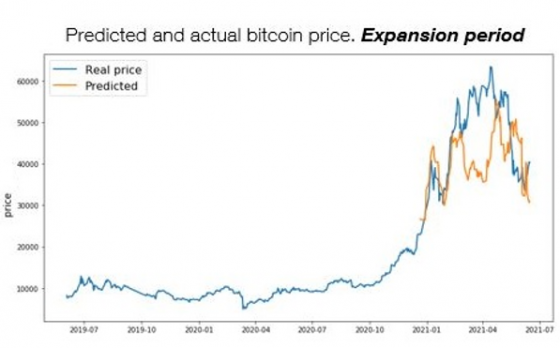
Our first finding is that the LSTM model performs reasonably well in all three periods considered. This is a particularly positive outcome in order to cement the results of our exercise since we didn’t use lagged values of the price of bitcoin as additional features. Moreover, the RMSE that we obtained was between 5% and 20% of the price. Another interesting observation is that the model offers its best outcome in the so–called launch period (5.7% of RMSE), followed by the expansion period (13.2% of RMSE). The error in the prediction is higher in the consolidation period, 21.2%, particularly during March and April 2021. Figure 1 depicts the results of the model for the second and third period, where the blue line represents the actual price of bitcoin, and the orange line the prediction made by the LSTM model. Taking this into consideration, we can first conclude that, based on the same features, the LSTM model’s performance is generally good in terms of RMSE for the first two periods considered but it worsens considerably during the third one3.

3. Which are the most influential variables for bitcoin? How does that influence change over time?

The increase in the use of ML models has awaken an interest in how to explain their outcome. There are different techniques that can accomplish this (see Molnar 2020 for a detailed review and a comprehensive list of methods). Some of the most popular techniques are the so-called model agnostic or post hoc interpretability techniques, that can be applied to any model. In this paper we use SHAP (Lundberg and Lee, 2017). SHAP is growingly gaining traction in the context of Deep Learning models (Albanesi and Vamossy 2019). In addition, it seems to have an advantage over other interpretability methods when features are correlated (Molnar 2020, Alonso and Carbó 2022).
How does SHAP determine the importance of each feature? SHAP is a technique that measures the contribution of a variable to the predicted outcome, on a particular day, compared to the average prediction. These contributions are called the Shapley values. Once we have the Shapley values, for each variable and for each day, these can be added to obtain the final importance of the variable. Therefore, SHAP can be used for a single prediction (local interpretability), or to explain which features matter more in the whole dataset (global interpretability). The approach to compute Shapley values can be explained from a game theory perspective. The game would be to reproduce the result of the model (in our case, the price of bitcoin). The players would be all possible coalitions of variables. Finally, the reward would be the contribution of each coalition towards the final outcome of the model.
Since we considered three different periods, we ended up with three different sets of predictions. We then use SHAP to analyze the extent to which each of the 25 features were important for those predictions. We found that technological variables emerged as the more relevant ones for the determination of bitcoin prices during the first two periods of our sample. However, they lost all its significance as we entered the last observation period. More precisely, variables such as hash difficulty, block size, number of transactions or unique addresses rendered virtually irrelevant to elucidate the evolution of bitcoin prices as we neared 2021. Conversely, variables pointing at the degree of public attention enjoyed by bitcoin -like Google Trends- grew progressively in importance as we came closer to the present day. In fact, in stages defined by high price volatility (2018 and 2021), the interest of the public takes on a very notable role.
In order to obtain a general overview of how each category evolved to become more or less relevant, we aggregated all the features within each distinctive group: i.e. technological variables, economic variables, and public attention variables. For each period, we combined the SHAP values of all features, and we computed which percentage belonged to each category. These results are summarized in figure 2. Thus, in the first two periods, technological variables were clearly the most important ones. Interestingly in the last period, they lost relevance quite visibly: i.e. from above 60% of all the impact in the first period, to less than 21% in 2021. Variables related to sentiment gained importance as the years went by. Their overall effect started at around 9% in the launch period, and climbed to 34% in the consolidation period. Economic variables did not present a clear trend. Taking into account that the set of variables used is the same in the three periods, and that, however, the LSTM model manages to predict much better during the first two, it leads us to suggest that new important explanatory factors may appear in 2021.
Figure 1: Predicted and actual bitcoin price. Consolidation and Expansion period 
 width=
 width=
Source: Author’s own calculations
Figure 2: Interpretability. Aggregation by category 
 width=
Source: Own authors (2022)

4. Conclusion

On account of the above, our research leads us to conclude that the formation of the price of bitcoin is still a highly complex phenomenon whose underlying causes are difficult to anticipate with an acceptable degree of uncertainty. While most of the determinants highlighted in the literature seem to clearly play a role in the evolution of bitcoin prices over time, we prove that their influence does change substantially at short notice. Moreover, possibly due to the immaturity of crypto-assets markets, oftentimes new explanatory factors emerge unexpectedly which, furthermore, may remain undetected and opaque to both investors and authorities for long periods of time. This may be one of the reason why our predictive model performs notably worse in 2021. For the above reasons, compared to other well-known and well-established asset classes, bitcoin – and, by extension, its namesakes – seems to continue to exhibit a difficult-to-predict behavior, thus making it a high-risk investment in the current landscape. It is, therefore, advisable for financial authorities to be fully aware of this fact upon deciding, at least, on the prudential treatment to be assigned to the potential exposures of banks to unbacked crypto-assets, in particular as regards market and liquidity risk, as well as in relation to the adoption of other relevant conduct-related measures in defense of investors and consumers at large.
The above may, for example, call for deeper reflections by authorities on the implied model risk and further vindicate the amount of public warnings on crypto-assets that both national competent authorities and regional regulators have been issuing over time. In addition, such circumstance is supportive of more recent measures aimed at supervising the way these offerings are advertised in order to better cope with the existing asymmetries in end-users’ knowledge and understanding of the actual risks these digital assets entail.
Our findings could also be of interest to macroprudential authorities in their assessment of the materiality of the potential risks crypto-assets place on global financial stability and the need and timeliness of the deployment of effective regulatory and supervisory actions. Against this light, financial authorities may further want to consider maintaining conservative approaches regarding their regulation so as to avoid the transmission of potentially systemic risks to the financial system as a whole.

References

Abbasimehr, H., Shabani, M., & Yousefi, M. (2020). An optimized model using LSTM network for demand forecasting. Computers & industrial engineering, 143, 106435.
Albanesi, S., & Vamossy, D. F. (2019). Predicting consumer default: A deep learning approach (No. w26165). National Bureau of Economic Research.
Alonso, A., & Carbó, J. M. (2022). Accuracy of explanations of machine learning models for credit decisions. Documentos de Trabajo/Banco de España, 2222.
Chen, W., Xu, H., Jia, L., & Gao, Y. (2021). Machine learning model for Bitcoin exchange rate prediction using economic and technology determinants. International Journal of Forecasting, 37(1), 28-43.
Hochreiter, S., & Schmidhuber, J. (1997). Long short-term memory. Neural computation, 9(8), 1735-1780.
Lundberg, S.M. and S.I. Lee (2017). “A unified approach to interpreting model predictions” Advances in neural information processing systems, pp. 4765-4774.
Molnar, C. (2020). Interpretable machine learning. Lulu. com.
  • 1.

    Due to the way in which we have obtained the data, we do not know if the intensity of searches on Google and the tweets have been generated by a specialized audience (investors) or a more general one. That is why from now on we will refer to these variables broadly as public attention variables.

  • 2.

    In machine learning, “features” is the term used for the individual independent variables that are taken as an input to make predictions over a target variable. Throughout the article we will use the term “features” together with “factors”, “drivers” and “variables” interchangeably. 

  • 3.
    These results could, however, be improved if the lag price value of bitcoin is included as an extra feature. However, this is achieved at the expense of interpretability since SHAP places a lot of weight on the lag of the price of bitcoin. Obviously, for the purposes of our exercise, these results are neither be very informative nor useful. Therefore, we refrained from taking this path for the rest of the exercise. 

About the authors

Sergio Gorjón

Sergio Gorjón joined Banco de España in 1998 where he is currently a manager in the Financial Innovations Division. His team is in charge of monitoring and assessing the nature and potential implications of emerging financial service providers and technologies, including its regulatory challenges. Prior to this, he spent 20 years in the Payment Systems Department where he held different positions and frequently dealt with policy and oversight-related topics around innovative value propositions in areas such as blockchain, cryptoassets, instant payments or artificial intelligence. He has also worked for the World Bank as a Financial Sector Specialist.

Jose Manuel Carbó

Jose Manuel Carbó joined Banco de España in 2019 as a senior economist in the Financial Innovation Division, where he analyses the latest trends in financial innovation. Specifically, he studies the impact of machine learning on credit risk modelling, and different topics related to cryptocurrencies and financial stability. Prior to this, he was a consultant in ScanmarQED London and Research Associate in Imperial College London. He has a PhD in economics from Universidad Carlos III de Madrid. His research interests are machine learning, financial innovation, and policy analysis. He has published articles in several journals like Journal of Applied Statistics, Economics of Transportation, Financial Innovation, and Regional Science and Urban Economics, among others.

More on these topics

Tags: