This policy brief is based on the Basel Committee on Banking Supervision Working Paper No 42 “Banks’ window-dressing of the G-SIB framework: causal evidence from a quantitative impact study” by the same authors. The views expressed are those of the authors, not necessarily those of the Basel Committee on Banking Supervision or its member institutions. The authors are very grateful for support by Isabella Cha (Bank for International Settlements).
Banks’ market activity is commonly observed to contract around period-end dates. This “window‑dressing” behaviour has micro- and macro-prudential implications, and potential repercussions for financial stability and the operationalisation of monetary policy. However, data limitations have prevented studies from attributing incentives for this behaviour to specific policies, restricting policymakers’ ability to impose mitigating reforms. Exploiting a uniquely extensive bank-level dataset, we use a difference-in-differences approach to test whether this behaviour can be explained in part by banks’ efforts to arbitrage the Global Systemically Important Bank (G-SIB) framework. The analysis suggests that window dressing incentivised by the G-SIB framework is responsible for around half of the observed year-end contractions in notional over-the‑counter derivatives, accounting for aggregate reductions of approximately 3% to 5% of total global activity per year.
In the wake of the global financial crisis in 2008, the Basel Committee on Banking Supervision (BCBS) implemented a sweeping package of “Basel III” macroprudential reforms to increase banking sector resilience to shocks. These reforms require banks to hold higher levels of regulatory capital and liquidity to be able to absorb shocks and mitigate systemic risks. These systemic risks are often measured by regulatory metrics that are based on point-in-time (commonly period-end) data reported or disclosed by banks. Such frameworks can be sensitive to regulatory arbitrage behaviour by banks, known as “window dressing”, whereby banks temporarily reduce market activity and balance sheet items in anticipation of period-end reporting dates in order to lower their resulting prudential requirements.1
Contractions in activity around these reporting dates result in misleading bank disclosures and misrepresentation of bank risk. Window dressing also increases market volatility and limits market access for clients. This has the potential to disrupt market functioning, impact the transmission of monetary policy, and amplify shocks that coincide with period‑ends (Du et al (2018), Brand et al (2019), and Bassi et al (2024)).
The G-SIB framework assigns regulatory capital surcharges to banks based on their global systemic importance. Banks report data across 13 different indicators (capturing activity in a range of markets, such as notional over-the-counter (OTC) derivatives and repurchase agreements(repos)). Based on these data, a “G‑SIB score” is calculated for each bank that reports to the G-SIB assessment exercise measuring its relative global systemic importance.
Based on the G-SIB scores, banks are categorised into “buckets” with fixed thresholds that determine their capital surcharge (BCBS (2013)). These buckets are relatively wide, and crossing a threshold implies a significant change in the additional capital requirements that banks are subject to (between 0.5% and 1% of total risk-weighted assets). Crucially, banks only report data as of the end of the business year. Thus, if banks window dress their activity at year-end, they may be able to reduce the capital surcharge imposed on them by the G-SIB framework. Furthermore, given that G-SIB scores are measured based on banks’ activity relative to the activity across all banks, window‑dressing of only a few banks can affect the capital requirements of all banks and lead to the misidentification of G-SIBs and misallocation of capital.
A number of studies have sought to test whether window‑dressing behaviour is correlated with incentives generated by the G-SIB framework (Berry et al (2021), Behn et al (2022), Garcia et al (2023)). However, data limitations in the sample size of banks and time-period have constrained the strength of the conclusions drawn.
A novel and uniquely extensive data set allows us to investigate whether banks apply window dressing with the objective of arbitraging the G-SIB framework. The data set covers nearly all global banks that have been part of the assessment sample2 in the G-SIB exercise (70 of the largest banks across 16 jurisdictions, accounting for 97% of global notional OTC derivatives activity). Our data set covers quarterly observations between 2010 and 2022, crucially, stretching back to before the implementation of capital surcharges in the G-SIB framework in 2016. The quarterly frequency of our data set allows us to study whether year‑end indicator values systematically deviate from intra-year values.
We focus on notional OTC derivatives and repos, which have been identified as most sensitive to window-dressing behaviour, in part due to the high frequency and liquid nature of the markets they are traded in.3
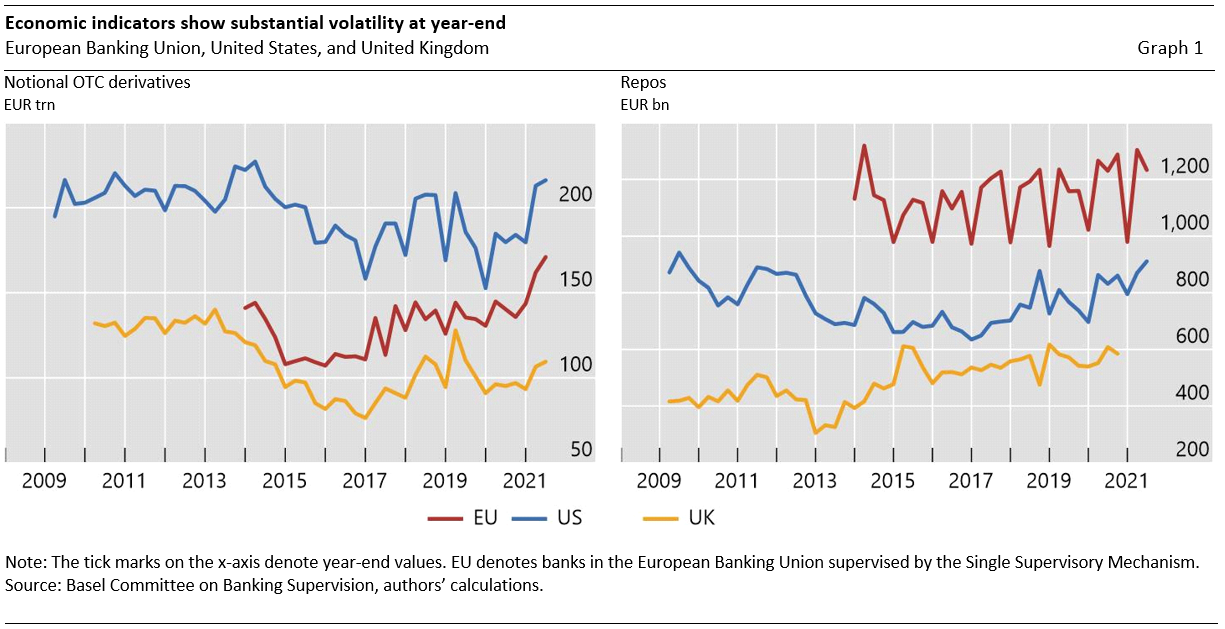
Graph 1 depicts the aggregate evolution of notional OTC derivatives and repos in the European Banking Union, United States, and United Kingdom. They reveal a tendency for contractions at year-end relative to adjacent quarter-ends after the implementation of capital surcharges in the G-SIB framework in 2016, depicted by rather sharp ‘V‑shapes’.4 These contractions are in the magnitude of several trillions of euros for notional OTC derivatives, and hundreds of billions of euros for repos.
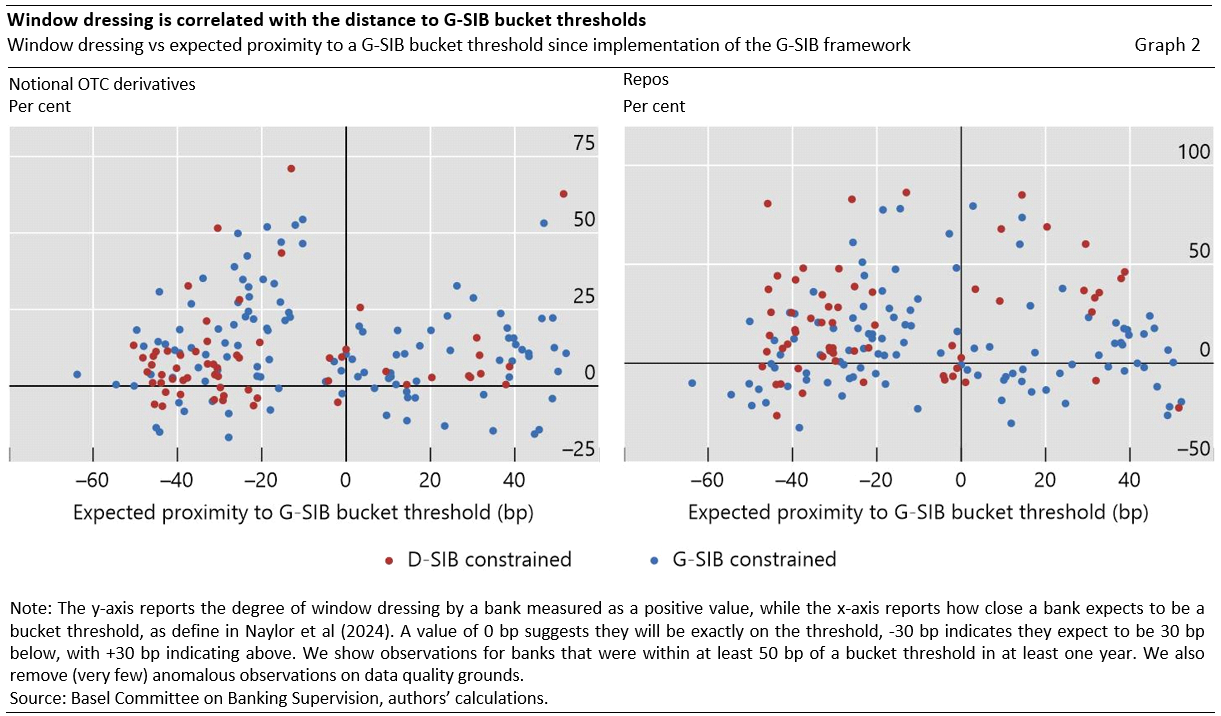
Motivated by these observations we investigate whether banks’ window-dressing behaviour is correlated with incentives originating from the G-SIB framework. Graph 2 plots the degree of banks’ window dressing of notional OTC derivatives and repos against their expected proximity5 to a G-SIB bucket threshold in a given period, since 2016, when the G-SIB capital requirement began to be gradually phased in. In this graph the degree of window dressing is defined with a reversed sign, ie an indicator value that is lower at year-end relative to the average of the two adjacent quarters leads to a positive amount of window dressing.
Focusing on notional OTC derivatives (left panel), we make three observations. First, some degree of window dressing is observed across the board; year-end activity is lower than that in adjacent quarters for most banks in most periods (most of the observations are above the horizontal line). Second, banks that expect to be just below a bucket threshold seem to window dress particularly significantly to avoid a potential move up into the higher bucket (depicted by especially sharp window dressing just to the left of the vertical line).6 Third, banks that are constrained by the D-SIB buffer (red dots) seem to, on average, window dress less than banks constrained by the G‑SIB buffer (blue dots), since under the Basel III standards, the higher of the D-SIB and G-SIB buffer binds for any given bank.
In relation to repos, amongst banks that are constrained by the G-SIB buffer, we also see evidence of typically greater window-dressing behavioiur by banks below bucket thresholds (right panel). However, this correlation is observationally slightly less striking than it is for notional OTC derivatives.
To test for causality, we employ a “difference-in-differences” empirical strategy, ie we compare the window‑dressing behaviour of two different groups of global banks before and after the implementation of the G-SIB framework. We classify banks into two groups: those that have a strong incentive to reduce their G-SIB score and those that have less of such an incentive in relation to the G-SIB framework. Motivated by the observations in Graph 2, we use banks’ expected proximity to the fixed bucket thresholds that determine the level of the required capital surcharges. Banks that find themselves closer to these thresholds are more likely to be able to materially reduce their capital requirements by cutting year‑end activity and dipping (or remaining) below these thresholds. Thus, these banks face greater incentives to window dress their activity in the context of the G-SIB framework for the purposes of saving regulatory capital costs. Crucially, this is an exogenous source of window-dressing incentives.
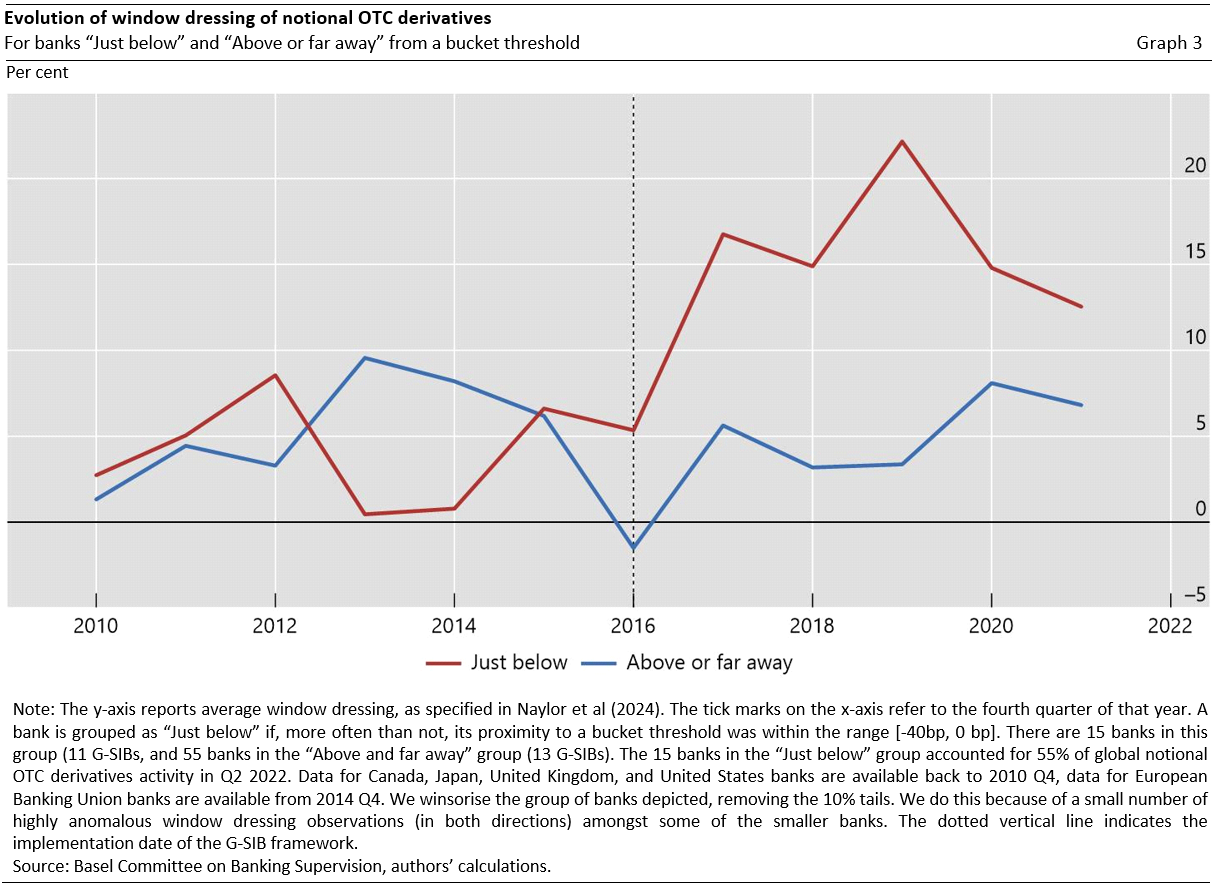
In Naylor et al (2024) we analyse window dressing of both notional OTC derivatives and repos. In this section, however, we focus on our results for notional OTC derivatives, where we believe our findings are more statistically robust.7 Graph 3 shows the evolution of average window dressing of notional OTC derivatives for banks “just below” G-SIB bucket thresholds and banks “above or far away” from bucket thresholds. We observe that, while prior to the implementation of the G-SIB framework the two groups of banks exhibited similar window-dressing behaviour, after implementation banks “just below” G-SIB bucket thresholds began to window dress significantly more than peers.
We show in Naylor et al (2024) that this finding holds conditioning on important bank balance sheet characteristics such as size, business model, level of Tier 1 capital, and location of headquarters. Importantly, we confirm that our findings identify a causal relationship by showing that, conditioning on these characteristics, the two groups of banks were not systematically different to one another prior to implementation. Thus, the banks that are “above or far away” from G-SIB bucket thresholds provide a good counterfactual for how banks “just below” bucket thresholds would have behaved absent the implementation of the G-SIB framework.8 These results are robust to a host of checks.
Moreover, our results are economically, as well as statistically, significant. The response of banks to the G-SIB framework is directly responsible for year-end contractions of notional OTC derivatives activity in the order of magnitude of €30 trillion. This equates to approximately 3% to 5% of global notional OTC derivatives activity (€634 trillion in Q2 2022), and explains nearly half of the contractions observed at year‑end (just below €70 trillion in Q2 2022).
Banks’ attempts to lower their G-SIB scores are a material driver of year‑end window‑dressing activity. Efforts to reduce incentives to window-dress for the purpose of arbitraging the G-SIB framework would not only reduce the risk of misidentifying G-SIBs and misallocating regulatory capital within the G‑SIB framework. It would in addition potentially have positive spillovers for the accurate provision of risk in other regulatory frameworks and materially reduce year-end volatility in certain markets. Indeed, the BCBS has recently published a consultative document setting out potential measures to address window-dressing behaviour in the G-SIB framework (BCBS 2024). Those potential measures would require banks to report and disclose the indicators used to calculate G-SIB scores based on average values over the reporting year, rather than year-end values, thereby curtailing banks’ incentives to reduce their activity at year-end.
Bassi C, M Behn, M Grill and M Waibel (2024): “Window dressing of regulatory metrics: evidence from repo markets”, Journal of Financial Intermediation, vol 58, April.
Basel Committee on Banking Supervision (2013): Global systemically important banks: updated assessment methodology and the higher loss absorbency requirement, July, www.bis.org/publ/bcbs255.htm.
——— (2024): “Global systemically important banks – revised assessment framework”, Consultative Document, March, www.bis.org/bcbs/publ/d571.htm.
Behn M, G Mangiante, L Parisi and M Wedow (2022): “Behind the scenes of the beauty contest: window dressing the G-SIB framework”, International Journal of Central Banking, vol. 18, no 5, pp 1-42, December.
Berry J, A Khan and M Rezende (2021): “How do US global systemically important banks lower their capital surcharges?”, Board of Governors of the Federal Reserve System, FEDS Notes, 31 January, doi.org/10.17016/2380-7172.2480.
Brand C, L Ferrante and A Hubert (2019): “From cash-to securities-driven euro area repo markets: the role of financial stress and safe asset scarcity”, European Central Bank, Working Paper Series, no 2232, January.
Du Q, A Tepper and A Verdelhan (2018): “Deviations from covered interest rate parity”, The Journal of Finance, vol 73, no 3, pp 915–957.
Garcia L, U Lewrick and T Secnik (2023): “Window Dressing and the Designation of Global Systemically Important Banks”, Journal of Financial Services Research, vol 64, pp 231-264, September.
Naylor, M, R Corrias and P Welz (2024): “Banks’ window-dressing of the G-SIB framework: causal evidence from a quantitative impact study”, BCBS Working Paper, no 42, March.
Domestic Systemically Important Banks and Global Systemically Important Banks receive higher loss absorbing capital requirements (D-SIB or G-SIB capital surcharge) based on the degree to which they are deemed to be respectively domestically or globally systemically important.
The assessment sample of the G-SIB framework is made up by the 75 largest banks according to their total leverage ratio exposure measure including insurance business, and banks that are smaller but that had been identified as G-SIBs in the previous year.
Notional OTC derivatives constitute a separate G-SIB indicator in the Complexity category and also contribute to five other indicators. Repos are not a separate indicator but contribute to several in the Size, Cross-Jurisdictional and Interconnectedness categories of the framework.
We depict aggregate evolutions for the major jurisdictions in Naylor et al (2024). In some jurisdictions, we observe contractions in year-end activity also prior to 2016. This is consistent with the fact that there are also other contributing factors to this behaviour, such as cyclical supply-side dynamics, that are independent of the G-SIB framework, which we account for in our empirical analysis.
Banks cannot precisely know their proximity to a bucket threshold in advance, because their scores depend also on the business activity of all other banks in the G-SIB assessment sample and on exchange rate developments. We capture banks’ expected proximity by their proximity in the previous assessment exercise, adjusted to account also for banks’ growth rate relative to the market and exchange rate dynamics, since the previous assessment exercise.
The relative nature of the framework means there is always a degree of uncertainty around G-SIB scores. Indeed, we see that the banks “just below” a threshold which window dress significantly, seem to aim for a healthy buffer below the threshold, to reduce the risk of being moved up.
In Naylor et al (2024) we identify a statistical association between the G-SIB framework and window dressing of both notional OTC derivatives and repos. However, while the findings on notional OTC derivatives hold against a host of robustness checks, we are more cautious in our conclusions for repos. In relation to the latter, we find that accounting for banks’ business model is particularly important (ie whether a bank is capital market or retail focused; determining their ability to window-dress).
In technical terms, we show that the so-called “parallel trends hypothesis” holds; a requirement for causal inference. In the context of this study the hypothesis assumes that the behaviour in both groups of banks would have been the same without the introduction of the new regulation.