This Policy Brief is based on the World Bank Economic Review article (2024) titled “A Measurement of Aggregate Trade Restrictions and Their Economic Effects”. The views expressed in this article are those of the authors and do not necessarily reflect those of the IMF.
Abstract
We introduce a new Measure of Aggregate Trade Restrictions (MATR) using data from the IMF’s Annual Report on Exchange Arrangements and Exchange Restrictions. MATR captures direct and indirect official government policy related to the international flow of goods and services. The indicator covers an unbalanced sample of up to 157 countries from 1949 to 2019—thus, more comprehensive country and time coverage than existing measures of de jure restrictiveness. As such, MATR empowers empirical analysis to increase coverage in research related to trade and trade-related restrictions. Using MATR, we show that direct and indirect restrictions to trade are associated with significant contractions in output.
Our work is motivated by the importance of aggregate measures of trade restrictions to the flow of goods and services across borders.
We present a novel way to quantify restrictions on international trade at the aggregate level. In constructing this measure, we are guided by several principles. A good measure should be: (a) simple, (b) based on plausible, relevant policy inputs, which are (c) quantitative and objective, (d) timely and easily updateable, (e) available for many countries, for (f) a substantial period of time, (g) consistent across countries and time, while covering (h) tariffs, nontariff barriers, and other indirect forms of restrictions (including restrictions to payments) that have a salient impact on cross-border trade in goods and services.
Our Measure of Aggregate Trade Restrictions (MATR) is based on data from the IMF’s Annual Report on Exchange Arrangements and Exchange Restrictions (AREAER). It is constructed through an in-depth process that combines: (i) information in the AREAER online database (available from 1999 onwards); (ii) the narrative accounts of official government policies obtainable in printed versions of the AREAER country-year specific reports (from 1949 onwards).
The underlying variables in MATR cover tariffs, nontariff barriers, and restrictions on requiring, obtaining, and using foreign exchange for current transactions. More precisely, MATR is based on the IMF’s AREAER binary variables related to: (a) exchange measures; (b) arrangements for payments and receipts; (c) imports and import payments; (d) exports and export proceeds; and (e) payment and proceeds from invisible transfers and current transfers. Each of these categories is further decomposed into subcategories.
The data of the constructed MATR for each country—both the aggregate series and the underlying components—is freely available for use in research and is regularly updated, at: https://sites.google.com/view/m-atr/.
We examine the historical time-series characteristics of MATR. Figure 1 shows the development of MATR for advanced economies (AEs) and emerging market and developing economies (EMDEs). Both groups began in comparable situations and engaged in significant liberalization efforts from the early 1970s through the early 2000s. Since then, liberalization appears to have plateaued, reflecting broader historical trends in trade policy.
We broaden the exploration to scatterplots of MATR against four key variables in Figure 2, in each case using data from 1996. Richer countries tend to have fewer trade and other international restrictions impacting trade. Reassuringly, the relationship is strongly negative. Smaller countries tend to be more open and have fewer restrictions, as reflected in the upward-sloping scatter of MATR against population in the top-right graph. MATR is strongly correlated with the tariff rate measure and de facto trade openness, the ratio of exports and imports to output.
One does not want to over-interpret these simple scatterplots, since each is a simple bivariate cross-sectional relationship, taking no account of other factors. But collectively they provide reassurance.
Figure 1. Evolution of MATR over Time, by Income Groups
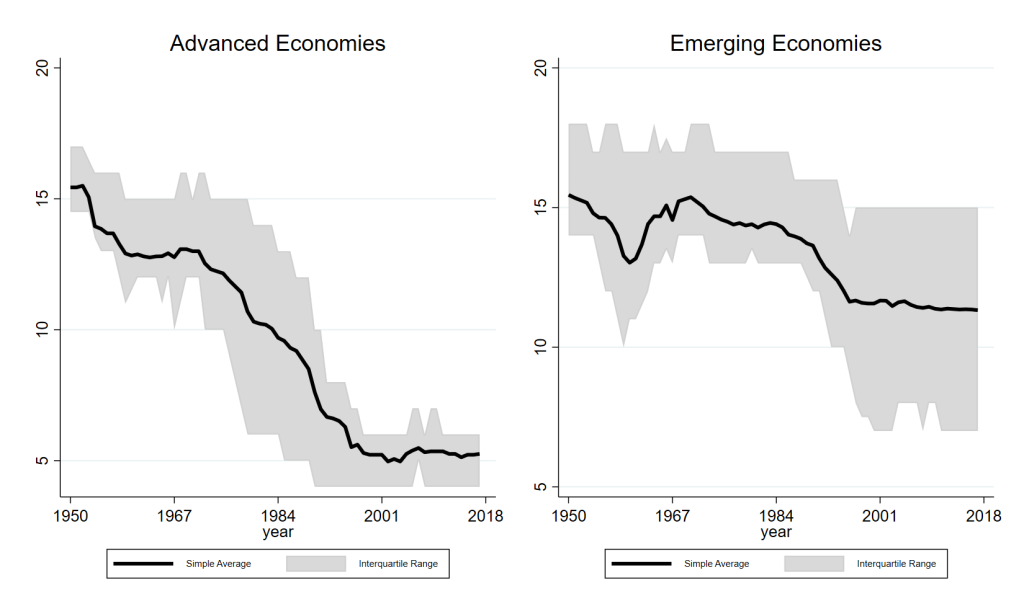
Source: Author’s estimations.
Note: Year-specific average and interquartile range of MATR for Advanced and Emerging Economies, classified following the IMF World Economic Outlook.
Figure 2. MATR in 1996 vs. Income, Size, Tariff, and Trade Openness
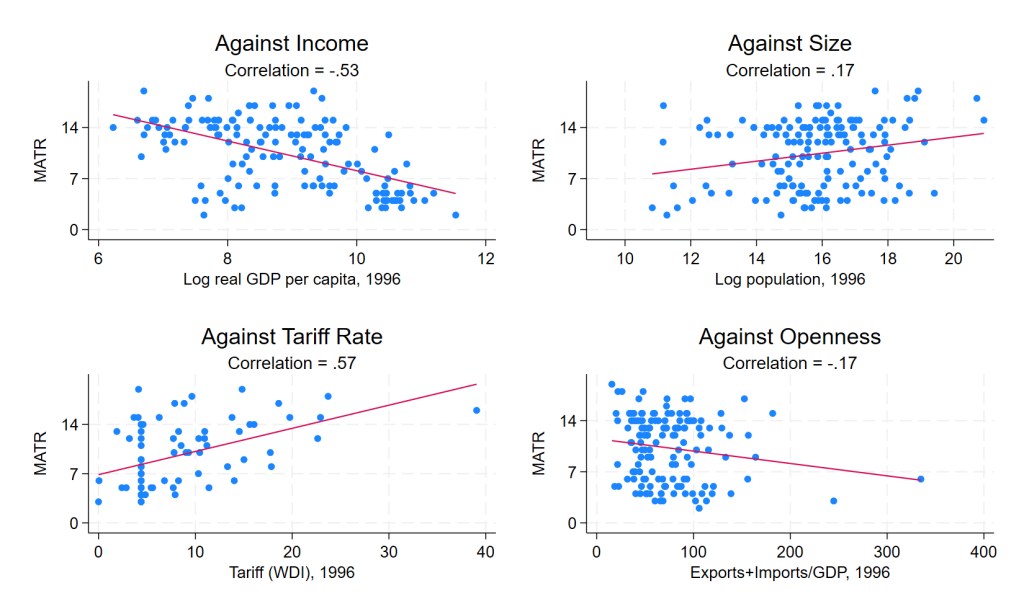
Source: Author’s estimations.
Note: MATR scattered against four key variables for 1996 (mid-point of the sample).
To give an example of how MATR could be used in empirical work, we examine the periods after changes in MATR, to see if the dynamics of aggregate output are different following changes in trade policy (see Ostry and Rose 1999 for an exposition on the theoretical channels through which tariffs affect output and other macroeconomic variables). We used a straightforward methodology to estimate flexible ‘impulse response functions’ which allow us to estimate the effects of MATR changes on output, holding other factors fixed through an econometric model.
The results, graphically portrayed in Figure 3, suggest that a one standard deviation increase in MATR is associated with an immediate reduction in output by 0.2 percent, and by 0.7 percent five years after. This effect is highly significant in both statistical and economic terms and in line with the expected sign on the effect of tariffs on output from empirical studies (Furceri et al. 2020).
To put it in perspective, however, it is almost twice the medium-term output effect of a one-standard deviation increase in tariff rates found in Furceri et al. (2022). It is also economically plausible, close in magnitude to simulation results from a sectoral, computable, general equilibrium model with input-output linkages (Caliendo et al. 2017) based on the same magnitude of reduction in trade restrictions.
To get a sense of the components of MATR driving the results for AEs and EMDEs, the analysis examines the effects of the different components of trade restrictions: invisibles, exports, imports, payments, and exchange measures. The results in AEs seem to be driven mainly by export and import restrictions (the latter are statistically significant), while those for EMDEs seem to be driven mainly by restrictions related to invisibles, exports, imports, and payments (all statistically significant).
Digging deeper on the potential channels of influence, we find that the key driver is the statistically and economically significant decrease in labor productivity, which declines by about 1.5 percent after five years. This result confirms the standard view that protectionism can lead to a meaningful reduction in the efficiency with which labor is used, and thus output. An increase in trade barriers is also associated with lower investment, consistent with the idea that firms face less competition from abroad and have therefore less incentive to invest. Unsurprisingly, both imports and exports fall with an increase in protectionism. Another predictable result is that increased trade barriers lower consumption, by around 1 percent after five years; this result is unsurprising, given the decline in income.
Figure 3. Response of (log) GDP to Changes in MATR (percent)
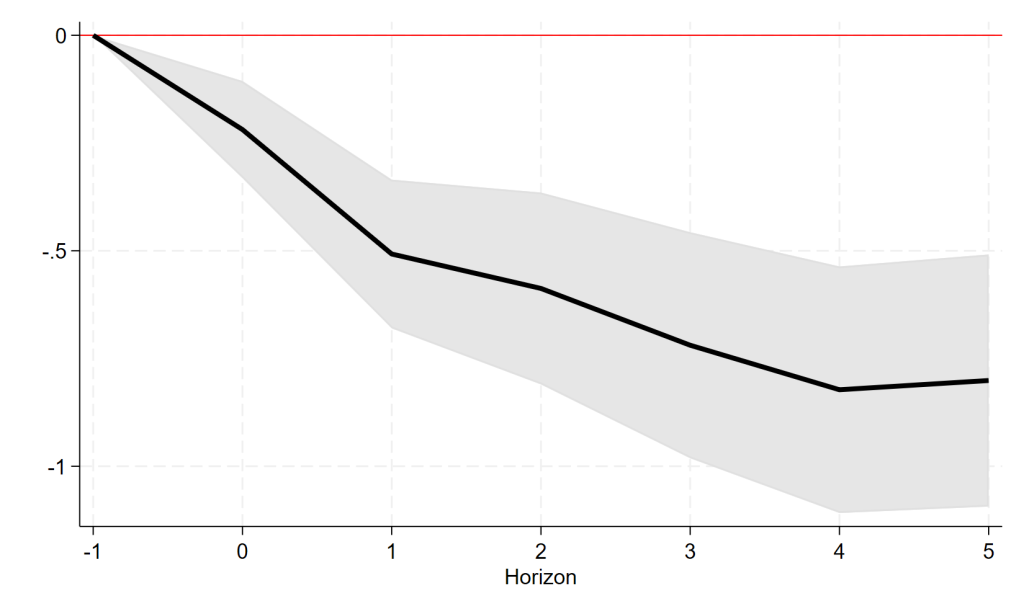
Source: Author’s estimations.
Note: Cumulative IRF’s after one standard deviation increase in MATR; shaded area is 90 percent confidence interval; Driscoll-Kraay standard errors.
Our attempt is to introduce a policy-related trade restrictiveness indicator—encompassing more than 150 countries and spanning seven decades—that would empower empirical analysis.
This work could be extended further in at least three dimensions. We have only considered impediments to the international flow of goods and services; future scholars may also want to consider FDI. Another aspect for other researchers to contemplate is lagged values. In measuring capital mobility, Chinn and Ito (2008) use moving averages of current plus lagged values; the present only considers contemporaneous values. Finally, MATR has been developed without a rigorous theoretical model, which would be necessary to understand the general equilibrium and welfare consequences of trade restrictions more deeply.
MATR is not without caveats. It does not have a direct theoretical underpinning and diverges from the literature in that it is an aggregate measure of direct and indirect trade restrictions composed only of aggregate data, rather than a weighted average of disaggregated data.
For all these reasons, MATR does not displace any existing measures of aggregate trade restrictions; rather, it should be thought of as a complementary measure with a higher coverage that would, in turn, improve—in terms of number of countries, time span, and granularity—empirical analysis on trade policies.
Caliendo, L., R. Feenstra, J. Romalis, and A. Taylor. 2017. “Theory and Evidence for the Last Two Decades of Tariff Reductions.” VoxEU Column. VoxEU (CEPR).
Chinn, M., and H Ito. 2008. “A New Measure of Financial Openness.” Journal of Comparative Policy Analysis 10(3): 309–22.
Furceri, D., S. Hannan, J. Ostry, and A Rose. 2022. “The Macroeconomy after Tariffs.” World Bank Economic Review 36(2): 361–81.
Furceri, D., S. Hannan, J. Ostry, and A Rose. 2020. “Are tariffs bad for growth? Yes, say five decades of data from 150 countries.” Journal of Policy Modeling 42(2020): 850–859.
Ostry, J., and A. Rose. 1992. “An Empirical Evaluation of the Macroeconomic Effects of Tariffs.” Journal of International Money and Finance 11: 63–79.