Disclaimer1
In earlier work, we argued that to keep the effective reproduction number (Re) for COVID-19 below one, and thus prevent a second wave of infection, mobility would have to remain around halfway between the pre-lockdown level and the full-lockdown level. We concluded that the only way to allow a return to a higher level of mobility would be to introduce a test, contact tracing, and isolation regime. This note discusses the key parameters that determine whether such regimes are effective or not. This depends in part on the characteristics of the virus itself and in part on the operation of the regime. Our conclusion is that it will be a challenge to control the COVID-19 epidemic using test, contact tracing, and isolation alone. This suggests that mobility will have to remain below the pre-lockdown level to limit the risk of a second wave of infection.
In the context of COVID-19, a test, contact tracing, and isolation regime would involve: first, testing all individuals who show symptoms and isolating those that test positive; and second, tracing all the contacts that they had while they were infectious and isolating all those that test positive.
In epidemiological models, four key parameters determine the effectiveness of this approach.
First, the number of initial cases (N). The higher the number of initial cases, the greater the number of contacts that need to be traced.
Second, the basic reproduction number (R0). The higher the basic reproduction number, the greater the number of contacts that need to be traced.
Third, the percentage of transmission that occurs prior to the isolation of symptomatic individuals (λ). This could be due to either delays in testing, infectiousness starting prior to the onset of symptoms, or infection by asymptomatic individuals. The greater this percentage, the harder it is to control the transmission.
And fourth, the percentage of contacts that need to be traced (μ). Not all contacts need to be traced, but a sufficiently large number of potentially infectious individuals need to be removed from the population to limit ongoing transmission.
In their epidemiological model, Fraser et al.2 illustrate the relationship between R0 and λ when 100% of symptomatic individuals are isolated and 100% of their contacts are traced (Figure 1).
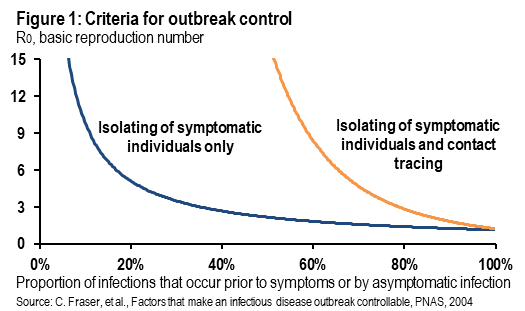
The two contour lines show combinations of R0 and λ where new infections are stable (essentially the interventions put Re at one). The area below each contour represents combinations of R0 and λ where the epidemic can be controlled by test, contact tracing, and isolation, and the area above each contour represents combinations of R0 and λ where the epidemic cannot be controlled by test, contact tracing and isolation alone.
The blue contour represents the conditions under which an epidemic can be controlled by the isolation of symptomatic individuals alone. The intuition behind this contour is straightforward. If λ is below 10%, then the epidemic can be controlled regardless of the level of R0 as long as 100% of symptomatic individuals can be isolated. At the other corner solution, if λ is close to 100%, then the epidemic cannot be controlled by isolation of symptomatic individuals alone because by the time symptomatic individuals have been identified the infection has been passed on.
The situation looks better when we look at the orange contour, which shows combinations of R0 and λ which lead to infection control if there is immediate isolation of all symptomatic individuals and the testing and isolation of 100% of their contacts. If λ is less than around 60%, then any epidemic can be controlled regardless of the level of R0. Of course, if λ is equal to 100%, then the epidemic cannot be controlled by test, contact tracing, and isolation alone.
In another model, Hellewell et al.3 consider combinations of N, R0, λ and μ that affect the likelihood of an epidemic being controlled by test, contact tracing, and isolation alone, without any other restrictions on mobility.
Figure 2 shows the percentage of contacts that need to be traced (μ) if outbreaks are to be controlled given different values of R0. So, for example, if R0 is 3.5, then in order to have a 50% chance of controlling the epidemic, over 80% of contacts need to be traced. As R0 declines, then it is much easier to control the epidemic. This exhibit assumes that λ is around 15% and N equals 20.
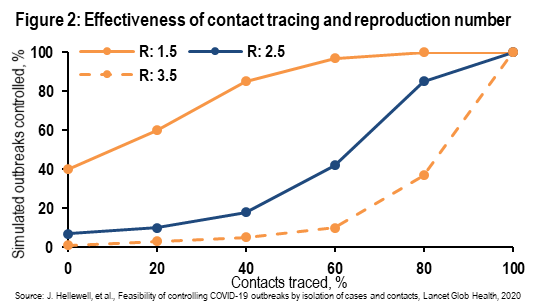
Figure 3 shows the impact of pre-symptomatic transmission. The greater the degree of pre-symptomatic transmission, the greater the proportion of contacts that need to be traced to control the epidemic. For example, if 30% of transmission occurs prior to symptom onset, then to achieve a 50% likelihood of controlling the epidemic more than 80% of contacts need to be traced. By contrast, if only 1% of transmission occurs prior to symptom onset, then to achieve a 50% likelihood of controlling the epidemic only around 60% of contacts need to be traced. This exhibit assumes that R0 equals 2.5 and that N equals 20.
Hellewell et al. go on to illustrate the importance of the initial number of cases (N), and delays in the isolation of symptomatic individuals and asymptomatic infectiousness, both of which increase λ. The higher N is, the harder it is to control the epidemic because many more contacts need to be traced. This creates logistical challenges for the operation of the regime. Similarly, increases in the lag from symptom onset to isolation and an increased percentage of infections by asymptomatic individuals both make controlling the epidemic harder, even with very high levels of contact tracing, as the model of Fraser et al. illustrates.

We can apply these results to SARS and COVID-19 to illustrate how an epidemic can be controlled by test, contact tracing, and isolation regimes. SARS was easily controlled by simply isolating symptomatic individuals because R0 was not too high (2 to 4) and λ was very low (less than 10%). An individual only became infectious several days after the onset of symptoms (high temperature) and there was no asymptomatic transmission. Thus, widespread checking of temperatures was sufficient to identify and isolate infected individuals before they became infectious.
By contrast, COVID-19 looks much harder to control by test, contact tracing, and isolation alone because λ is very high. Around 80% of COVID-19 infections are either asymptomatic or in individuals who have very mild symptoms. Furthermore, with COVID-19, infectiousness begins one to two days prior to the onset of symptoms for symptomatic individuals. It is plausible that with COVID-19, λ could be in a range between 80% and 100%. According to Fraser et al., this would make COVID-19 a very challenging disease to control even with 100% isolation of symptomatic individuals and 100% tracing, testing, and isolation of their contacts. We recognize the uncertainty surrounding the extent to which asymptomatic individuals are as infectious as symptomatic individuals: to the extent that they are less infectious, this reduces λ.
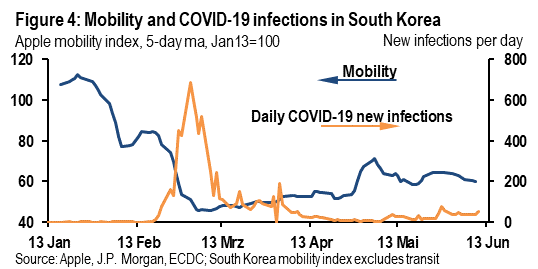
The challenge of managing COVID-19 even with a very effective test, contact tracing, and isolation regime can be seen in the experience of South Korea. Infections have remained subdued for the past three months but this is partly due to the still-subdued level of mobility (Figure 4). It doesn’t appear that the test, contact tracing, and isolation regime has allowed mobility to return to close to pre-lockdown levels without there being a risk of a second wave of infection.
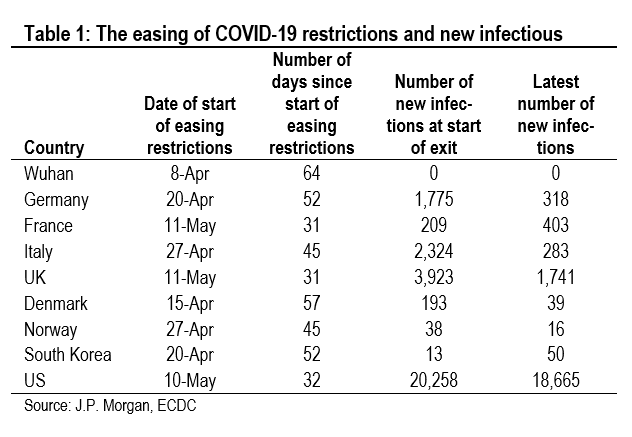
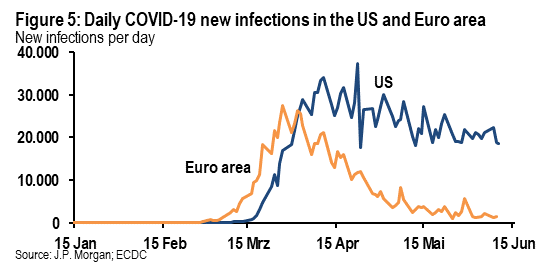
The role of the number of daily new cases has received less attention than it should have in considering the efficacy of test, contact tracing, and isolation regimes, in our view. It is striking that China and South Korea both got new infections down to very low levels before easing lockdown restrictions. By contrast, lockdown easing in Western Europe and the US started with still high levels of new infections (Table 1). Thus, it will be challenging to get test, contact tracing, and isolation regimes set up in Western Europe and the US that will be effective enough to allow mobility to return to pre-lockdown levels. Thus, if mobility rises too high, there is a risk of a second wave of infection. The US looks especially vulnerable (Figure 5).
But, test, contact tracing, and isolation regimes don’t need to be 100% effective to be helpful in allowing mobility to rise further without risking a second wave of infection. Any reasonably effective test, contact tracing, and isolation regime will help to reduce Re and thus limit the additional pressure from limited mobility needed to keep Re below one. But, at the end of the day, to control COVID-19, it looks likely that countries will not only need a relatively effective test, contact tracing, and isolation regime, but they will also need to ensure that mobility levels remain somewhat below where they were pre-lockdown.
Courtesy J.P. Morgan Chase & Co, Copyright 2020.
Disclaimer: This SUERF policy brief includes research content published by J.P. Morgan on 11 June 2020. J.P. Morgan has granted SUERF a limited right to re-publish this research on an information only basis. J.P. Morgan has no liability in any regard for the publication of this SUERF policy brief or SUERF’s decision to reproduce any J.P. Morgan research content contained herein. It is not an offer to buy or sell any security/instruments or to participate in a trading strategy or trading activity; nor does it constitute any form of personal financial advice or investment recommendation by J.P. Morgan. This information should not be relied upon for any reason whatsoever by any natural or legal person. For important current standard disclosures that pertain to J.P. Morgan’s research please refer to J.P. Morgan’s disclosure website: https://www.jpmm.com/research/disclosures
C. Fraser, et al., Factors that make an infectious disease outbreak controllable, PNAS, 2004.
J. Hellewell, et al., Feasibility of controlling COVID-19 outbreaks by isolation of cases and contacts, Lancet, 2020.