

This policy note is based on a speech by Isabel Schnabel, Member of the Executive Board of the European Central Bank (ECB), at an event organised by Columbia University and SGH Macro Advisors (New York, 27 March 2023).
The ECB’s unconventional monetary policy measures have significantly expanded its balance sheet over the past eight years, including a significant growth of excess reserves on the liabilities side. In recent years, these excess reserves have been instrumental in steering short-term interest rates. Having started quantitative tightening (QT) on 1 March 2023, which will lead to a decline in the volume of excess reserves, the ECB faces complex choices on how it will implement its monetary policy in the future. Ultimately, the size of the ECB balance sheet should only be as large as necessary to provide sufficient liquidity and effectively steer short-term interest rates towards levels that are consistent with medium term price stability.
On 1 March, the ECB started quantitative tightening (QT) after eight years of balance sheet expansion.1 At the peak in 2022, the Eurosystem held monetary policy assets corresponding to around 56% of euro area GDP. This was substantial both from a historical perspective and in international comparison (Figure 1, left-hand side).
The first wave of balance sheet expansion was a response to the low-inflation environment prevailing in the aftermath of the euro area sovereign debt crisis. Between 2014 and 2016 headline inflation ran persistently below our target of 2%, averaging just 0.3% (Figure 1, right-hand side).2
Figure 1: Balance sheet expansion reflects the ECB’s response to low inflation and the pandemic
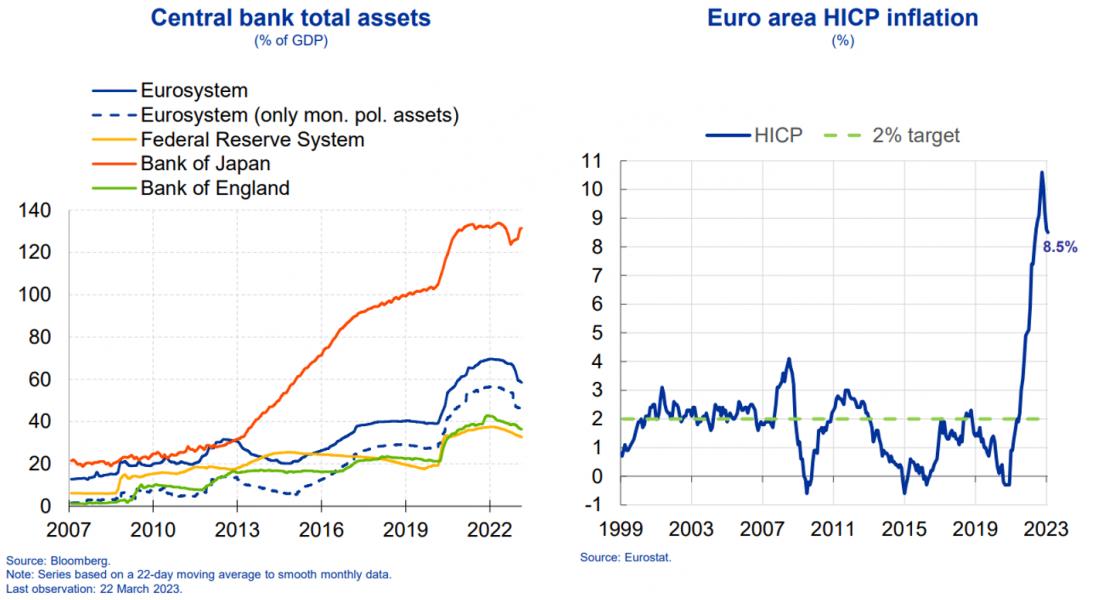
As the key policy rate had already been lowered into negative territory in 2014 and was approaching the effective lower bound, the ECB started employing “unconventional” monetary policy tools. It offered banks a series of targeted longer-term refinancing operations (TLTROs) and conducted asset purchases to stimulate economic activity and raise inflation.
These operations led to a sharp increase in monetary policy assets and, correspondingly, to a rise in central
bank liabilities in the form of excess reserves – that is, reserves held by banks beyond minimum
requirements (Figure 2).
Figure 2: Sharp increase in monetary policy assets and corresponding rise in excess reserves
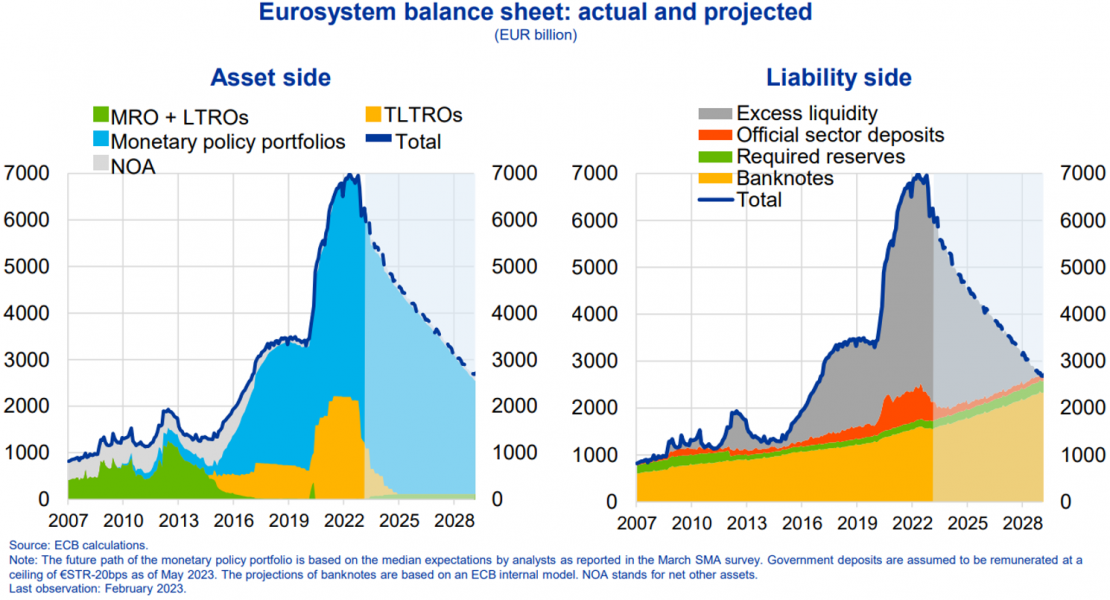
The second wave of balance sheet expansion came with the ECB’s response to the pandemic. The launch of the pandemic emergency purchase programme (PEPP) and adjustments to the third series of TLTROs resulted in a further large increase of our monetary policy assets. These measures were necessary to protect the euro area economy from falling into a full-blown financial crisis and economic depression.3
Last July, balance sheet growth came to a halt when we ended net asset purchases under the asset purchase programme (APP). Since autumn, the size of the balance sheet has been declining as banks began repaying their outstanding TLTRO loans. The balance sheet has declined further since the beginning of March, when we stopped fully reinvesting maturing securities bought under the APP.4
Further TLTRO repayments and a gradual run-down of our monetary policy bond portfolio imply that our balance sheet is expected to decline meaningfully over the coming years, thereby reducing excess liquidity.5
However, the size of our balance sheet will not return to the levels seen before the global financial crisis. Over the long run, the ECB’s balance sheet size is driven by growth in reserve requirements and by what are known as autonomous factors, which are beyond the control of the Eurosystem. 6
Autonomous factors include official sector deposits and, most importantly, banknotes in circulation, which have shown a strong upward trend since 2007.7 If, over the coming years, these autonomous factors were to increase in line with recent historical patterns, we estimate that excess liquidity will be fully absorbed by 2029.8
At that point, the Eurosystem’s balance sheet would still be about three times the size it was in 2007, and it would need to increase again to meet growth in currency demand.
From a monetary policy perspective, the question is whether the decline in the volume of excess reserves will affect our ability to implement monetary policy. In recent years, excess reserves have been instrumental in effectively steering short-term interest rates.
In this note, I will first explain why the decline in excess reserves matters for the conduct of monetary policy. I will also describe why it may be difficult to return to the way we implemented monetary policy before 2008, when excess liquidity was limited.
I will then illustrate the benefits and costs of alternative operational frameworks that differ in the way they provide reserves to the banking system, and discuss how these may accommodate the characteristics of a heterogeneous currency union like the euro area.
These comments reflect my own current thinking on the matter, which may evolve as the Governing Council reviews the Eurosystem’s operational framework – a process we hope to conclude before the end of the year.
Before 2008, the ECB, and most other major central banks, implemented monetary policy in a “corridor” system. This means we provided just enough central bank reserves to meet banks’ aggregate liquidity needs stemming from net autonomous factors and minimum reserve requirements.
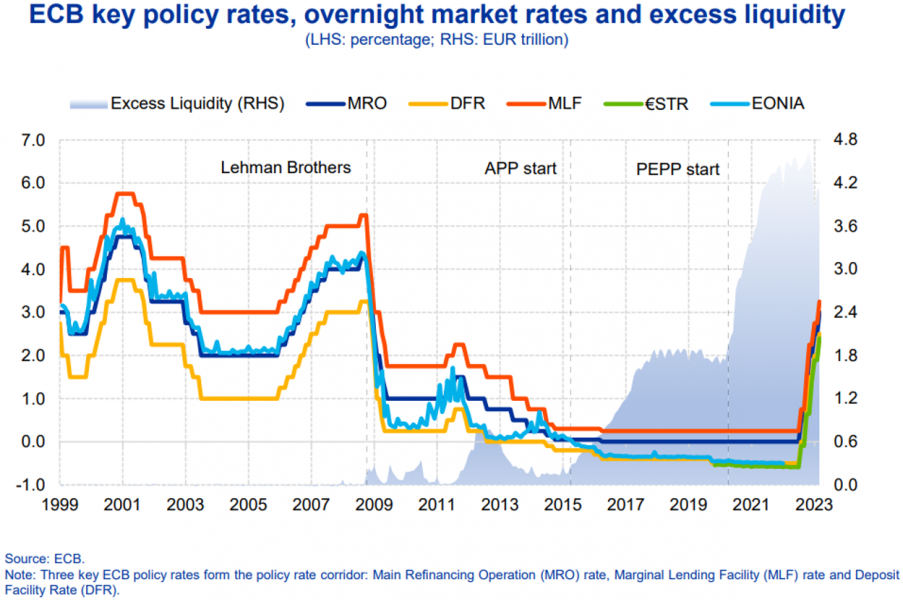
In matching supply and demand in aggregate terms, the ECB steered unsecured overnight rates to the middle of the corridor (Figure 3).9 As a result, excess liquidity was negligible. This framework was successful in practice: the ECB was able to closely align overnight rates with the interest rate charged on our weekly main refinancing operations (MRO) (Figure 4).
However, after 2008 periods of rising excess liquidity due to monetary policy operations repeatedly pushed unsecured overnight rates towards the deposit facility rate (DFR), which is the floor of the interest rate corridor. When we launched the APP in 2015 and excess liquidity started to grow rapidly, we effectively moved from a “corridor” towards a “floor” system.
Figure 3: Eurosystem implemented monetary policy in a corridor system before 2008
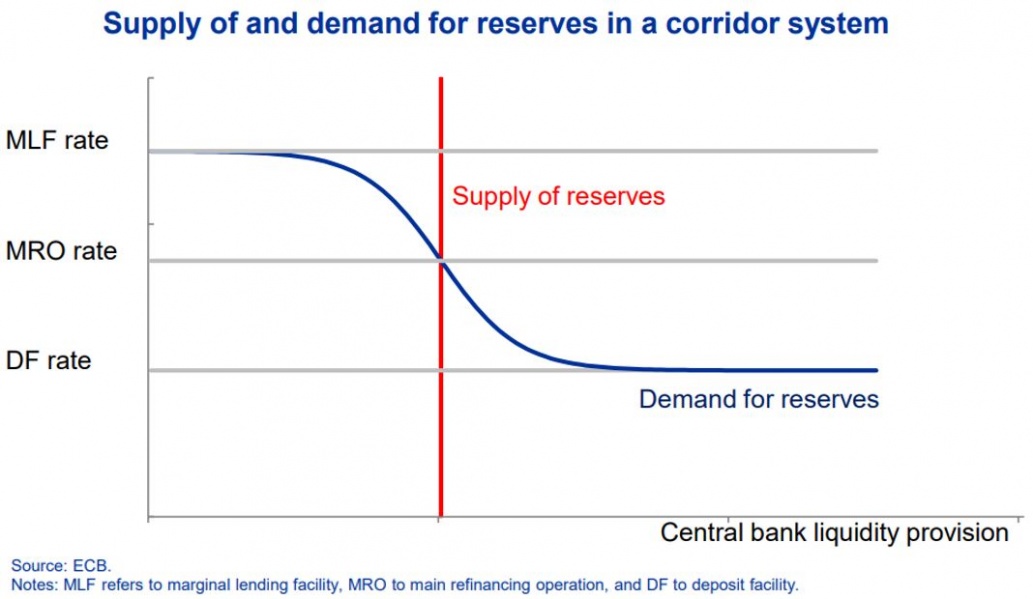
Figure 4: EONIA traded in the middle of the corridor when supply of reserves matched demand
Conceptually, the supply curve shifted further and further to the right, now crossing the demand curve at its flat, highly elastic part, where discrete changes in liquidity have very little effect on the level of short-term interest rates (Figure 5).
Figure 5: Eurosystem effectively operated in a floor system as of 2015
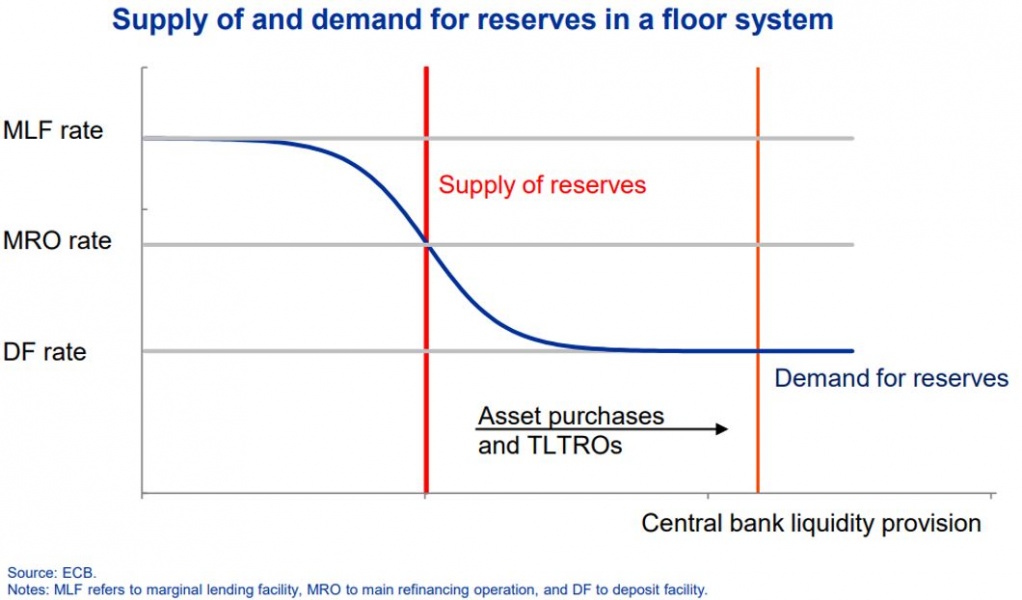
Balance sheet run-down will reverse this shift, progressively moving the supply curve back towards the steep part of the demand curve. In the current situation, the large volume of excess reserves means that we should still be at a significant distance from that point. Yet, uncertainty about the exact location of the “kink” is very high.
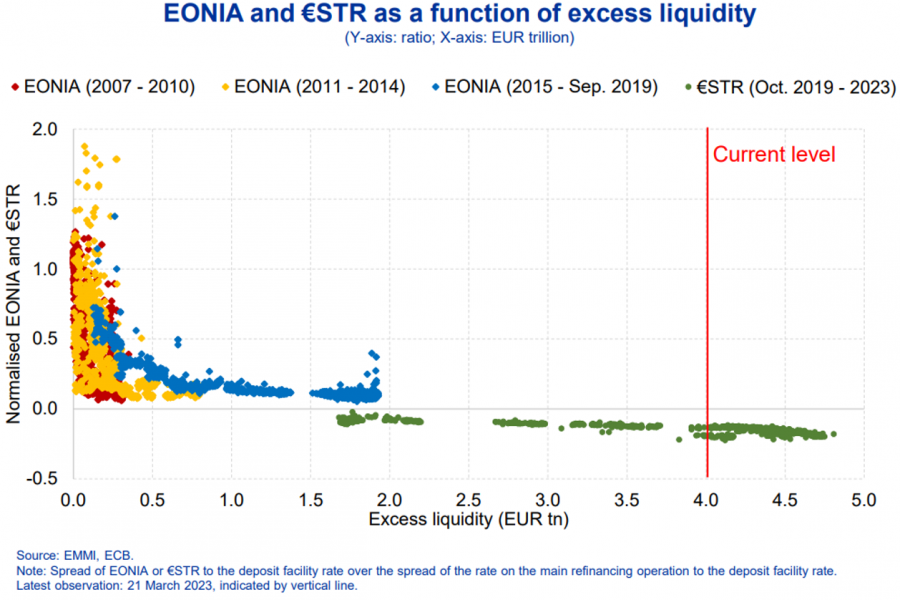
One reason for this is that years of large excess reserves have blurred our understanding of banks’ underlying demand for liquidity. The aggregate level of reserves has been largely determined by the quantity of asset purchases rather than by banks’ liquidity choices.
Should the demand for reserves have shifted more fundamentally, then upward pressure on interest rates may well start earlier than estimates of the historical relationship between the level of excess reserves and market rates would suggest (Figure 6).
This is broadly what happened in the United States in the autumn of 2019, when interest rate volatility spiked unexpectedly although the supply of reserves was still considerably above what banks had indicated in surveys as their lowest comfortable level.10
It is therefore prudent to start reviewing the options available to ensure that the ECB maintains control over the level of short-term money market rates during the process of balance sheet normalisation.
Figure 6: Historical patterns may be unreliable due to structural shifts in reserve demand
The natural starting point for a discussion about the operational framework is to ask what has changed since we last operated in an environment of balanced liquidity conditions.
The ability to effectively steer overnight rates in the pre-2008 corridor framework relied heavily on two features.
The first was our ability to accurately predict the reserves needed to steer the operational target towards the middle of the corridor. In the steep part of the demand curve, even small changes in the supply of, or demand for, reserves can lead to large swings in interest rates.
The second feature was a well-functioning interbank market that distributed central bank reserves efficiently across the euro area banking system. The standing facilities were not designed to be used on a regular basis but were supposed to accommodate unforeseen liquidity shocks.11
Over the past decade, however, the environment in which central banks operate has changed fundamentally.
In the aftermath of the global financial crisis, large excess reserves and prevailing fragmentation have considerably reduced the volume of reserves intermediated through the unsecured interbank market (Figure 7).
Figure 7: Large excess reserves contributed to decline in unsecured interbank market trading
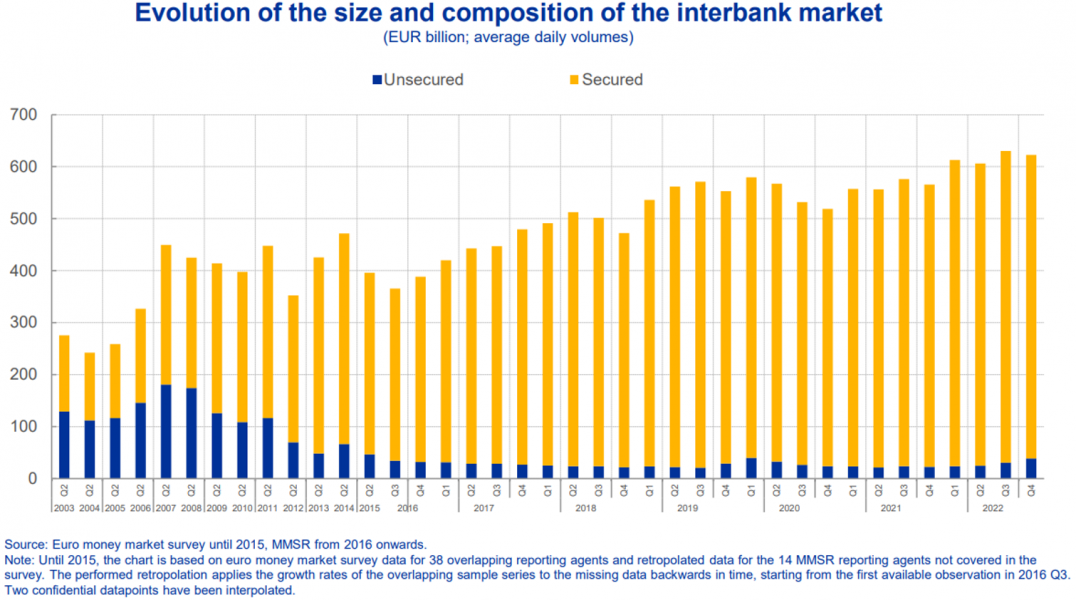
It is not clear whether the interbank market will recover once excess reserves become scarcer.
A structural decline in banks’ risk tolerance may have permanently reduced the capacity of the euro area interbank market to efficiently distribute reserves across banks all over the euro area. And while tighter financial regulation has made our financial system safer and more resilient, it has made interbank lending more costly.12
Banks might also want to hold much higher liquidity buffers than in the past. The recent experience of Sveriges Riksbank is a case in point.
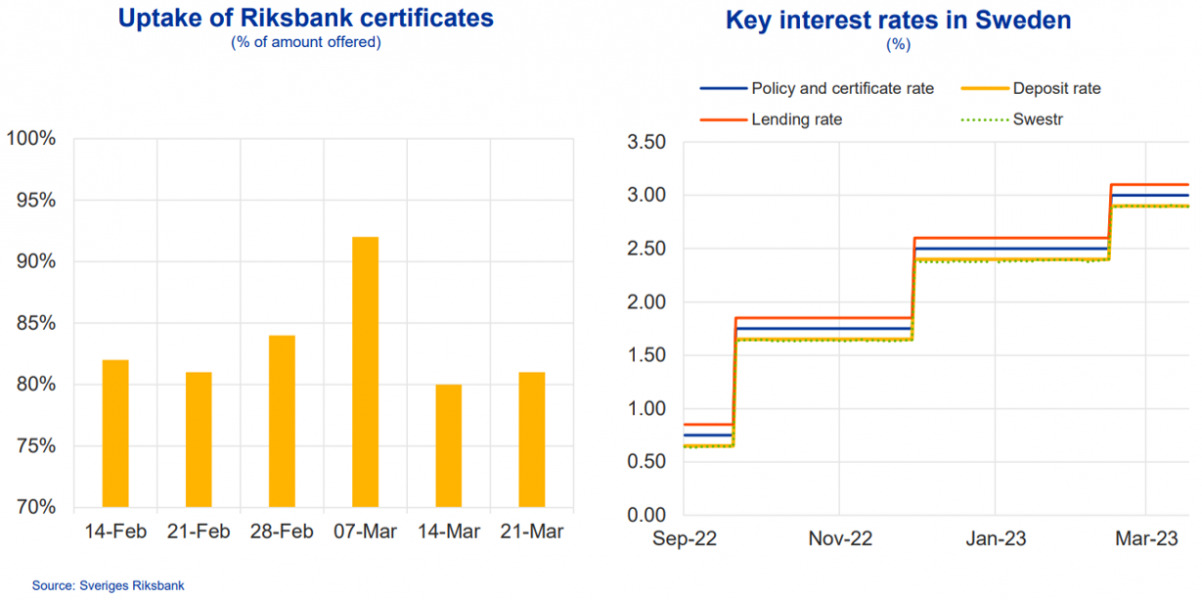
In recent weeks, it regularly issued certificates amounting to the estimated liquidity surplus of the banking system to steer the Swedish Krona short-term rate to the middle of the interest rate corridor.
However, banks often decided to hold on to about one fifth of excess reserves which they placed in the deposit facility that pays a lower rate of remuneration, so that the short-term rate remained stuck to the floor of the corridor (Figure 8).
This points to banks’ strong preference for reserves, which may affect the ability of central banks to effectively steer short-term rates in a large corridor system, such as the one we had before 2008.13
Figure 8: Swedish experience points to strong preferences by banks for holding reserves
There are two main reasons as to why banks may today wish to hold a higher level of excess reserves.
One relates to regulatory changes. The introduction of Basel III has resulted in a measurable increase in the demand for high-quality liquid assets (HQLA) that banks need to hold to comply with the liquidity coverage ratio (LCR).14
Many euro area banks currently use excess reserves to meet regulatory requirements, especially in those countries with high excess liquidity. For the euro area as a whole, excess reserves currently account for 60% of HQLA holdings (Figure 9).
The second factor relates to banks’ precautionary behaviour in guarding against liquidity risks, as the turbulent events in the past few weeks forcefully underline.
Overnight deposits at euro area banks have shown an upward trend in relation to banks’ total deposits until about mid-2022 (Figure 10, left-hand side).15 As a result, the risk of withdrawals or portfolio rebalancing has increased.
The rise in overnight deposits is in part a mechanical effect of asset purchases, which increase deposit holdings of those selling bonds to the Eurosystem. It also reflects the long period of very low interest rates that sharply reduced the opportunity costs of holding “money-like” claims.
Both of these effects can be expected to reverse as we remove monetary policy accommodation.
Figure 9: Euro area banks extensively use reserves to comply with regulatory requirements
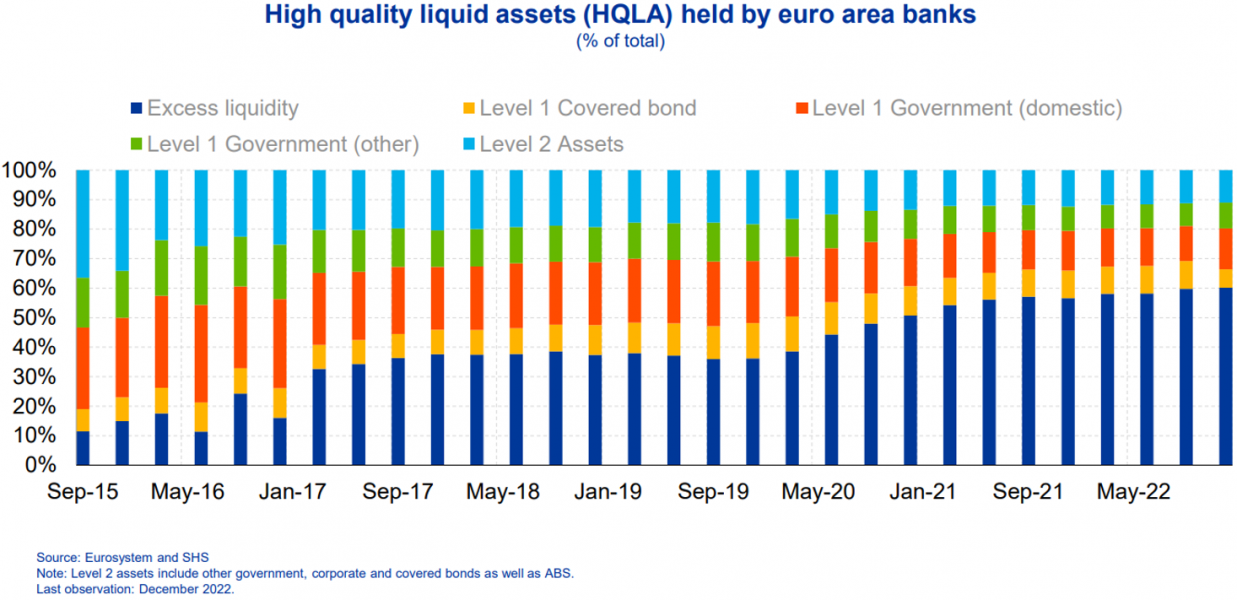
Figure 10: High share of overnight deposits may contribute to precautionary liquidity demand
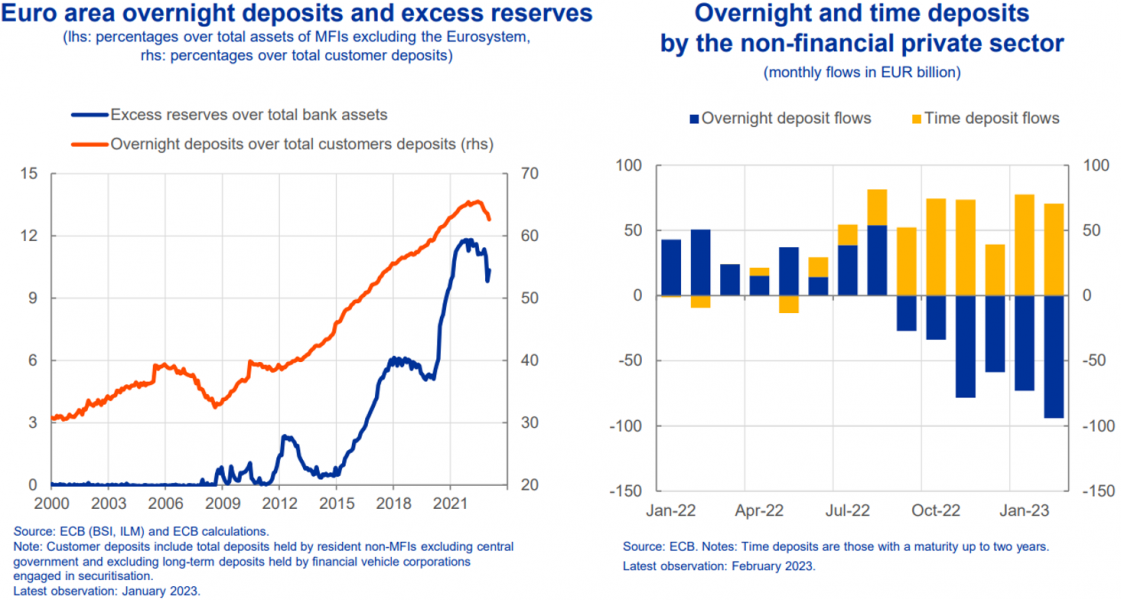
When we last increased interest rates, from 2005 until mid-2008, overnight deposits as a share of total deposits fell by about seven percentage points as firms and households shifted savings into less fungible term deposits that earn a higher rate of remuneration, a development that started only recently in the current hiking cycle (Figure 10, right-hand side).
However, even if funding became more stable again over time, banks would be likely to want to hold larger liquidity buffers to meet potential outflows.16 And they would want to hold such buffers, at least in part, in central bank reserves as these do not need to be liquidated and, unlike marketable safe and liquid assets, are not subject to valuation changes.
The current environment vividly demonstrates that such valuation changes can be a source of instability for banks and markets.
These developments do not necessarily suggest that a return to the pre-2008 corridor framework is undesirable or infeasible. After all, reserve demand may become more predictable over time and balance sheet run-down will increase the availability of marketable HQLA which banks can use to comply with their regulatory requirements.
But they do suggest that it may have become more difficult for central banks to correctly anticipate the demand for reserves and hence to steer interest rates in a wide corridor, and that such steering would entail a higher operational burden, both for the central bank and the banking system at large, with the need for more frequent fine-tuning operations.
What, then, might be the alternatives to the pre-2008 corridor framework?
The recent experience of other major central banks suggests that policymakers have two broad options: one is to formally adopt the current floor system by maintaining a sufficiently large bond portfolio on the asset side; the other is to offer, either in a floor or a narrow-corridor framework, regular collateralised lending operations that ensure that banks are able to maintain their desired level of reserve holdings as balance sheet reduction proceeds.
While both options can be expected to have a similar capacity to maintain control over overnight interest rates, they differ in their impact on the size and composition of the central bank’s balance sheet, and in their ability to deal with the idiosyncratic features of the Eurosystem.
The first option is broadly how the Federal Reserve manages its balance sheet.17
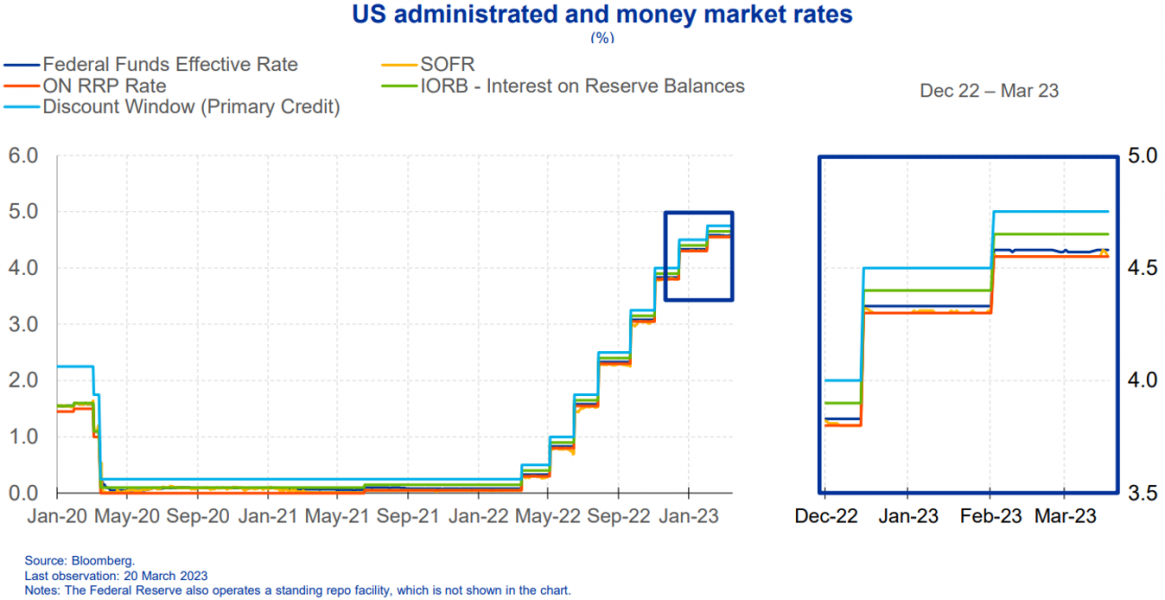
The Federal Reserve aims to keep a sufficiently large buffer of excess reserves in the system so that the effective federal funds rate – the rate at which banks and certain other institutions lend to each other – trades close to the interest rate paid on reserve balances. This is the “floor” below which banks are better off depositing with the Federal Reserve than lending in the market (Figure 11).
Figure 11: Federal Reserve operates in a floor system with ample reserves
As not all financial market participants have access to the Federal Reserve’s balance sheet, the floor might be “leaky” – that is, overnight interest rates might trade below the floor as banks charge an intermediation spread when borrowing reserves from non-banks that cannot directly store funds with the central bank.18
The bargaining power of non-banks can be increased by giving them access to the central banks’ balance sheet. This is what the Federal Reserve has achieved by establishing the overnight reverse repo facility (ON RRP) which remunerates cash held by selected non-banks at rates slightly below the one paid to banks. This facility therefore sets a second floor on money market rates, reducing their volatility.19
Operating a floor system like that of the Federal Reserve has three key benefits: first, it maintains a higher level of safe assets in the financial system; second, it is operationally simple, especially in a context where it may be hard to accurately forecast the demand for reserves; and third, it can ensure instrument robustness – that is, it can cater for large changes in the supply of reserves without diluting the interest rate signal.20
The degree of rate controllability under this framework depends, however, on a number of structural features of the economy. These features, in turn, raise trade-offs, which may be larger in the euro area than elsewhere.
One trade-off arises when central banks expand their balance sheets.
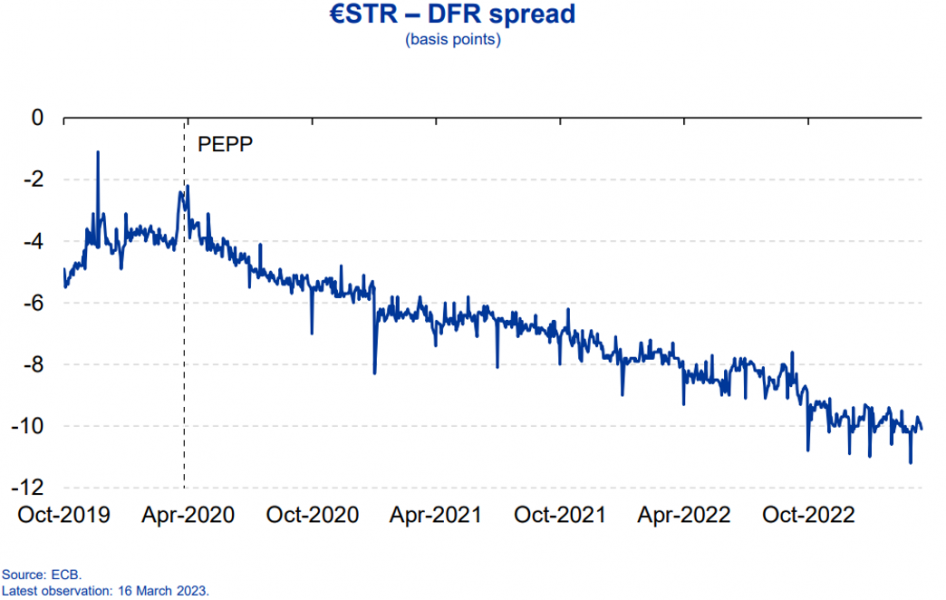
For example, the large increase in reserves in the wake of the PEPP and TLTROs has made the floor in the euro area more and more leaky, with the euro area’s benchmark interest rate, €STR, increasingly decoupling from the DFR (Figure 12).
In these circumstances, interest rate control could be improved by broadening access to the deposit facility, in ways similar to the ON RRP. Doing so could, however, affect the calculation of benchmark rates in the euro area.
An ample reserve system disintermediates the unsecured money market, so that the computation of €STR heavily relies on banks’ trading with market participants who have no access to the Eurosystem’s balance sheet.
Figure 12: Rising excess liquidity has made the floor in the euro area increasingly “leaky”
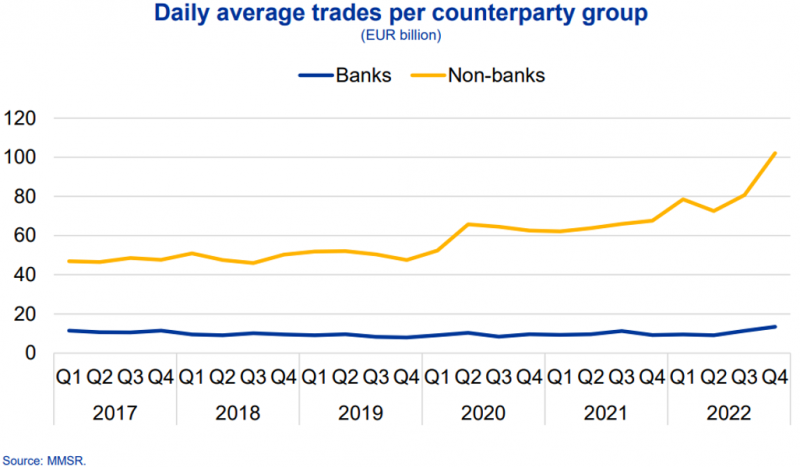
At the end of last year, for example, borrowing from non-banks accounted for nearly 90% of all unsecured money market transactions (Figure 13). We would therefore need to find ways to safeguard continued robustness of €STR, while, at the same time, avoiding destabilising shifts in funds between banks and non-banks which could occur when broadening the access to our balance sheet.
A second trade-off arises when the supply of reserves declines.
Because the distribution of excess liquidity is often highly uneven across banks, reserve scarcity in corners of the financial system might put upward pressure on interest rates even at high levels of aggregate excess reserves.
Figure 13: Rising share of non-bank transactions underlying the calculation of €STR
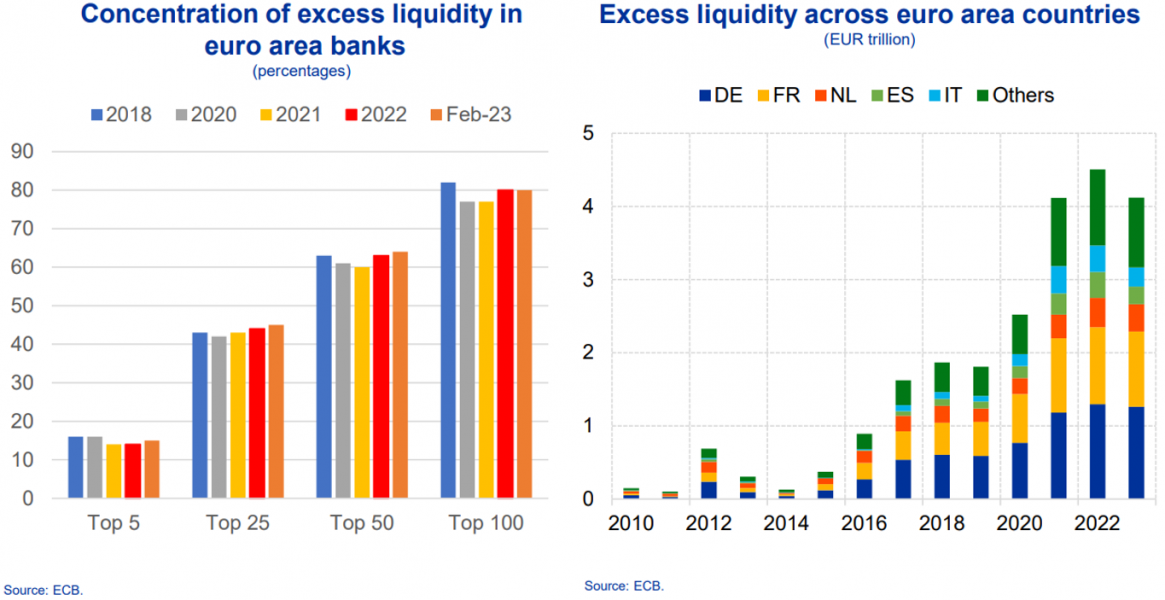
In the euro area, for example, 25 banks alone currently hold over 40% of excess liquidity, with little changes over time (Figure 14, left-hand side). Moreover, excess liquidity tends to be concentrated in countries that are financial centres (Figure 14, right-hand side).
The uneven distribution of reserves within the system, together with the large uncertainty about banks’ underlying liquidity preferences, imply that central banks may have to keep a significant buffer of excess reserves in the financial system to avoid unwarranted interest rate volatility.
Figure 14: Excess liquidity tends to be concentrated in financial centres in supply-driven system
To provide ample reserves in this framework, the central bank is required, by and large, to maintain a significant outright “structural” bond portfolio. The Fed’s approach is therefore called a “supply-driven” floor system.
It constrains the choices of the central bank as to how to provide the reserves required to effectively steer overnight rates towards the floor. An attempt to allow banks to choose their desired level of reserves, using credit operations, could risk undersupplying the system as a whole, that is leaving it without the required volume of excess reserves.
In principle, policymakers are free to choose the broad characteristics of such a structural bond portfolio. For example, central banks could adjust the asset composition according to their secondary objectives, such as alignment with the Paris Agreement.21
Moreover, the average weighted maturity could be kept short to limit the impact of the portfolio on the monetary policy stance or to reduce central banks’ exposure to duration risk.
In the euro area, however, there are two additional considerations relevant for the assessment of whether a large bond portfolio is desirable or not.
One is that the lack of a consolidated public sector balance sheet raises more fundamental concerns about monetary and fiscal interactions in a currency union with sovereign member states. These concerns may potentially undermine the credibility and independence of the central bank.
If central banks need to raise interest rates sharply to protect price stability, this implies significant risk exposures for central banks and may have implications for government budgets.22 In addition, large central bank’s sovereign bond holdings may distort the price information of underlying risks in the euro area.
Second, a large bond portfolio may affect liquidity conditions in financial markets.
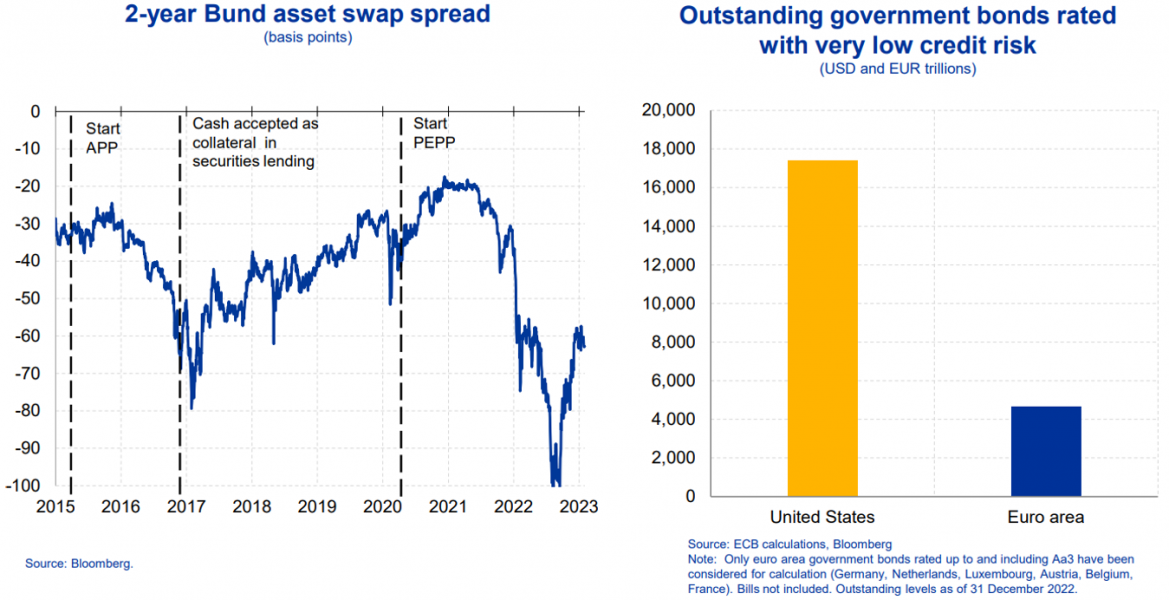
In recent years, the Eurosystem’s footprint in financial markets has contributed to a significant “scarcity premium” that market participants must pay to obtain bonds bought under our asset purchase programmes (Figure 15, left-hand side).
Such scarcity effects can put the smooth functioning of financial markets at risk, especially when the demand for safe assets increases in periods of stress. These effects tend to be larger in the euro area than in the United States, given the euro area’s substantially lower volume of outstanding highly-rated and liquid bonds (Figure 15, right-hand side).
Central banks have tools to partly alleviate such distortionary effects. The Eurosystem’s securities lending facility, for example, channels bonds bought under our purchase programmes back into the market, improving liquidity.
But the larger the portfolio, the less likely it is that liquidity conditions remain unaffected. This could risk undermining our obligation to act in accordance with the principle of an open market economy where prices and quantities are determined by competitive market forces.23
Figure 15: QE has contributed to scarcity of safe and liquid assets in repo and bond markets
The second approach has the potential to alleviate some of these trade-offs by allowing banks themselves to determine the amount of liquidity they want to hold.
This is broadly the approach the Bank of England first announced in 2019 and implemented in 2022.24
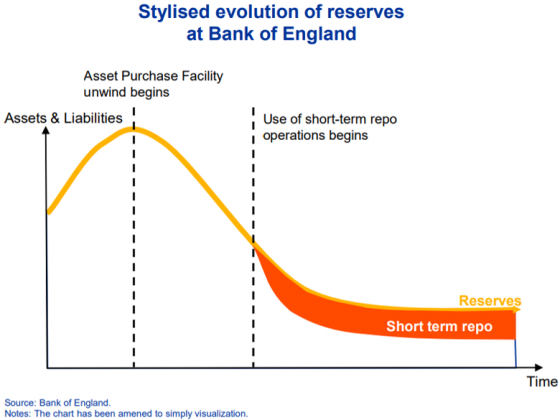
Under this approach, the central bank offers regular collateralised lending operations to ensure that any shortfall in banks’ demand for reserves is replenished as quantitative tightening proceeds (Figure 16). That is why the Bank of England’s approach is referred to as a “demand-driven” floor system.
The Bank of England currently offers reserves through short-term repo operations at the same rate that it pays to banks depositing reserves. Using the same rate for providing and remunerating reserves ensures that money market rates will trade closely to the policy rate at every level of excess reserves.
By its nature, such a system shares some of the benefits and costs of a supply-driven framework.
While it is operationally simple and robust to large changes in reserves, it may in some market structures also be prone to a leaky floor when excess reserves expand measurably in response to asset purchases or long-term credit operations.25
Figure 16: In demand-driven system banks can replenish reserves via borrowing as QT proceeds
In addition, a demand-driven framework has two specific characteristics.
One is that its success in steering interest rates critically depends on banks’ willingness to regularly tap the lending operations as and when they begin to experience shortfalls relative to their reserves demand. Stigma may prevent banks from borrowing the amount needed to stabilise interest rates at the intended level.
In the United Kingdom, this risk has been tackled in three ways: first, through non-penal pricing; second, by communicating clearly that this is a business-as-usual monetary policy operation; and third, through a clear statement from the Prudential Regulation Authority that it would judge usage of the facility to be routine participation in money markets.
A second characteristic is a potential “coordination” problem: individually, banks may have incentives to be economical in their borrowing of reserves, which could expose them to unexpected liquidity shocks in-between liquidity providing operations.
So, in the absence of an efficient interbank market, there must be alternative facilities for banks to source liquidity at short notice should they need it. The Bank of England offers a range of liquidity facilities which allow firms to access reliable supplies of liquidity at a predictable cost.
Provided these issues can be resolved, the Bank of England’s approach has a number of benefits that may be particularly relevant for a large and heterogeneous currency area like the euro area.
One is that it may provide better insurance against potential fragmentation shocks.
Under a demand-driven framework, the distribution of reserves would be expected to be more even than in a supply-driven floor system, where excess reserves are often very concentrated (Figure 14). A more balanced reserve distribution could strengthen the resilience of the currency union.
A second benefit of a demand-driven framework is that it offers more flexibility on how the central bank provides reserves: because only the marginal unit of reserves to the banking system must be supplied via credit operations, the central bank may still choose to hold an outright bond portfolio, for example to satisfy the economy’s structural liquidity needs.
This portfolio could be appreciably smaller than what may be required to steer interest rates in a supply-driven framework. It could nevertheless be useful in reducing the operational burden and in avoiding encumbering large volumes of collateral.26
A third benefit is that the Bank of England’s approach may potentially lead to a leaner balance sheet depending on banks’ demand for reserves, which will depend, among other things, on two factors.
One is central banks’ collateral framework: all else being equal, the easier it is for counterparties to turn non-HQLA into highly liquid reserves, the larger the central bank’s balance sheet will be.
The other factor is the relative return on reserves. For a long time, reserves in the euro area have been an attractive option for complying with HQLA requirements. They persistently generated higher returns than safe and liquid bonds (Figure 17).
Figure 17: Recently marketable HQLA was often more profitable to hold than reserves
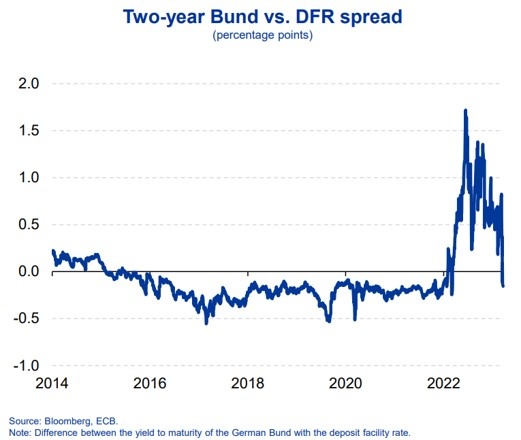
The rise in policy rates has made the relative returns on reserves much more volatile. In recent months, it was often more profitable for banks to hold marketable HQLA. This was also typically the norm when excess reserves were scarce.
A final and important benefit of a demand-driven framework is that it allows the central bank to gradually learn about banks’ underlying liquidity preferences.
This offers some flexibility for adjustment in the future. For example, although the Bank of England currently operates a floor framework, this is not a necessary feature for the success of a demand-driven system.
Sveriges Riksbank, for example, operates in a narrow corridor system where the lending rate and the deposit facility rate are set at a spread of 10 basis points above and below the policy rate. This spread was chosen to encourage counterparties to find market solutions for their funding needs rather than making recourse to the central bank.27
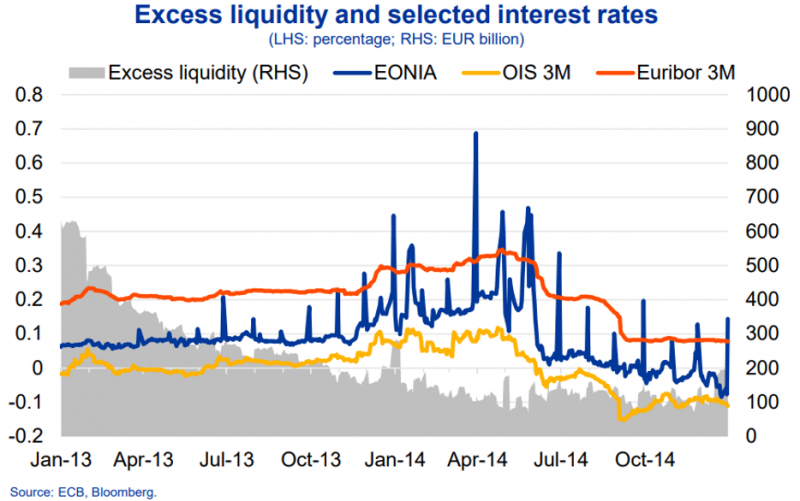
If the corridor is sufficiently narrow, the implied rate volatility from fluctuations in aggregate excess reserves may not be a first-order concern. Indeed, the experience of the Eurosystem in 2014, when excess liquidity was declining, suggests that even relatively large fluctuations in overnight rates might not affect broader policy transmission (Figure 18).
Figure 18: Volatility of overnight rates may not affect broader monetary policy transmission
To conclude, in this note I have highlighted that the decision which policy implementation framework the ECB should choose for the future involves many complex issues. Ultimately, our obligation to act in line with the principle of an open market economy implies that, in the steady state, the size of our balance sheet should only be as large as necessary to ensure sufficient liquidity provision and effectively steer short-term interest rates towards levels that are consistent with price stability over the medium term.
I would like to thank staff from the ECB’s Directorate General Market Operations for their contributions to this note. For the rationale and market impact of quantitative tightening, see Schnabel, I. (2023), “Quantitative tightening: rationale and market impact”, speech at the Money Market Contact Group meeting, Frankfurt am Main, 2 March.
Before 2021, the ECB defined price stability as Harmonised Index of Consumer Prices (HICP) inflation being below, but close to 2% in the medium term. As part of our strategy review in 2021, the Governing Council decided that price stability is best maintained by aiming for 2% inflation over the medium term.
See Schnabel, I. (2020), “The ECB’s response to the COVID-19 pandemic”, remarks at a 24-Hour Global Webinar co-organised by the SAFE Policy Center on “The COVID-19 Crisis and Its Aftermath: Corporate Governance Implications and Policy Challenges”, Frankfurt am Main, 16 April; and Schnabel, I. (2020), Quantitative tightening: rationale and market impact The ECB’s response to the COVID-19 pandemic “The ECB’s monetary policy during the coronavirus crisis – necessary, suitable and proportionate”, speech at the Petersberger Sommerdialog, 27 June.
Full reinvestment under the PEPP is currently expected to continue until the end of 2024.
The future path of our APP and PEPP holdings reflect the results of our survey of monetary analysts (SMA).
Autonomous factors also include net foreign assets and a miscellaneous category that includes items in the course of settlement (net float).
The Eurosystem recently took measures that provide incentives for a gradual and orderly reduction of government deposits.
The introduction of a central bank digital currency could have implications for the size of the balance sheet. See, for example, Armas, A. and Singh, M. (2022), “Digital Money and Central Banks Balance Sheet”, IMF Working Paper, No 206.
The corridor consisted of a marginal lending facility which provided a daily backstop for banks facing unanticipated liquidity shocks and a deposit facility rate. In 2003, the Governing Council decided to reduce the maturity of the MROs from two weeks to one week and to adjust the timing of the reserve maintenance period. See ECB (2003), “Measures to improve the efficiency of the operational framework for monetary policy”, 23 January.
Anbil et al., (2020), “What Happened in Money Markets in September 2019?”, FEDS Notes, 27 February; and Federal Reserve System (2019), August 2019 Senior Financial Officer Survey.
Banks were required to fulfil their reserve requirements on average during the maintenance period. This reduced the need for recourse to the standing facilities during the maintenance period. However, by design the facilities were systematically and intensely used on the last day of each maintenance period if there was an aggregate shortage or excess of reserves.
See Kim, K., Martin, A. and Nosal, E. (2020), “Can the U.S. Interbank Market Be Revived?”, Journal of Money, Credit and Banking, Vol. 52(7), pp. 1645-89; and Afonso, G., Armenter, R. and Lester, B. (2019), “A Model of the Federal Funds Market: Yesterday, Today, and Tomorrow”, Review of Economic Dynamics, Vol. 33, pp. 177-204. For a long time, an efficient interbank market was associated with hopes of increased financial stability through counterparty monitoring (see, for example, Rochet, J-C. and Tirole, J. (1996), “Interbank Lending and Systemic Risk”, Journal of Money, Credit and Banking, Vol. 28(4), Part 2: Payment Systems Research and Public Policy Risk, Efficiency, and Innovation, pp. 733-762). However, the global financial crisis may have permanently extinguished these hopes, probably because banks do not have strong incentives to monitor the solvency of their counterparties when most borrowing activity takes place overnight.
Before 2008, the width of the corridor in the Eurosystem was two percentage points.
Changes in over-the-counter (OTC) derivatives regulations, leading to requirements for central clearing, and margin requirements for uncleared derivatives, have also driven increased demand for HQLA.
See also Acharya, V.V. et al. (2022), “Liquidity Dependence: Why Shrinking Central Bank Balance Sheets is an Uphill Task”, paper presented at the Federal Reserve Bank of Kansas City’s Jackson Hole Economic Symposium, August.
For the role of deposits in reserve demand, see Lopez-Salido, D. and Vissing-Jorgensen. A. (2023), “Reserve Demand, Interest Rate Control, and Quantitative Tightening”, mimeo.
See Board of Governors of the Federal Reserve System (2019), “Statement Regarding Monetary Policy Implementation and Balance Sheet Normalization”, 30 January; and Zobel, P. (2022), “The Ample Reserves Framework and Balance Sheet Reduction: Perspective from the Open Market Desk”, remarks at the Cato Institute’s 40th Annual Monetary Conference, 8 September.
This spread compensates banks for the overhead and balance sheet costs of liquidity storage services but may also include an excess spread reflecting the pricing power that banks enjoy because of their exclusive access to the central bank balance sheet.
The Federal Reserve also has liquidity backstop facilities – the discount window facility and the Standing Repo Facility – which are priced above the market rate to prevent sudden rate spikes arising from demand-supply mismatches for which the chosen buffer may prove to be insufficient.
For the role of reserves in contributing to financial stability, see Greenwood et al. (2016), “The Federal Reserve’s Balance Sheet as a Financial-Stability Tool”, prepared for the Federal Reserve Bank of Kansas City’s 2016 Economic Policy Symposium, Jackson Hole.
Schnabel, I. (2023), “Monetary policy tightening and the green transition”, speech at the International Symposium on Central Bank Independence, Sveriges Riksbank, Stockholm, 10 January.
See, for example, Cavallo, M. et al. (2019), “Fiscal Implications of the Federal Reserve’s Balance Sheet Normalization”, International Journal of Central Banking, Issue 61, pp. 255-306.
See Article 119(2) and Article 127(1) of the Treaty on the Functioning of the European Union (TFEU).
Hauser, A. (2019), “Waiting for the exit: QT and the Bank of England’s long-term balance sheet”, speech at the European Bank for Reconstruction and Development, London, 17 July; and Bank of England (2022), Short Term Repo Facility – Provisional Market Notice, 4 August.