We administer a newly-designed survey to a large panel of retail investors who have substantial wealth invested in financial markets. The survey elicits beliefs that are crucial for macroeconomics and finance, and matches respondents with administrative data on their portfolio composition and their trading activity. We establish five facts in this data: (1) Beliefs are reflected in portfolio allocations. The sensitivity of portfolios to beliefs is small on average, but varies significantly with investor wealth, attention, trading frequency, and confidence. (2) It is hard to predict when investors trade, but conditional on trading, belief changes affect both the direction and the magnitude of trades. (3) Beliefs are mostly characterized by large and persistent individual heterogeneity; demographic characteristics explain only a small part of why some individuals are optimistic and some are pessimistic. (4) Investors who expect higher cash flow growth also expect higher returns and lower long-term price-dividend ratios. (5) Expected returns and the subjective probability of rare disasters are negatively related, both within and across investors. These five facts challenge the rational expectation framework for macro-finance, and provide important guidance for the design of behavioral models.
Beliefs about the future play a central role in determining economic decisions. For example, when central bankers set interest rates, these decisions are informed by the central bankers’ beliefs about the future path of inflation and the economy more broadly. Similarly, when investors decide on how to invest their savings, beliefs about future stock market returns and the economy should centrally influence their allocations.
While beliefs play a central role in portfolio allocations both in rational expectations models and in behavioral macro-finance models, little evidence exists on the extent to which investors’ decisions actually reflect their beliefs.
One of the difficulties in studying investor beliefs is that they are generally hard to measure. To overcome this challenge, researchers are increasingly turning to survey data to calibrate and test macro-finance models. The unique benefit of survey data is that it can provide direct evidence on the beliefs of different agents about future economic outcomes such as returns and cash flows. While surveys have well-known downsides (for example, they are affected by measurement error), they open a new window into the investors’ minds.
However, knowing investors’ beliefs alone is not enough to characterize the extent to which investors act on those beliefs. Indeed, to fully understand the transmission of investor beliefs to actions such as their trading and portfolio allocations, it is necessary to link the individual surveys to the actions of the survey respondents.
We explore the quantitative relationship between beliefs and behavior in a recent paper, Five Facts About Beliefs and Portfolios. To overcome the measurement challenges described above, we administer a newly-designed online expectations survey to a large panel of individual retail and pension investors with substantial wealth invested in financial markets. We then link the surveys to anonymized administrative data on their investment holdings and trading.
More specifically, the survey elicits the investors” beliefs about future stock returns, GDP growth, and bond returns. We ask about investors’ expectations at different horizons (e.g., 1 year and 10 year), and the perceived probabilities of different outcomes (e.g., a 10% or 30% drop in the stock market over the coming year). The survey is administered to a random sample of U.S.-based clients of Vanguard, one of the world”s largest asset management firms. The survey, which is still ongoing, started in February 2017 and is administered every two months. In the first ten waves (on which this note focuses on), we received a total of 20,207 responses. About 35% of the responses came from investors who responded to only one survey. Over 25% percent of respondents participated in at least four survey waves. These multiple respondents provide our survey with a substantial panel component.
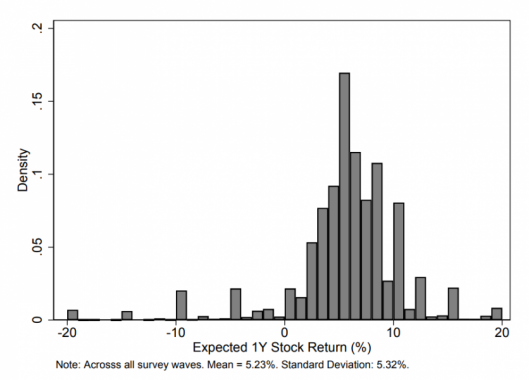
Figure 1 shows the histogram of responses for the one-year expected stock market return across all responses to the survey. The average expected one-year return was 5.23%, with substantial heterogeneity among respondents: the expected return is 0.5% at the 10th percentile and 10% at the 90th percentile.
Figure 1 – Distribution of Expected 1-Year Stock Returns
We organize our results about beliefs and portfolios around 5 facts.
We begin by studying the relationship between the equity allocation in investors’ portfolios and the same investors’ beliefs about one-year expected stock returns. Figure 2 shows a conditional binscatter plot with portfolio equity share on the vertical axis, and expected return on the horizontal axis.
Figure 2 – Expected 1-Year Stock Returns and Equity Share
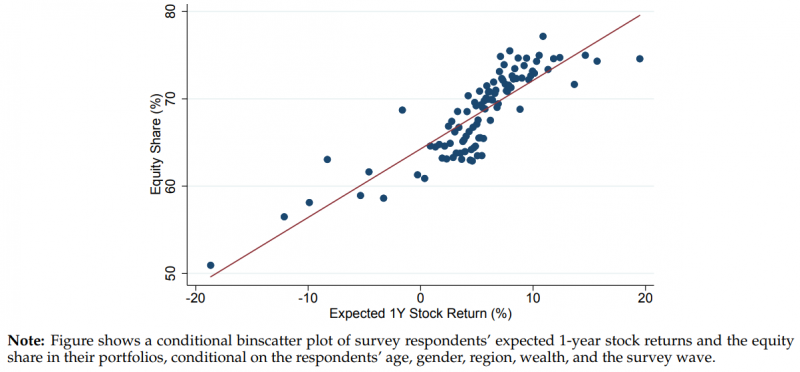
Figure 2 shows a strong positive relation between beliefs and portfolios. This directly supports the use of survey evidence in economic analysis: investors clearly behave in a way that is consistent with what they express in the surveys, at least qualitatively.
The figure also shows that the sensitivity of portfolios to beliefs is low on average across individuals. Intuitively, compare investors who expect around 0% return over the next year to investors who expect 10% return over the next year. Frictionless investment models would imply vastly different portfolios for these investors. Instead, they hold on average portfolios with 65% and 72% in equity, respectively. In other words, investors expecting a 1 percentage point increase in returns over the next year have portfolio equity holdings that are only about 0.7 percentage points higher.
While the average sensitivity of portfolios to beliefs is lower than that in frictionless models, there is substantial heterogeneity in that sensitivity across investors. Interestingly, this sensitivity lines up with different frictions investors face. Investors who pay more attention to their accounts, investors who trade more frequently, and investors who are more confident in their beliefs, all have portfolios that are more strongly aligned with their expected stock returns. Holdings in portfolios in tax-advantaged accounts are more sensitive to investors’ expectations than holdings in portfolios subject to capital gains taxes. Portfolios in institutionally managed defined-contribution plans are about half as sensitive to changes in expectations as portfolios in individually managed plans. Indeed, when we focus on a subset of investors who face only few frictions, we find their portfolio allocations to align with their beliefs in a way that is quantitatively much more similar to the predictions from frictionless models. This suggests that the fact that, on average, survey responses and portfolio allocations do not vary as much as predicted by frictionless models is not a problem to do with survey data. Instead, it highlights that in order for models to have reliable quantitative implications, they need to better account for the large and heterogeneous frictions across investors.
We summarize this fact as follows:
Fact 1. Portfolio shares vary systematically with individuals’ beliefs. However, the average sensitivity of an investor’s portfolio share in equity to that investor’s expected stock market returns is lower than predicted by frictionless asset pricing models. This sensitivity is higher in tax-advantaged accounts, and is increasing in wealth, investor trading frequency, investor attention, and investor confidence.
By studying investor’s detailed trading activity, we can obtain further insights into the low measured sensitivity of portfolios to beliefs highlighted in Fact 1. The low sensitivity can be decomposed in two channels: an extensive margin channel (investors do not trade when they change their beliefs), and an intensive margin channel (investors trade, but quantitatively too weakly, when they change their beliefs).
For every investor, we identify the time windows between each pair of consecutive survey responses. For each window, we compute the total trading activity, the beliefs at the beginning of the window, and the change in beliefs during the window. We then study whether the change in beliefs during a window predicts whether investors trade during that window, and if so, whether it affects by how much they trade. Our empirical results show that much of the low sensitivity we documented in Fact 1 is due to the extensive margin: very often investors change their beliefs but do not trade to adjust their portfolios.
We summarize this finding in Fact 2:
Fact 2. While belief changes have little to no explanatory power for predicting when trading occurs (extensive margin of trading), they explain both the direction and magnitude of trading conditional on a trade occurring (intensive margin of trading).
Next, we focus on investigating the belief heterogeneity in our survey. To do so, we start from a simple but insightful decomposition of the variation in beliefs across individuals and over time.
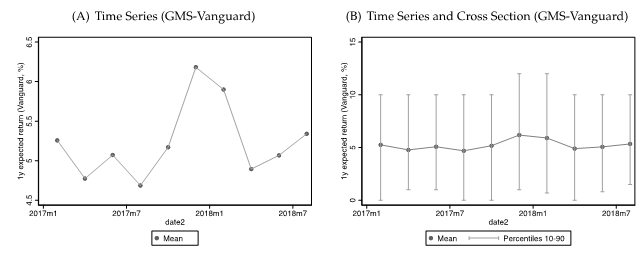
To motivate this variance decomposition, we first explore a graphical representation of the time-series and cross-sectional variation in our data. Panel A of Figure 3 shows the time-series of average 1-year expected return for the first ten waves of our survey. Average beliefs clearly display meaningful time-series variation, with a maximum increase of almost 2 percentage points and a subsequent decrease of similar magnitude. Panel B of Figure 3 shows the same time series of average expected returns as in Panel A, but also includes the 10th and 90th percentiles of the cross-sectional distribution of answers in each wave. The cross-sectional variation in expected returns swamps the observed time-series variation.
Figure 3 – Average and dispersion of beliefs over time
More formally, we can use our panel of responses to perform a statistical decomposition of the variance of beliefs into three components: fixed individual characteristics, common variation in individual beliefs over time, and a residual component that captures both idiosyncratic individual time variation and measurement error.
We find that time fixed effects (capturing time variation in the average belief) only explain around 1% of the total variation. Instead, individual fixed effects explain around 50 to 60% of the total variation. This means that individual beliefs are mostly characterized by heterogenous and persistent individual fixed effects: pessimists tend to remain pessimistic over time; optimists tend to remain optimistic; and the difference in their views is large.
We also investigate what individual characteristics might explain the individual fixed effects. In other words, we explore whether we can find any variable that can predict who is an optimist and who is a pessimist. As it turns out, this is extremely hard to do: the individual characteristics that we observe (e.g., age, wealth, gender, and confidence) explain only a small fraction of the persistent individual heterogeneity in beliefs.
We summarize our results in Fact 3:
Fact 3. Variation in individual beliefs is mostly characterized by heterogeneous individual fixed effects: between 50% and 60% of variation across responses is due to individual fixed effects and only 1% is due to common time series variation. The remaining variation is accounted for by idiosyncratic individual variation over time and measurement error. Only a small part of the persistent heterogeneity in individual beliefs is explained by observable demographic characteristics.
We next study how correlated the answers are across different questions.
Figure 4 – Covariation Across Questions
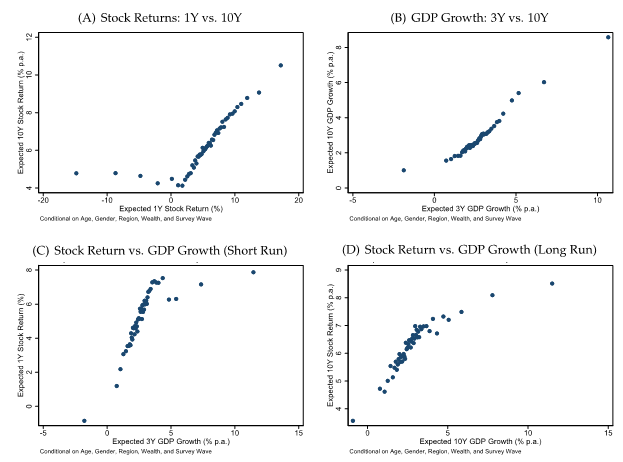
Figure 4 shows binscatter plots of the relationships between different pairs of questions. Panel A shows that expectations about short-run (1 year) and long-run (10-year) stock returns are positively correlated, with an unconditional correlation coefficient of 0.32. Interestingly, even those respondents who expect negative returns over the next year expect average long-term returns to be positive. Similarly, short-term and long-term dividend growth are positively correlated, with an unconditional correlation coefficient of 0.69 (Panel B).
Panels C and D relate questions about expected returns and questions about GDP growth (at short horizons in Panel C, and at long horizons in Panel D). The two panels show that expectations of stock market returns and economic growth are positively correlated at all horizons.
We conclude that individuals that expect higher economic growth also expect higher stock returns. This means that disagreement across investors about each object cannot be taken in isolation, since disagreement about each object is related to disagreement about the others.
We summarize this as Fact 4:
Fact 4. Individuals who expect higher cash flows also expect higher returns.
An important strand of the macro-finance literature has emphasized that expectations of rare but potentially catastrophic negative events, called rare disasters, can help explain portfolio holdings and asset prices. This literature has stressed that the expected probability and size of rare disasters are some of the most important moments for understanding risks and returns.
Our survey asks directly about the probability of extreme negative events, such as the probability that the stock market would drop by 30% or more in the coming year, and the probability of an annualized GDP growth below -3% for the next three years.
Figure 5 – Rare Disasters
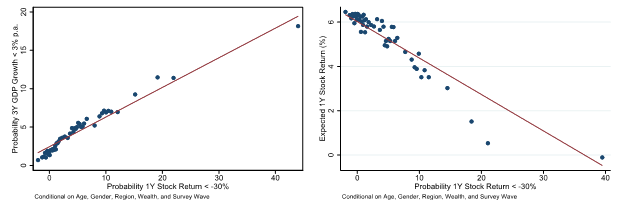
Our main findings are summarized in Figure 5. The left panel of the Figure plots the probability of a stock market disaster (<-30% return in a year) against the probability of a GDP growth disaster (<-3% per year for 3 years). We find that beliefs about the two types of disasters are positively related at the individual level (the slope of the regression line is 0.38). This result suggests that expectations of rare stock market disasters come with expectations of lower cash flows, as implied by standard macro-finance models.
The right panel of the Figure, which plots expected 1-year returns against the disaster probability for the stock market, shows that individuals who report a higher subjective probability of stock-market rare disasters also report lower expected stock-market returns. This result is surprising in light of the existing literature, because in standard representative agent rational-expectation equilibrium models with rare disasters, expected returns and the probability of disasters are positively related. The intuition is that a higher probability of disaster induces individuals to demand a higher compensation for holding the stock market and this makes equilibrium expected returns higher.
Our results here suggest possible avenues to extend our model to capture the investors’ perceptions of rare disasters that appear from the surveys. For example, these results suggest that there is significant disagreement across investors about the disaster probability. Since the current stock price is observed by all agents, then those agents who think that disasters are more likely also tend to expect lower returns, thus generating the pattern we see in the Figure.
We summarize these results in our last fact:
Fact 5. Higher expectations of stock market disasters are associated with lower expected stock market returns, both across and within individuals.
We designed, administered and analyzed a new survey of investor beliefs, combined with administrative data on their portfolio holdings and trading behavior. We established five facts about the relationship between investor beliefs and portfolios. These facts shed new light on the mechanisms that link investor beliefs to their actions, and we hope they will guide the development of macro-finance models that can help us better understand financial markets.
Giglio, S., Maggiori, M., Stroebel, J., & Utkus, S. (2019). Five facts about beliefs and portfolios (No. w25744). National Bureau of Economic Research.