Asymmetric effects across sectors are the distinctive features of the Covid-19 shock. Business Formation Statistics in the United States show a reallocation of entry opportunities across sectors in the initial phase of the pandemic. To explain these facts, in Ascari, Colciago and Silvestrini (2021) we propose an Epidemiological Industry Dynamics model with heterogeneous firms and endogenous firms dynamics.1
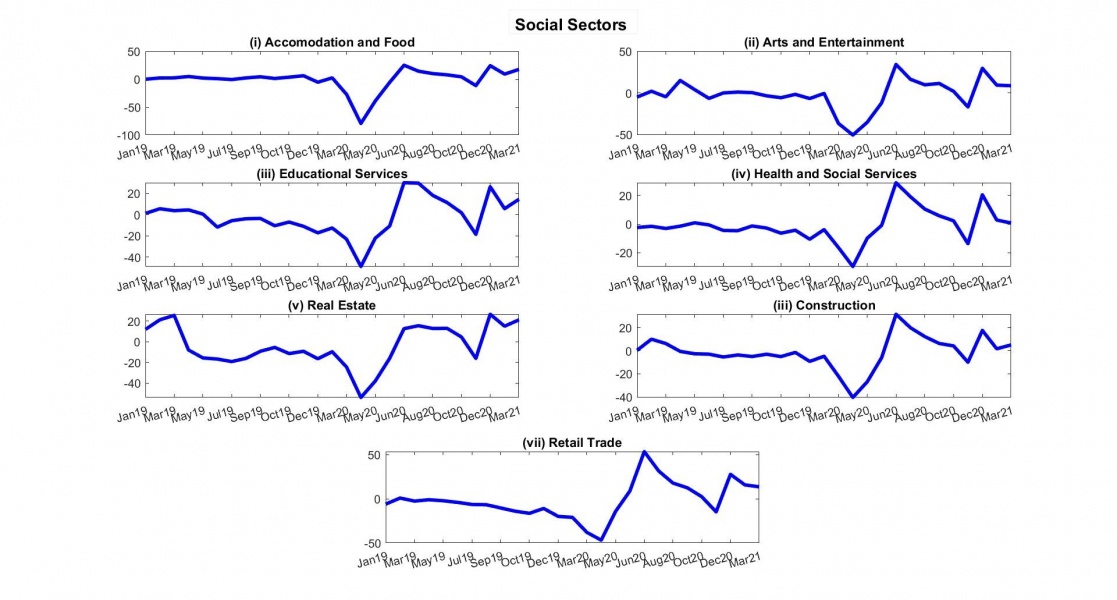
Figure 1 and 2 plot percentage deviations with respect to trend in the number of US business applications with intended wages, i.e. potential new firms that intend to pay wages upon starting their operations.2 Figure 1 refers to social sectors, that is sectors characterized by a high degree of social interaction among customers, workers, or both. Figure 2 refers to non-social sectors.3
Two facts emerge from a visual observation of the Figures:
(1) in the early phase of the crisis, that is March-April 2020, there was a drop, with respect to trend, in business applications in social sectors, followed by a slight rebound in the summer of the same year;
(2) after a mild impact response, a surge in business applications in the non-social sectors can be observed in the same early phase of the crisis
Figure 1. Business Applications in Social Sectors. Percentage deviations from trend.
The effect of the pandemic on business dynamism could affect productivity through at least three channels: cleansing, reallocation, and production networks.
First, the pandemic shock could actually improve sectoral productivity via a standard cleansing effect during recessions, namely by inducing exit of the less productive businesses. Second, reallocation of activity from social towards non-social sectors affects the relative number of firms in those sectors through entry and exit with an, a priori, unclear effect on aggregate productivity. Thus, business dynamism determines a composition effect, within and between sectors, that is important in shaping the dynamics of sectoral and aggregate productivity. Finally, sectoral spillovers and production network could act as an important amplification mechanism of the previous effects.
To capture the effects of the pandemic on business dynamism, we build an Epidemiological-Industry Dynamic model with the following features:
Figure 2. Business Applications in Non-Social Sectors. Percentage deviations from trend.
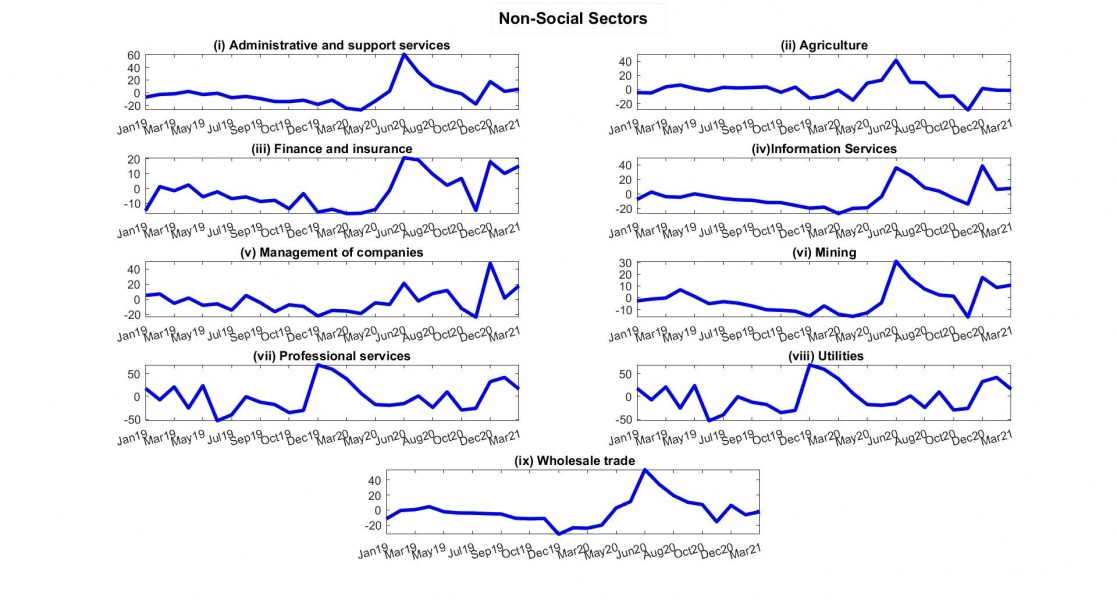
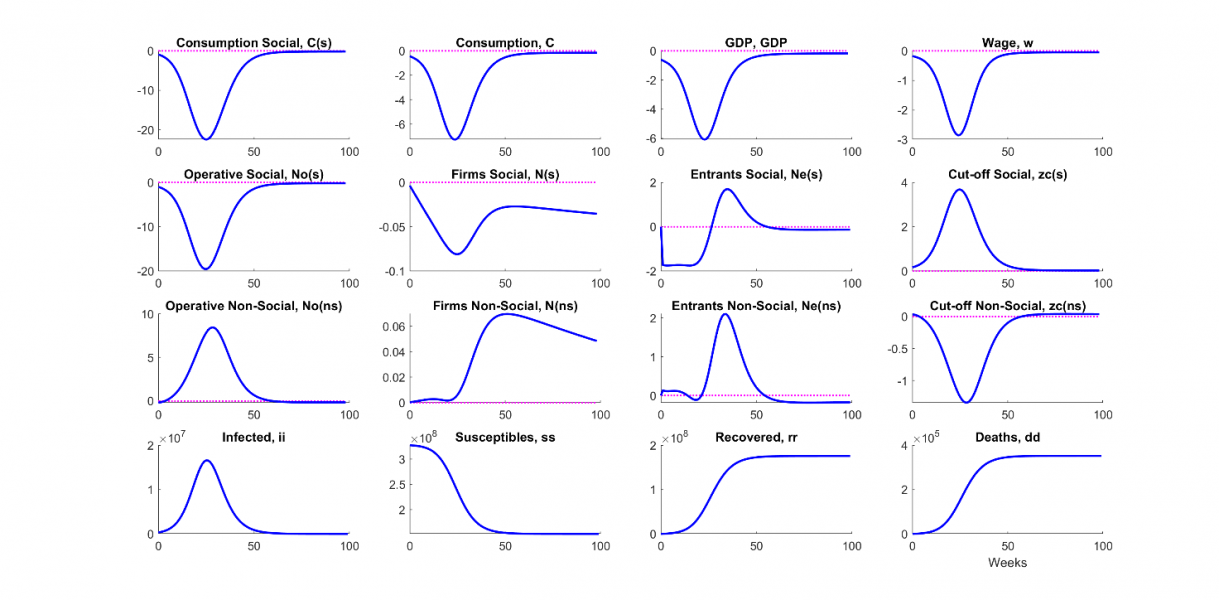
Figure 3 depicts the response of the main variables of our model to the COVID-19 shock. We assume that on impact 1/1000 of the population contracts the infection. Variables are expressed in percentage deviations from the long run and time on the horizontal axes is in weeks. Notice that operative firms are those which are actively producing in a given time period, while cut-off variables indicate the minimum level of productivity required to a firm to be operative in a given sector.
In response to the shock our model economy features:
Economic Intuition: due to the drop in revenues, break even in social sectors requires higher idiosyncratic productivity. This affects both the entry and exit margins. Indeed, only firms with higher productivity will find convenient to enter in the social sector, resulting in a drop in the number of potential entrants. Turning to the exit margin, there is cleansing of low-productivity firms, which become temporary idle, causing an increase in the effective exit rate and in average sectoral productivity. Opposite reasoning leads to a temporary lower productivity in non-social sectors.
Figure 3. Impulse response function to the Pandemic shock.
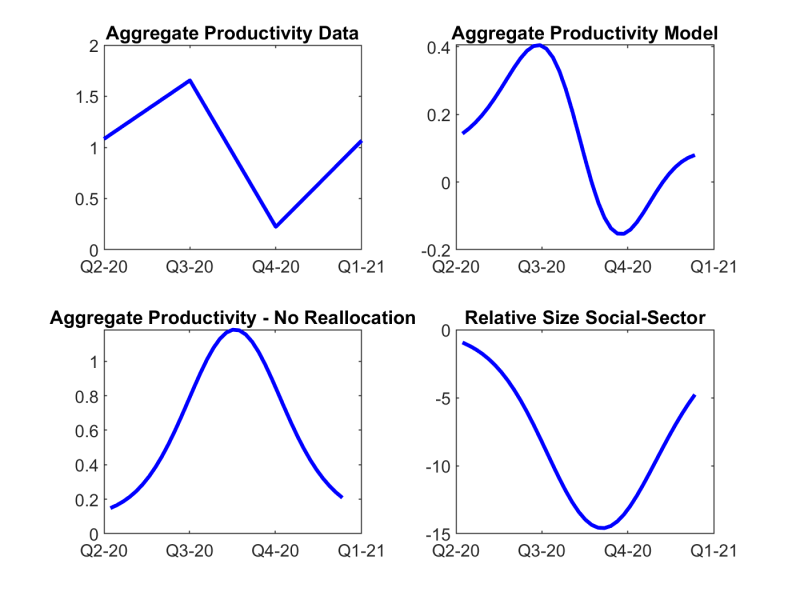
The top left panel of Figure 4 displays the empirical series of aggregate labor productivity, measured as output per hour. Data are from 2020Q2 to 2021Q1. Labor productivity increased up to summer/fall of 2020, to drop sharply afterwards, and to start growing again at the beginning of 2021. The top right panel shows that our model delivers a sinusoidal-shaped series that mirrors closely that in the data, at least from a qualitative standpoint. The reason for this relative success is that our model accounts for both sector-specific cleansing in the social sector, and for the reallocation of demand across sectors that characterized the pandemic. To see this, consider the two bottom panels of the figure. The bottom left panel plots again labor productivity, but shutting down the reallocation channel. The bottom right panel, instead, plots the change of the relative weight of the social sector in response to the pandemic shock.
A joint reading of two lower panels suggests that the response of aggregate productivity to the pandemic shock is the result of two driving forces. The first one results from the change in the sectoral average productivity in the two sectors. The second force is a composition effect due to the reallocation of demand across sectors, that alters their relative size. The interaction between these two forces determines the overall productivity dynamics.
Figure 4. Aggregate labor productivity in the model and in the data, and its decomposition.
Monetary policy and nominal wage stickiness are key ingredients to explain the reallocation processes in the early phase of the pandemic. When wages are flexible, the model cannot reproduce the reallocation of entry opportunities across sectors that characterize US data in response to the Pandemic shock. Indeed, few periods after the shock, entry diminishes sharply in both sectors.
While powerless in the flexible wage case, in presence of nominal rigidities monetary policy affects the real interest rate. Specifically, in our benchmark case, the monetary response is such that the real rate decreases persistently. This supports consumption during the crisis, leading to a milder recession with respect to the flexible wages scenario. Due to fear of contagion, consumption flows to the non-social sector because consuming in the social sectors can cause contagion with high probability. Hence, by sustaining aggregate demand through a blunt – and not tailored – instrument as the real interest rate, monetary policy induces a larger reallocation between the two sectors.
The Social Distancing (SD, henceforth) measures implemented by various government around the globe were aimed at reducing the diffusion of the disease along the three possible contagion channels that we consider: consumption, work, and random encounters between susceptible and infected agents.
Independently of the duration for which they are in place, SD measures dampen the peak of the recession on consumption, output, and other macroeconomic variables with respect to our benchmark no-SD scenario. Nevertheless, they extend the duration of the recession, and the more so, the longer their duration of such measures. The reason is that SD smooths out the reallocation process across sectors with respect to the benchmark case.
Turning to epidemiological effects, containment measures are effective at diminishing the number of infected people, but their effects on the number of dead individuals depend on their duration. Specifically, when measures are imposed for half a year the effects are simply delayed and there are minor effects on the number of deaths. In the case of a more extended SD policy, where measures are imposed for a year, we observe a substantial reduction in the loss of lives. Lifting containment measures after a year, however, leads to a second wave of infection as suggested by the dynamics of the number of infected.
Business Dynamism, Reallocation, and Productivity in a Pandemic, Andrea Colciago, Guido Ascari and Riccardo Silvestrini, September 2021, DNB WP 725.
Observations have a monthly frequency and come from the Business Formation Statistics (BFS).
The classification of sectors in social and non-social follows that suggested by the WEO (2020) of the IMF.