This Policy Note is based on “Carbon borders on both sides of the channel: Implications of the UK and EU carbon tariffs”, RaboResearch, 2024.
Following the launch of the EU CBAM, the UK announced plans to implement their own CBAM. We analyze the potential impacts of separate EU-UK carbon pricing policies on the competitiveness of relevant CBAM industries. Recent carbon-intensity data for CBAM products indicate that the average EU producer is less carbon-intensive in the production of aluminum, cement, iron, and steel, than the average UK producer. This gives EU producers a carbon cost advantage in their own market when protected by the CBAM. However, under separate carbon-pricing systems and CBAM policies, this advantage can be offset in the UK market if the EU carbon price is 3% to 9% higher than the UK ETS price. This shows, that the CBAMs in their current design protect against carbon leakage in the respective domestic markets, but the divergence in carbon price policies between the two jurisdictions can, in specific cases, distort the carbon competition. Overall, aligning carbon pricing policies between the EU and the UK is more beneficial for carbon competition.
After the EU launched its CBAM, the UK announced similar plans. We analyzed the potential trade and competitiveness impacts. Both CBAMs protect domestic markets from unfair competition of more carbonintensive imports, but differing carbon price policies between the EU and UK can distort carbon competition, as a domestic industry’s carbon-intensity disadvantage can be offset by a higher carbon price for the importer.
When carbon-restricting policies, such as the European Union Emissions Trading Scheme (EU ETS), are limited to certain regions, production may relocate to countries with laxer emissions constraints, causing so called “carbon leakage.” To mitigate this risk, the EU introduced the Carbon Border Adjustment Mechanism (CBAM). The EU CBAM acts as a levy on the covered products imported into the EU. Its value depends on the carbon emissions embodied in the imported product, the EU ETS price, and the carbon price already paid in the country of origin. Currently the CBAM covers cement, electricity, fertilizers, aluminum, iron, and steel, but it is likely to be extended to other markets in the future. For example, there are already requests to extend it to the agriculture sector.
The EU CBAM was launched in October 2023, starting with a transitional phase. Similar to the EU ETS, this phase aims to allow for “a careful, predictable and proportionate transition for EU and non-EU businesses.” This period will not have financial implications but will focus on deploying future reporting and charging systems. Final (and financially binding) data on carbon intensities will be collected during this period.
Starting in 2025, it will be mandatory to use the monitoring methodology specified by the European Commission’s regulatory text. Currently, companies can choose between different ways to report their embedded emissions. For complex goods, they may use default values provided by the European Commission, which are subject to regular revisions as new data becomes available. These default values are based on country-specific estimates from the Joint Research Centre (JCR).
Regarding carbon prices (see figure 1), the EU ETS market of emissions rights (known as EUA) is currently in the range of EUR 70 per metric ton carbon dioxide equivalent (tCO2e). Since the EU ETS is a regulatory market where the offer decreases by 2.2% annually, and industrial players need to buy a larger share of their emissions rights each year, the expected price trend is generally upward. There are various projections on how the volume of covered emissions will reduce over time. Considering the different regulatory mechanisms shaping the market, a price scenario for EUA’s can be derived. There seems to be consensus that the current price of EUR 70/tCO2 to EUR 80/tCO2 is a plateau, from which it is expected to rise to between EUR 150/tCO2 and EUR 250/tCO2 by or after 2030, depending on the source.
Figure 1. EU ETS prices are trading at a premium
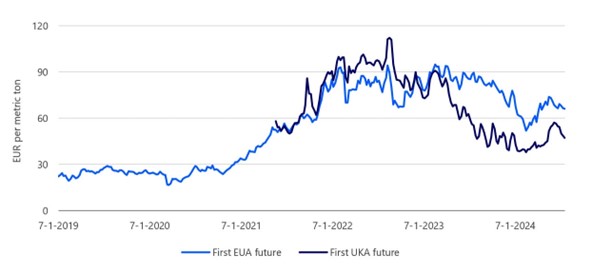
Source: Bloomberg, RaboResearch 2024
The full rollout of the EU’s CBAM in 2026 will drive foreign exporters of carbon-intensive products to market their products more aggressively in other regions, such as the UK. This has sparked concerns among UK producers about unfair competition, leading to calls for the UK government to implement a similar CBAM. In December 2023, the then Conservative-led UK government, proposed introducing a UK CBAM by 2027. This policy will apply to the carbon emissions embodied in imports of aluminum, cement, ceramics, fertiliser, glass, hydrogen, iron, and steel.
The proposed UK CBAM shares many similarities with the EU CBAM, yet there are some notable differences. For example, the UK CBAM lacks a transition period. All requirements will become effective on January 1, 2027. This is a year later than the EU CBAM and reignites the concerns that the UK may temporarily become a haven for carbon-intensive products. The sectoral coverage also differs slightly: The UK CBAM includes ceramics and glass but excludes electricity, unlike its EU counterpart. Moreover, while the EU CBAM aligns with the EU ETS, requiring importers to buy and surrender CBAM certificates pegged to the ETS allowance price, the UK CBAM will function through an import levy. This levy will be determined quarterly by the UK government, referencing past UK ETS prices, and will vary across different sectors.
That said, anything that is currently being written on the UK CBAM’s design and scope is still speculative. The Conservatives introduced the CBAM but left the detailed work to their successors. Meanwhile, the Labour Party aims to balance the industry’s demands for regulatory alignment with the EU and concerns about revisiting Brexit debates. Their plans include intentions to forge closer trading ties with the EU and to address some of the regulatory divergences that have arisen due to Brexit. One such divergence is the existence of two different CBAMs with different emission prices. This is significant, as EU ETS prices have been trading at a large premium to their British equivalent for over a year.
On climate policy, Labour states it will “ensure the institutional framework for policy making reflects our commitments to reach net zero and meet our carbon budgets.” Aligning the UK’s carbon regime with that of the EU would be a logical step to address unwanted regulatory divergence and reducing carbon emissions efficiently. Additionally, the EU-UK Trade and Cooperation Agreement commits both the UK and the EU to consider linking their carbon-pricing schemes. Therefore, it would be strategic for the UK to advance its CBAM to 2026 and formally link the UK ETS with the EU ETS. This move is not without political trade-offs, as the UK would likely lose some of its autonomy. However, given that the EU and UK’s climate ambitions are broadly aligned, we think this should not be an insurmountable hurdle.
Against this backdrop of possible convergence, the current high-level analysis provides initial insights into the implications for the trading partners when both the EU and the UK have a CBAM in place but do not link their carbon markets. We use the region-specific carbon-intensity estimates published by the Joint Research Centre and 2024 physical trade data from the World Bank to calculate the weighted average carbon intensity for the import and export bundles for the product groups of iron, steel, aluminum, cement, and fertilizers. Comparing these weighted averages for the EU and the UK allows us to analyze how competition will be impacted by the new carbon policies. (Note: This analysis is limited to iron, steel, aluminum, cement, and fertilizers based on JCR data availability from).
The impact of carbon policies on the competitiveness of the different actors depends on the total carbon cost a producer incurs. The different charges are typically the result of the product’s carbon intensity and the carbon price in the corresponding market. In a coupled carbon trading system, the carbon price is the same, so cost competition arises solely from differences in producers’ carbon intensity. The producer with higher carbon intensity will face higher carbon costs and thus lose competitiveness.
However, when producers are not subject to the same ETS costs, a CBAM sets a minimum carbon price for imported goods in the CBAM-protected market, that (at least) matches the carbon price paid by the domestic producers. Thus, if two markets with different ETS prices are each protected by a CBAM, the CBAM ensures that the carbon price applicable to the imported product (in each market) is at least as high as the carbon price paid by the domestic producer. Since there is no compensation if the carbon price in the country of origin of the imported product is higher than the carbon price in the importing country, the imported good may end up being charged with a higher carbon price than the domestic product.
As a result, if an importer pays a higher carbon price in the market of origin, the total carbon cost of the imported product can be the same or higher than that of the domestic product, even if the imported product has a lower carbon intensity. Consequently, the higher carbon price on the imported product can offset its competitive advantage of having lower carbon intensity compared to the domestic producer.
The break-even price where carbon costs are equal, can be determined using the following equation:
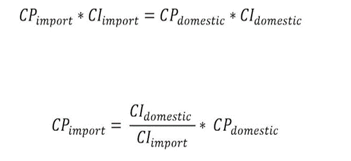
This shows that the break-even carbon price for the region of origin of the imported product, where carbon costs equal those of a domestic product, depends on the relative carbon intensity between the domestic producer and the foreign producer of the imported product. If the domestic producer’s carbon intensity is, for example, twice that of the imported product, the carbon price of the imported product must be twice as high to maintain cost-competitiveness.
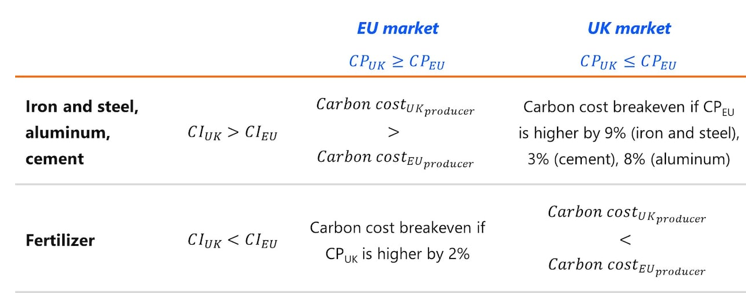
We have summarized the different scenarios for the selected CBAM products, and the carbon intensity figures for the EU and UK markets in table 1. These scenarios are discussed in the following two sections.
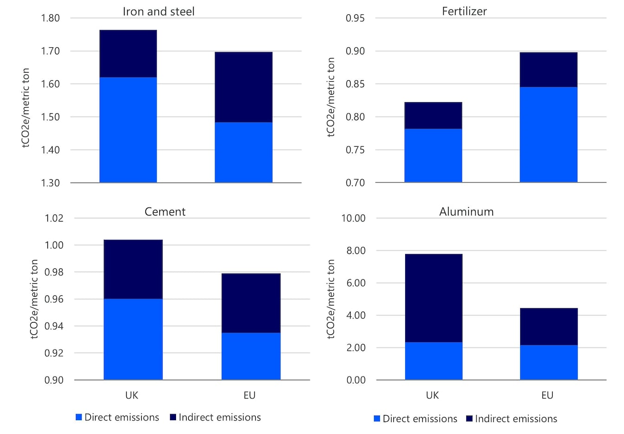
Figure 2 shows the weighted average carbon intensity for products imported from the UK to the EU for each CBAM-covered sub-product, using carbon-intensity estimates from an in-depth study by the JCR (2023). The data reveals that producing the same set of sub-products (of cement, aluminum, or iron and steel) in the UK is, on average, more carbon-intensive than in the EU.1 Consequently, since the EU CBAM will at least equalize the carbon price on the EU market, the higher carbon intensity in the UK will result in higher carbon costs per unit for UK imports to the EU market. This makes EU domestic producers more cost competitive compared to UK imports within the EU market.
With respect to fertilizers, EU producers have a slightly higher average carbon intensity than UK imports (see figure 2). Hence, on the EU fertilizer market, EU producers may face a loss of competitiveness. Yet, since the difference in carbon intensity is relatively small, a slightly higher UK carbon price could shift the balance. If the carbon price in the UK were 2% higher than the EU carbon price, the carbon costs for producing fertilizers in the UK and the EU would break even. Currently, the UK carbon price trades significantly below the EU ETS price (see figure 1), implying that under current conditions, EU producers are less competitive in terms of carbon costs for fertilizers.
Figure 2. Weighted average carbon intensity of 2019 imports from the UK to the EU, using country-specific carbon emission intensity for direct and indirect emissions
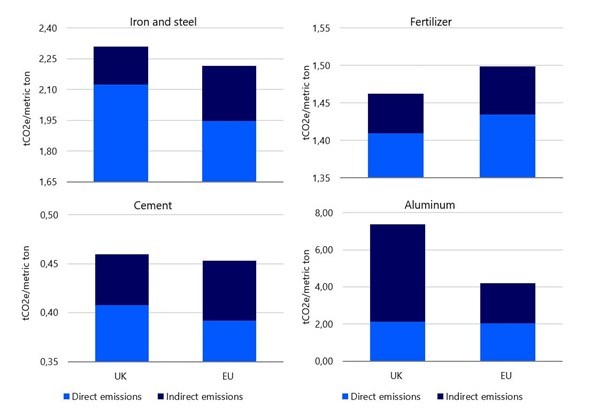
Source: JCR 2022, World Bank, RaboResearch 2024
Table 1. Carbon cost comparison under CBAM protected markets and separate carbon price systems
On the UK market, the EU’s relative carbon-intensity advantage in the production of iron and steel, aluminum, or cement could be offset by an EU ETS price that is higher than the UK CBAM. Figure 3 shows that the EU can produce these CBAM products at a lower weighted average carbon intensity than the UK. However, since the EU CBAM does not affect the EU exports to other markets, and since the UK CBAM will increase the carbon price for EU products if the EU ETS price is lower – but not decrease it if the EU ETS price is higher – EU exports may face a higher carbon price. This could outweigh the advantage of the EU’s lower weighted average carbon intensity. In fact, the EU ETS price would only have to be 9% higher than the UK ETS price for carbon costs to be equal. For aluminum, the same import bundle produced in the UK would be 8% more carbon-intensive. Thus, the EU carbon price would need to be 8% higher than the UK carbon price for carbon costs to break even. For cement production, an EU carbon price of only +3% above the UK carbon price would offset the EU’s average carbon-intensity advantage on the UK market.
Fertilizers present an opposite case. Facing a UK CBAM, EU producers may lose competitiveness on the UK market if they do not decrease their carbon intensity. In fact, the weighted average carbon intensity of producing the export bundle of fertilizer products in the EU is higher than it would be if produced in the UK (see figure 3). Consequently, since the UK CBAM requires EU producers to pay at least the same carbon price as prevalent in the UK, EU producer face higher carbon costs.
Figure 3. Weighted average carbon intensity of 2019 imports from the EU to the UK, including country-specific carbon emission intensity for direct and indirect emissions
Source: JCR 2022, World Bank, RaboResearch 2024
Overall, since the average EU ETS price was roughly 50% higher than the average UK ETS price over the past 12 months, EU producers would remain less carbon cost-competitive than UK producers in the UK market, despite their average advantage in carbon intensity for iron, steel, aluminum, and cement. Consequently, they could lose market share in the UK, either to the more carbon cost-competitive local UK producers or to imports to the UK market from other countries that are even less carbon-intensive than those from the EU. Hence, some export-related carbon leakage may persist for the EU in the UK market unless the two regions align their carbon prices or the EU extends the CBAM to support its carbon-efficient exporters.
From the UK perspective, it may seem beneficial to keep the carbon price below the EU ETS price to compensate for the loss of competitiveness relative to their EU competitors in the UK domestic market. Given that the UK imports significantly more from the EU (in total monetary value) than it exports to the EU, this approach seems to be more attractive than keeping carbon prices up to decrease the carbon intensity and become more competitive in the EU market. However, it is important to note that such a consideration overlooks the complexity of reality. This analysis is limited to bilateral trade flows, average trade values, or the current product scope and design of the CBAM(s). More importantly, this strategy would compromise the UK’s climate targets, contradicting the new government’s promises.
This analysis shows that differences in carbon prices between the UK and the EU can tip the balance for cost competitiveness between the two players, as it can offset a carbon-intensity disadvantage of a domestic industry. Based on recently published carbon-intensity figures by the JCR, we calculated that this could be the case for EU producers of iron, steel, aluminum, and cement on the UK market. Despite their lower carbon intensity, EU producers may become less competitive on the UK market compared to UK producers if the EU carbon price is 3% to 9% higher than the UK carbon price. Thus, if the EU ETS price remains above the UK ETS price, the cost advantage due to the lower carbon intensity might be offset on the UK market, decreasing the competitiveness of EU producers in the UK market. Conversely, in the EU market, EU producers can expect to gain competitiveness when protected by the CBAM. This is because UK producers, on average have higher carbon intensity in the production of iron, steel, aluminum, and cement. The CBAM ensures that products imported from the UK face (at least) the same carbon prices as those produced within the EU. Consequently, this leads to higher carbon costs for products imported from the UK to the EU compared to EU-produced goods.
Fertilizers present an opposite case. In the case of fertilizers, EU industries are less carbon-cost competitive compared to UK producers in the UK market due to the EU’s higher carbon intensity in the production of fertilizers. Yet, in the EU market, EU producers could remain cost-competitive relative to UK producers, if the UK carbon price is 2% higher than the EU ETS price, despite being less carbon-intensive.
This shows that while the EU and UK CBAMs protect their respective domestic industries from more carbon-intensive foreign competitors, differences in carbon prices can in principle lead to a distortion of carbon competition. This can be the case if the carbon price for the imported product is higher in the region of origin than in the importing region. Thus, aligning carbon pricing policies between the EU and the UK would be beneficial for carbon competition.
This is generally true for the portfolio of imported products when considering the direct carbon intensity of production. However, the analysis shows that even when taking indirect emissions into account, the UK’s production remains more carbon-intensive on average. According to current EU legislation of the CBAM, indirect emissions are not initially considered for goods where the carbon costs from electricity use are compensated (Article 19). Annex II of the CBAM regulation specifies that this applies to iron and steel (except for product code 2601 12 00), aluminum, and hydrogen.