This SPB does not necessarily represent the opinions of the Banque de France, of the Eurosystem and of NEOMA.
Technology may significantly contribute to reaching the 2015 Paris Agreement goals of net zero carbon dioxide (CO2) emissions and global warming below 2°C in 2100. To test that, we use the Alestra et al. (2022) Advanced Climate Change Long-term Model (ACCL), particularly adapted to quantify the consequences of energy price and technology shocks. We assess a multi-lever climate strategy combining energy efficiency gains, carbon sequestration, and a decrease in the relative price of “clean” electricity with a rise in the relative price of polluting energy sources. None of these components alone is sufficient to reach climate objectives, but our composite scenario achieves the climate goals.
Technologies must be a significant part of the mix to reach net zero greenhouse gas (GHG) emissions and limit climate warming (see the Intergovernmental Panel on Climate Change report, IPCC, 2022a, and 2022b, or the International Energy Agency scenarios, IEA, 2021). The role of technologies relies on future innovations but also requires their diffusion and the diffusion of past innovations. Yet, the stock of underutilised past CO2-saving innovations is still considerable, for example, in the building sector to reduce heating needs. Different types of technology improvements are at the heart of policies devoted to reducing CO2 emission1: energy efficiency gains to reduce the use of energy in power units per GDP (Gross Domestic Product) in volume, carbon capture, utilisation and storage technologies (CCUS), renewable energy deployment.
This SUERF Policy Brief quantifies the contribution of technologies to CO2 emission reduction and to the limitation in damages from climate change. It uses the Advanced Climate Change Long-term model (ACCL), described in Alestra et al. (2022)2, a model with a comprehensive modelisation of TFP dynamics and differentiation of energy sources, which distinguishes five types of energy, four “dirty” in terms of CO2 emissions (coal, petrol, gas, “dirty” electricity) and “clean” electricity. Hence, it provides an accurate and transparent quantification of the contribution of green technologies to the energy transition and climate mitigation mechanisms. We consider three ‘green’ technology improvements: energy efficiency gains, diffusion of CCUS technologies and a decrease in the relative price of “clean” energy. This last component can correspond to the result of innovation or a tax/subsidy-oriented policy.
According to our simulations, a world without ‘green’ technologies does not reach climate objectives. We find that only our composite scenario achieves the climate goals. Indeed, scenarios without ‘green’ technologies require very challenging assumptions, like perfect coordination among countries in the immediate implementation of very ambitious climate policies (high carbon taxation – HCT – scenario3), to limit climate damages with a temperature increase below 2°C in 2100.
In what follows, we consider as the baseline scenario a worldwide low carbon tax (LCT), on top of which we add different technological innovations. All countries implement the LCT scenario from 2017 onwards simultaneously. It assumes an increase in the relative price of each of the four “dirty” energy types by 1% per year and stability of the relative price of the “clean” energy over the whole period and in all countries. These hypotheses mean that the relative prices of the four polluting energy sources are multiplied by a factor of 2.25 at the 2100 horizon. This LCT scenario has to be considered analytical. At the same time, the relative price increase in the four “dirty” energy types appears modest compared to the one in our HCT scenario3, which is more realistic regarding public acceptance. To facilitate this acceptance and neutralise the anti-redistributive impact of the tax, receipts from this carbon tax can be transferred to the low-income part of the population as advised, for instance, by Stiglitz (2019). They can also finance renewable energy subsidies.
A first ‘green’ technology scenario corresponds to energy efficiency gains. It means a decrease in the ratio of energy use to GDP in volume. Since the oil shock, advanced economies recorded energy efficiency gains, which reached 1.6% per year in the 2010s (IEA, 2021). These gains stem from innovation targeted at reducing the use of energy inputs but also on the diffusion of existing technologies and basic quality improvement. The renovation of existing buildings is the first source of energy efficiency gains in the IEA scenario before gains in transport and industry. Energy efficiency gains can accelerate with the implementation of a carbon tax or carbon emission regulations. We simulate two energy efficiency gain profiles. First, we project a trend of gains of 1.6% per year, corresponding to the trend observed in the recent past. Second, we use the IEA (2021) energy efficiency scenario profile, which frontloads energy efficiency gains in the 2020s, as simple measures can be very quickly implemented (diffusion of energy-efficient appliances, buildings renovation…). Once these low-hanging fruits are picked up, energy efficiency gains slow down. Hence, energy efficiency gains reach 4.2% per year in the 2020s and slow down to 2.7% from 2030 to 2050. Afterwards, we return to the previous energy efficiency trend of 1.6% per year. None of these two scenarios appears sufficient to reach the less than 2°C goal in 2100. They do not achieve net-zero emissions by 2100, and global warming continues.
A second ‘green’ technology scenario corresponds to an increase in CCUS. CCUS are technologies that separate CO2 from other gases at emission or directly from the air, use it in extraction or industrial processes or store it in natural facilities. It excludes biological carbon sequestration such as forestry or fertilization of oceans. Mature CCUS technologies are used for CO2 capture at emission from sizeable industrial or extraction facilities. They are particularly relevant for electricity generation, steel or cement production and natural gas treatment. CCUS are energy-intensive and costly technologies, explaining why they did not develop although they could have been implemented for decades. CCUS scenarios crucially hinge on the implementation of CO2 tax, which is needed to set the proper incentive to implement these technologies. Estimates using the ACCL model for sequestration on the scale of the IPCC and IEA scenarios are not sufficient to limit temperature increase below 2°C in 2100, and reach net zero CO2 emissions.
A third ‘green’ scenario corresponds to the development of non-CO2 emitting energies. According to the IRENA (2021 and 2022), renewable technologies are increasingly competitive. Depending on renewable sources, the electricity cost dropped from 48% (offshore wind) to 85% (utility-scale solar photovoltaics) between 2010 and 2020. The electricity costs of all renewable technologies are now comparable to those of new generation capacity from fossil fuels. Raising awareness about climate change, potential innovations such as renewable hydrogen, modern biomass or improved storage capacities and the redirection of public subsidies towards cleaner power generation may foster this improvement in renewable feasibility and affordability in the future. We add three scenarios to our LCT carbon tax scenario: ISE (Increased Substitution Elasticity), DREP (Decrease in Renewable Energy relative Price) and a combination of the two. The ISE scenario implies a global rise in the elasticity of substitution between CO2– and non-CO2-emitting electricity from 2 to 2.5. We calibrate both values according to the range of substitution elasticities given by Papageorgiou et al. (2017). The DREP scenario represents a 3% annual reduction of the price of non-carbon-emitting electricity relative to the GDP price on the world scale. The best-case scenario is the combination of carbon taxation on polluting energy sources and technological Progress (TP), making renewable power both cheaper and more feasible. Yet, we find that such a scenario is not enough to achieve the COP21 (2015 United Nations Climate Change Conference) goals, as global temperatures still rise by 3°C in 2100.
Our previous results show that a single-lever strategy is not enough to limit global warming below 1.5 or 2°C. Hence, to reach this climate goal, governments must consider implementing multiple strategies simultaneously to limit energy consumption, encourage substitution towards less polluting energy sources and reduce GHG emissions.
We consider four composite scenarios combining our LCT scenario, the global rise of the relative price of CO2-emitting energy sources by 1 or 1.5% a year for the whole period, with either or both the ‘usual’ TP and a ‘green’ technology package. On the one hand, the ‘usual’ TP hypothesis represents a technological shock that is not specifically oriented toward climate goals. As ‘usual’ TP increases GDP without affecting energy efficiency, it contributes to increasing CO2 emissions. We assume a 0.5 percentage point constant decrease in the investment relative price from 2017 to 2100 in all countries and areas. On the other hand, the ‘green’ Technology Mix (TM) is a combination of the different technological hypotheses presented above, which are directly oriented toward the objective of a decline in the stock of GHG. We keep our calibration based on IEA (2021) for the energy efficiency gains of 1.6% per year and the CO2 sequestration through CCUS technologies of 7.6 Gt a year, and our decrease in the relative price of non-carbon-emitting electricity by 3% a year, all of them assumed identical for the entire world and time span. We do not include the ISE scenario as it has little effect on our outcomes.
The Graph summarises the results obtained with the ACCL model. In the absence of ‘usual’ TP, the combination of an increase in CO2-emitting energy prices by 1% a year and the technology mix divides worldwide net carbon emissions by 14, keeps global warming below 2°C and limits climate damages to 1% of the world GDP in 2100. However, global net CO2 emissions remain positive at this horizon. Raising the carbon tax to an annual 1.5% growth of the relative price of CO2-emitting energies, still as a complement to the ‘green’ technology package, ensures that the world meets the COP21 target in terms of global temperature rise (here, +1.59°C) at the end of the century, and even in the case of ‘usual’ TP (+1.73°C). In this scenario, global net CO2 emissions are nil in the presence of ‘usual’ TP and even negative in its absence. Moreover, we consider the 1.5% LCT scenario more realistic to fund public expenditures and to provide incentives for the private sector to implement the ‘green’ technology mix.
Graph: 2100 increase in world temperature and climate damage in Low Carbon Tax (LCT) scenario with ‘usual’ Technological Progress (TP) and/or a ‘green’ Technology Mix (TM)
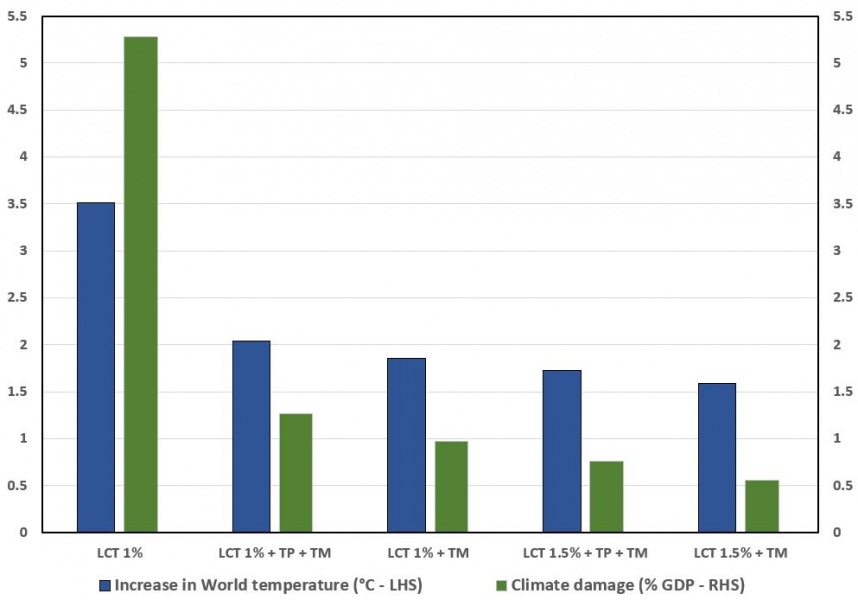
LCT: Low Carbon Tax – Increase in the relative price of “dirty energy” by 1% or 1.5% per year.
TP: Technological Progress not specifically oriented toward climate goals, corresponding to a 0.5 percentage point constant decrease per year in the investment relative price.
TM: Technology Mix – a combination of efficiency gains of 1.6% per year, CO2 sequestration through CCUS technologies of 7.6 Gt a year, and a decrease in the relative price of non-carbon-emitting electricity by 3% a year.
Note: Left-hand scale in °C for the increase in world temperature and right-hand scale in % of GDP for climate damage.
Only a composite scenario adding technological action to a realistic increase in the relative prices of “dirty” energy will make it possible to achieve the climate goals. This result is consistent with IPPC (2022b). Nevertheless, our simulations assume the absence of tipping points and such a scenario needs to start immediately and be coordinated in all countries, a situation difficult to meet considering the current geopolitics. A late or incomplete implementation means that efforts will have to be stronger in a second phase to compensate for higher gas emissions during the delay. This situation would correspond to a failure and would clearly express that we renounce losing a small part of comfort and quality of life in the present for a high price, in terms of climate damage, for the next generations in the future.
Alestra, Claire, Gilbert Cette, Valérie Chouard & Remy Lecat (2022): “Growth impact of climate change and response policies: The advanced climate change long-term (ACCL) model”, Journal of Policy Modeling, 44 (2022), pp. 96–112.
Alestra, Claire, Gilbert Cette, Valérie Chouard & Remy Lecat (2023): “How can Technology significantly Contribute to Climate Change Mitigation”, Banque de France, Working Paper, n° 909, February.
IEA (International Energy Agency) (2021): “Net Zero by 2050”, IEA, Paris.
IPCC (Intergovernmental Panel on Climate Change) (2022a): “Climate Change 2022: Impacts, Adaptations and Vulnerability. Working Group II Contribution to the IPCC Sixth Assessment report”.
IPCC (Intergovernmental Panel on Climate Change) (2022b): Mitigation of Climate Change. Contribution of Working Group III to the Sixth Assessment Report of the Intergovernmental Panel on Climate Change. Cambridge University Press, Cambridge, UK and New York, NY, USA.
IRENA (2021): “Renewable Power Generation Costs in 2020”, International Renewable Energy Agency, Abu Dhabi.
IRENA (2022): World Energy Transitions Outlook 2022: 1.5°C Pathway, International Renewable Energy Agency, Abu Dhabi.
Papageorgiou, Chris, Marianne Saam & Patrick Schulte (2017): “Substitution between Clean and Dirty Energy Inputs: A Macroeconomic Perspective”, The Review of Economics and Statistics, 99(2), pp. 281–290.
Stiglitz, Joseph (2019): “Addressing climate change through price and non-price interventions”, European Economic Review, Vol. 119, issue C, pp. 594-612.
For a detailed presentation of these different technology improvements, see Alestra et al. (2023).
The projection tool is available online at the following address: https://advanced-climate-change-long-term-scenario-building-model.shinyapps.io/ACCL_Projection_Tool/
Our HCT scenario, which reaches the climate goal of below 2°C warming, considers an increase in the relative price of each of the four “dirty” energy types by 3% per year. The relative price of “clean” energy is assumed to stay stable over the period in all countries. It implies that the relative prices of the four emitting energies are multiplied by a factor of 11 at the 2100 horizon. This climate policy is perfectly coordinated in all countries.