
The views expressed here are those of the authors and do not necessarily reflect those of the Bank for International Settlements (BIS).
Abstract
Historically, central banks have at times operated successfully with negative equity. This suggests that a negative equity position of the central bank can be fully consistent with preserving trust in money. In addition, there is no systematic empirical relationship between the equity position of central banks and their ability to meet their monetary policy objectives. Nevertheless, the case of the Bank of Amsterdam in the late 1700s, and the emerging market crises of the 1980s and 1990s, provide cautionary tales on the importance of fiscal backing in upholding trust in money. The pivotal economic determinant behind the trust in money is the portfolio decisions of private holders of central bank money.
Over the past couple of years, central banks have rapidly raised policy rates to combat inflation. This resulted in valuation losses on their longer-duration assets and a higher cost of remuneration on reserve balances, eroding their capital. Yet, central banks are unlike private financial entities in that they are public institutions that pursue public policy objectives. Their aim is not the pursuit of profits. Any profits or losses are the result of policy actions in pursuit of their policy mandate. In particular, because central banks are issuers of fiat money, their liabilities are unlike the debt liabilities of private sector entities that are subject to repayment or redemption. Therefore, the standard test of solvency – having positive equity – does not apply in the same way to central banks. They can operate with negative equity, and many have done so in recent decades. Yet, central bank capital may still matter for preserving the trust in money, a question we address in Bell et al (2024).
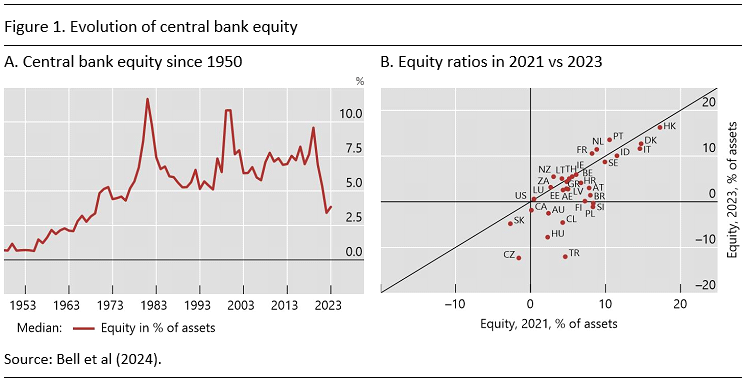
Central bank equity has varied considerably over time and across advanced and emerging market economies (Figure 1.A).1 It followed an upward trend until 1980, with the median level across countries reaching over 10% of assets that year and then hovering around 5–10% until the post-pandemic inflation surge in 2022, which triggered a substantial fall. Figure 1.B shows that the decline has been common across most countries, with equity levels in 2023 generally lower than those in 2021. This mainly reflects the impact of the post-pandemic monetary policy tightening to curb inflationary pressures as rising interest rates have reduced profits or even led to losses, especially for those central banks that had engaged in large-scale asset purchase programs.

Anecdotal evidence suggests that negative central bank equity does not inherently compromise price stability. Chile, Czechia and Israel are well-known examples of such cases. Central banks in these countries have faced persistent phases of negative equity, at times exceeding 20% of assets, and equity was still negative as of the latest available observation. Yet inflation rates have remained far lower than in past decades and are falling again as of the latest available observation, as central banks pursued credible inflation targeting mandates in a context of relatively sound fiscal positions. More formal evidence supports this notion. For a panel of 47 countries over the post-war period, there is no statistically significant link between central bank equity or periods of negative central bank equity and future inflation outcomes (Bell et al (2024)).
The Bank of Amsterdam in the 18th century
The Bank of Amsterdam provides a particularly vivid cautionary tale on the role of central bank capital – and what happens when it is depleted against the background of weak public finances. The Bank was founded in 1609 as a public deposit bank owned by the municipality of Amsterdam. The Bank was able to grow and become successful due to the trust in its stability, sound finances and backing by the municipality of Amsterdam. Bank guilders were backed by holdings of silver and gold coins, and implicitly by Amsterdam city authorities.
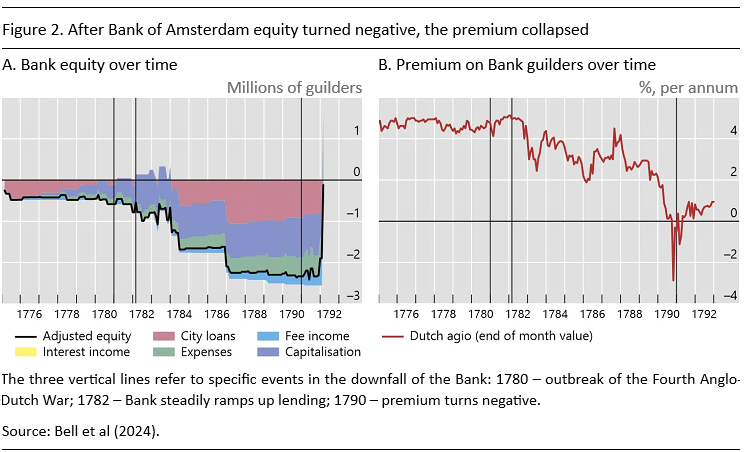
Yet this foundation eventually cracked. In 1780, the Fourth Anglo-Dutch War broke out, leading to naval confrontations with the English. This also affected the ships and activity of the other key institution of the time – the Dutch East India Company (VOC). Starting in 1782, the Bank lent increasingly large amounts to the VOC, until such lending made up the majority of the Bank’s assets. When the VOC lost ships and was unable to repay the loans, trust in the Bank and the Bank guilder started to erode. As Bank equity turned negative (Figure 2.A), the premium on Bank guilders over metal coins (the so-called Dutch agio) fell below 5%. By 1790, it fell even below 0% (Figure 2.B).
The city authorities made limited attempts to recapitalize the Bank, but the funds were soon redirected to the city coffers and the Bank remained policy insolvent. The fiscal capacity of the city at the time was far too limited to support a global institution like the Bank.

In the model of Bolt et al (2024), the value of bank money to users (i.e. the deposits issued by the Bank of Amsterdam) depends on its value in settlement of wholesale trade transactions, and thus on the volume of trade and the general buoyancy of the economy. After a negative shock to the economy that reduces the value to users, demand for bank money falls. The network effects in the use of bank money further amplify the decline in the value to users of holding bank money. Other things equal, the excess supply of bank money would put downward pressure on the exchange rate.
In principle, the Bank of Amsterdam could respond to a negative shock by reducing the money supply to restore the exchange rate to the desired level. It could do so by selling local coins in the daily open market and debiting the accounts of buyers, thus reducing money supply. However, in the presence of illiquid loans on the balance sheet, there is a hard limit to the reduction in the money stock. Once the Bank has sold all the liquid assets (the coins), the sales needed to stabilize the exchange rate cannot go further, as there is no more capacity for a reduction in the deposits.
Two key features stand out from the analysis in Bolt et al (2024). First, while the network effects of fiat money allow monetary regimes to persist for quite some time, there are limits to how resilient such arrangements can be. Second, the tipping point where fiat money becomes worthless comes closer when central bank equity becomes more negative and when economic fundamentals are weaker. Crucially, the Bank of Amsterdam did not receive fiscal support from a sovereign with (adequate) power to tax.
The credibility of fiat money may be at risk if holders of fiat money doubt the willingness of the fiscal authority to recapitalize the central bank in times of need. The loss of confidence manifests itself in a switch in the portfolio of monetary instruments used in the economy. The loss of trust resulted in a coordinated switch away from Bank money to metal coins for the Bank of Amsterdam in the 1700s. In a modern context, such a shock could occur through dollarization, as we have seen in the case of many emerging market economies, or potentially through “cryptoization”, where the portfolio decision in the money system tilts towards cryptocurrencies or private stablecoins.
EMEs in the late 20th century
The experiences of many EMEs in the late 20th century provide another cautionary tale, underscoring the key role of fiscal sustainability for trust in money, and of the exchange rate as a key catalyst.
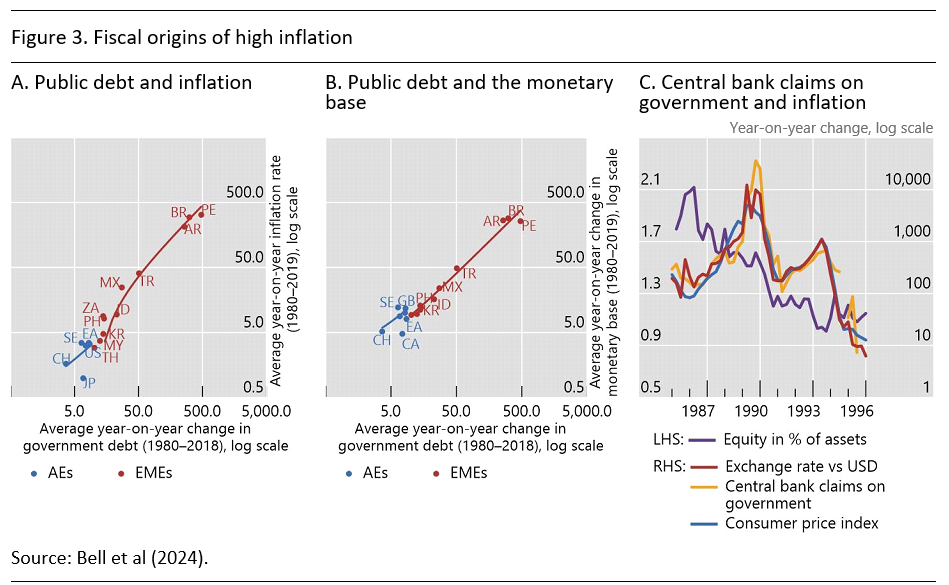
Across major EMEs, there is a positive correlation between average nominal government debt growth and average inflation over the past four decades (Figure 3.A). The correlation is especially strong in Latin America, which experienced very high debt growth and hyperinflation over this period. The correlation between government debt growth and inflation is mirrored in the close correlation between debt growth and base money growth, reflecting monetary accommodation of fiscal trends, i.e. fiscal dominance (Figure 3.B).
The experience of Latin American EMEs in the 1980s and early 1990s shows how unsustainable fiscal developments, accommodated through the money printing press, lead to a progressive loss of price stability. Government financing through the central bank was trending higher over this period, accompanied by rising inflation. Central bank equity fell significantly, but remained positive. This indicates the strains that fiscal crises place on central banks as they are called upon to provide financial support to the government in the run-up and during the crisis, incurring losses in the process.2
These past episodes of emerging market crises highlight the key role of the exchange rate. The unfolding of unsustainable fiscal fiscal-monetary interactions was associated with a massive depreciation of currencies (Figure 3.C), predating jumps in inflation. The role of exchange rates highlights the portfolio choice of private entities who have access to central bank money as well as to alternatives. A sudden depreciation of the domestic currency can be seen as a sign that the portfolio choice of such entities has reached the tipping point, whereby they sell the domestic currency in favor of the alternative.

The form that money takes (whether physical cash, physical ledger entries or digital formats) matters little for the underlying economics. The timeless principle of the need for sound public finances underpinning monetary stability is as relevant today as it was in the 18th, 19th or 20th century. Independent central banks with clear stability mandates, and solid fiscal backing, remain the best bet for a stable monetary system.
Bell S, Frost J, Hofmann B, Sandri D and Shin H S (2024), Central bank capital and trust in money: lessons from history for the digital age, BIS Papers, no 146, June.
Bolt W, Frost J, Shin HS, Wierts P (2024), The Bank of Amsterdam and the limits of fiat money, Journal of Political Economy, forthcoming.
Sargent, T J, Williams N, Zha T (2009), The conquest of South American inflation, Journal of Political Economy, vol 117, no 2, pp 211–56.
To measure central banks’ equity, we rely on data from the International Monetary Fund (IMF) International Financial Statistics. Specifically, we use “Shares and Other Equity” of the central bank, as provided in line 17a. The unbalanced country sample comprises 47 advanced and emerging market economies (see Bell et al (2024) for details).
This is consistent with formal evidence showing that deficit monetization was the key driving force behind most of the high inflation or hyperinflation episodes in Latin American economies (Sargent et al (2009)).