This policy brief is based on Bank of Greece Working Paper Series, No 337 “Climate stress test of the global supply chain network: the case of river floods”. The views expressed are those of the authors and do not necessarily reflect those of the Bank of Greece, the Bank of Canada, the Bank of Portugal, the Joint Research Centre or the European Commission.
Abstract
This study investigates how extreme flood events can indirectly impact the global supply chain through production disruptions. It simulates the transmission and amplification of shocks using a data-driven, agent-based network model that combines company-level data with flood hazard maps. The findings emphasize that the size of inventories is crucial; a lean-inventory system leads to faster shock propagation, higher losses, and fewer recoveries compared to an abundant-inventory one. Moreover, the study identifies that the number and criticality of flooded companies’ trade links, along with the magnitude of the flood, correlate with the speed and severity of contagion. Interestingly, a key metric -the average criticality of affected firms for their customers- consistently peaks before the shock’s propagation increases rapidly. This could serve as an early warning indicator, giving businesses and policymakers precious time to react.
“When France sneezes, the rest of the Europe catches a cold.”1 Although said in an era quite different from the current one, the essence of von Metternich’s remark captures well a feature of modern-day economies. That, in an interconnected system, a systemic event’s consequences can be felt far from its origin. While interconnectedness can be beneficial for a system’s robustness by absorbing negative shocks of relatively small magnitude, it also enables the propagation of large shocks, amplifying their impact (Acemoglu, et al., 2015). This has been emphatically demonstrated in the case of financial networks during the Global Financial Crisis of 2008 (Summer, 2013; Huang, et al., 2013; Glasserman & Young, 2015; Battiston, et al., 2016; Glasserman & Young, 2016; Jackson & Pernoud, 2021; Vodenska, et al., 2021). Another canonical example of a network structure in economics is the supply chain network. Like in the case of financial networks, the respective literature has expanded in the wake of major disruptive events such as earthquakes (Inoue & Todo, 2019; Boehm, et al., 2019; Carvalho, et al., 2021; Freund, et al., 2022), floods (Haraguchi & Lall, 2015; Forslid & Sanctuary, 2023) and the, more recent, COVID-19 pandemic (Pichler, et al., 2022; Ramani, et al., 2022).
The latter’s impact was such that highlighted the critical role of supply chains and triggered a response from various stakeholders. Policymakers at the EU level have taken several actions to understand dependencies and enhance EU’s and Member States’ strategic autonomy.2 Companies reacted by increasing their inventories (Dunn & Leibovici, 2023; Zhang & Doan, 2023) and the academic literature suggested that stress test exercises, similar to the ones carried out for the banking sector, should be developed to assess the resilience of companies’ supply chains in the event of a crisis (Simchi-Levi & Simchi-Levi, 2020; Ivanov & Dolgui, 2022).
A key challenge for the development of a supply chain stress test exercise is data availability. It needs to combine data from many sources, which are often scarce and fragmented, ranging from supply chain information to data for the development of a severe, yet plausible, stress scenario. While sector-level data are reasonably accessible, the aggregation masks the detailed structure of firm-level production networks which enables more accurate estimations of the impact of shocks (Diem, et al., 2024).
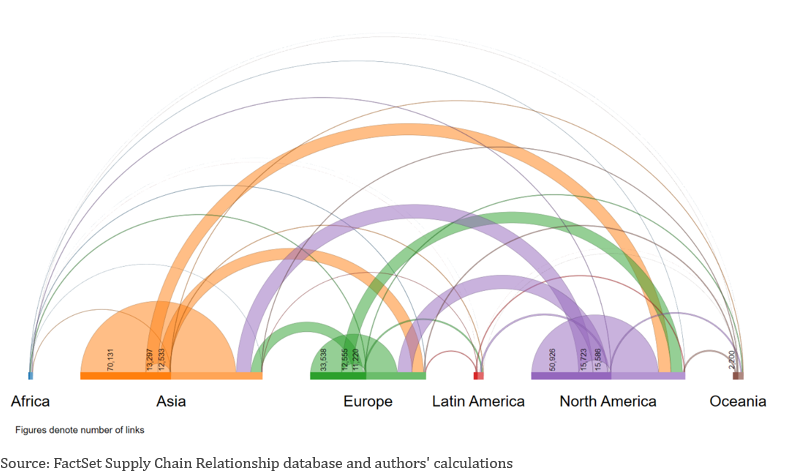
Our study uses supply chain data from FactSet Supply Chain Relationship database which contains binary, directed, links between firms. It identified and extracted the full supply chains in which at least one counterparty is headquartered in the European Union, United States, or Canada. The final sample consists of about 74.5k companies with more than 230k trade links among them. The supply chain network data, as of February 2022, (Figure 1) reveal that the bulk of trade relationships is between companies headquartered in Asia, North America and Europe. Moreover, most links occur intra-continentally, while links from Asia to Europe and North America are similar in absolute numbers with the respective incoming ones.
Figure 1. Numbers and direction of active, as of February 2022, company-level trade relationships grouped by continent
Additionally important elements are companies’ location, the size of their inventories and which inputs are essential for their production. The study sources data on the two former from ORBIS and FactSet, respectively. For the latter it relies on (Pichler, et al., 2022) who conducted a survey to assess how essential an input of a given industry is for another industry’s production.
The study integrates this information into a network, agent-based model to examine the propagation of production disruptions, originating from flood events worldwide, through the supply chain network.
With the ongoing climate crisis, natural disaster frequency and their severity is expected to increase. Already, EM-DAT data since 2000 indicate that floods are the most frequent climate-related natural disaster with an average, direct, economic cost of more than 800 million USD, or 0.24% of affected countries’ GDP (Delforge, et al., 2023). The recent study by (Fahr, et al., 2024) finds that in the event an adverse flood shock materializes globally at the same time, aggregate GDP losses in the Euro Area would be more than 10% of GDP, with considerable heterogeneity across countries. However, with few exceptions, the literature has under-explored the indirect impact of potential flood events and the factors that determine their transmission through the supply chain.
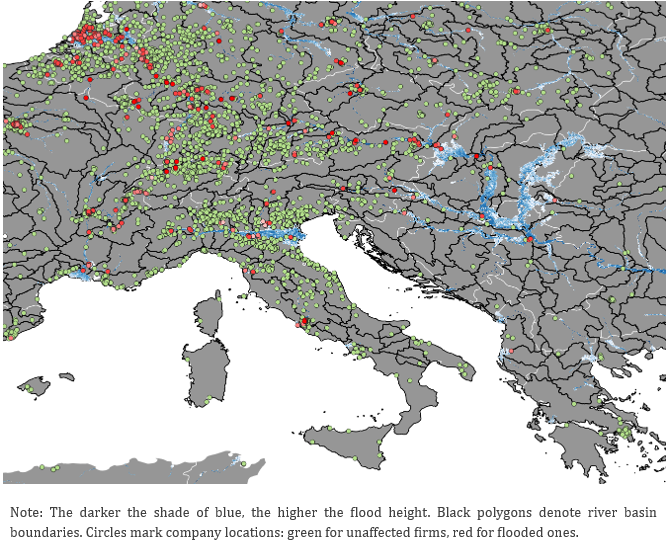
To generate consistent, forward-looking and, severe yet-plausible flood scenarios, the study combines flood hazard maps with 1-in-100 years return period (Dottori, et al., 2016), with river basin information (Lehner & Grill, 2013), depth-damage functions (Huizinga, et al., 2017) and flood recovery times (FEMA, 2022) to estimate initial damage and recovery duration. Figure 2 shows an example of the intersection between firms’ geographical coordinates and the flood hazard data.
The analysis examines 244 individual, global, scenarios. In the average scenario 7 companies are directly affected, which have about 10 customers each.
Figure 2. Detail of global map flood hazard map around main European rivers
The simulations reveal that the size of inventories plays a crucial role in mitigating the shock’s impact by smoothing its transmission and impact through the supply chain.
In the case where most companies follow a lean-inventory system, the average time needed for a shock’s propagation to shift from a slow-moving regime to a fast-paced one is about 35 days. On the contrary, this occurs at more than 500 days, on average, in the abundant-inventory case.
As an impact metric, the study uses the supply chain network’s relative output lost (as a share of the original) at the previous regime-changing moment. For the flood scenarios examined, the impact metric distributions by inventory size, substantially overlap. However, the distribution of the lean-inventory case shows a longer tail, reaching almost twice as far, at 7.5%. Building on the contagion speed analysis, this suggests that losses in the lean-inventory case will be higher and materialize within months, while in the abundant-inventory case, they unfold over a year or more.
Naturally, abundant inventories permit companies who experience input shortages from their suppliers to operate without disrupting their own output for a longer period. This impedes the contagion’s downstream cascade giving time to the flooded companies to recover from the original shock, hence reversing the process. Indeed, within the simulation horizon, 87% of scenarios in the lean-inventory case, result in non-recoverable contagion compared to 72%, in the abundant-inventory one.
Evidently, location is the primary determinant of which supply chains will be affected. The analysis indicates that scenarios originating in Asian countries are, by and large, more impactful; contagion develops faster, and exhibit heavier relative output losses, as a share of the original, undisturbed supply chain network’s output. Specifically, the average Asia-originating, lean-inventory, scenario reaches the high-contagion regime in about 28 days, compared to 35 days for Europe- and 45 days for North America-originating counterparts. This continent ranking holds for both inventory size cases. It is worth noting that scenarios from Oceania and South America are too few to draw representative continent-related conclusions.
Among the various factors which influence the propagation of shocks along the supply chain, an indicator based on firms’ criticality exhibits an interesting property. In particular, the average of affected firms’ criticality consistently peaks ahead of the high-contagion regime’s onset. Thus, it acts as an early warning indicator.
Figure 3. Scenario distribution, by inventory size, of the time difference between the peak of affected companies’ average criticality and the start of the rapid contagion phase (Δ*)
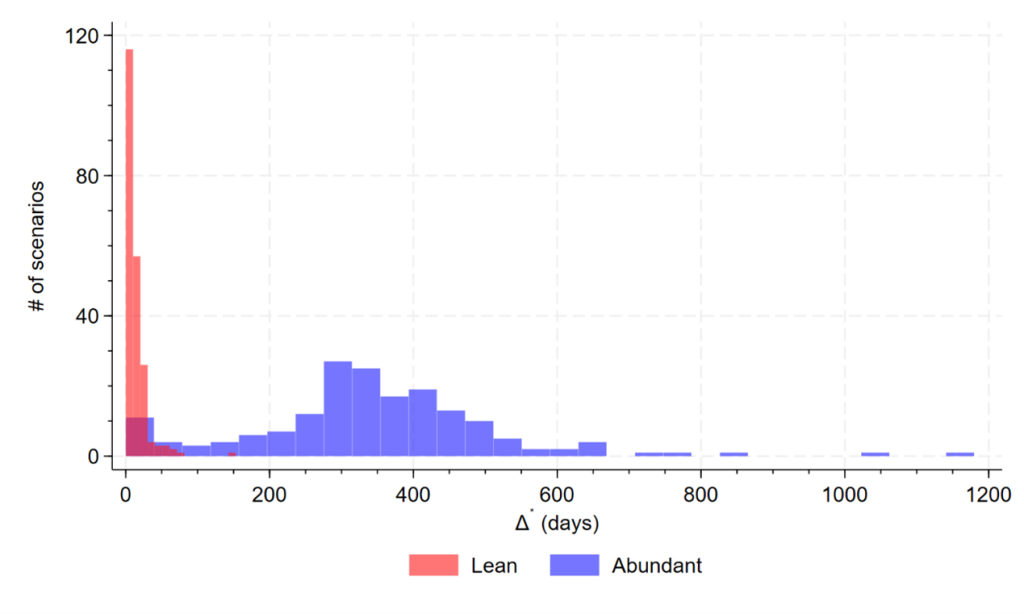
As seen in Figure 3, the duration of the early-warning period strongly depends on the size of companies’ inventories. However, the difference is always positive. In the lean-inventory case, the average early warning period is 13 days while this figure rises to almost a year in the abundant inventory one. Arguably, two weeks is a short timeframe to implement actions which would effectively prevent the disruption’s downstream cascade. However, a warning signal 200-500 days before the rapid spread of production shortages -common in abundant inventory scenarios- should provide ample reaction time for both companies and policymakers to design and implement mitigating measures.
Alarmingly, the most recent evidence indicate that global warming will likely result to a 2.6 oC to 3.1 oC temperature rise by the end of the century which will increase the frequency and intensity of climate-related natural disasters (UNEP, 2024).
This study has shown that the ripple effect of such disasters can spread much farther than its place of origin and have its impact amplified by its transmission through the global supply chain network. At the same time, the analysis identified several factors which can mitigate the adverse effects and even issue an early warning, before the shock’s transmission enters a high-pace regime.
It should be noted that the results provide a ballpark direction and magnitude of extreme flood events’ effect due to several data availability and modelling challenges. One limitation is the lack of locational information at factory-level which would provide a more accurate identification of the originally flooded companies. A simplifying assumption is that a firm cannot substitute the missing inputs from its affected suppliers, neither by forming new trade links nor by receiving extra input from relevant, non-affected ones. While this should reflect the actual behavior of firms in the short run, it suggests that the simulated impact is on the more severe side, i.e. if idle supply and idle demand were matched, this would result in lower contagion and, thus, impact.
Interesting extensions of the study include the implementation of network “re-wiring”, i.e. creation of new links among companies, the inclusion of price dynamics and the consideration of additional impact channels such as firms’ debt-repaying capacity and the indirect transmission of the shock to the financial system or the possible effect on unemployment.
Importantly, the study provided a framework which, when combined with more granular and higher quality data, could improve the resilience of the supply chain network against a range of risks, beyond natural disasters.
Acemoglu, D., Ozdaglar, A. & Tahbaz-Salehi, A., 2015. Systemic risk and stability in financial networks. American Economic Review, Volume 105, p. 564–608.
Battiston, S. et al., 2016. The price of complexity in financial networks. Proceedings of the National Academy of Sciences, Volume 113, p. 10031–10036.
Boehm, C. E., Flaaen, A. & Pandalai-Nayar, N., 2019. Input linkages and the transmission of shocks: Firm-level evidence from the 2011 Tōhoku earthquake. Review of Economics and Statistics, Volume 101, p. 60–75.
Carvalho, V. M., Nirei, M., Saito, Y. U. & Tahbaz-Salehi, A., 2021. Supply chain disruptions: Evidence from the Great East Japan earthquake. The Quarterly Journal of Economics, Volume 136, p. 1255–1321.
Delforge, D. et al., 2023. EM-DAT: the emergency events database.
Diem, C. et al., 2024. Estimating the loss of economic predictability from aggregating firm-level production networks. PNAS nexus, Volume 3, p. pgae064.
Dottori, F. et al., 2016. Flood hazard map of the World – 100-year return period.[Dataset].
Dunn, J. & Leibovici, F., 2023. Supply Chain Disruptions and Inventory Dynamics. Federal Reserve Bank of St. Louis, On The Economy Blog.
Fahr, S., Senner, R. & Vismara, A., 2024. The globalization of climate change: Amplification of climate-related physical risks through input-output linkages.
FEMA, 2022. Hazus 5.1 Flood Model Technical Manual. Federal Emergency Management Agency, Department of Homeland Security, Washington, DC, USA.
Forslid, R. & Sanctuary, M., 2023. Climate Risks and Global Value Chains: The impact of the 2011 Thailand flood on Swedish firms.
Freund, C., Mattoo, A., Mulabdic, A. & Ruta, M., 2022. Natural disasters and the reshaping of global value chains. IMF Economic Review, Volume 70, p. 590.
Glasserman, P. & Young, H. P., 2015. How likely is contagion in financial networks?. Journal of Banking & Finance, Volume 50, p. 383–399.
Glasserman, P. & Young, H. P., 2016. Contagion in financial networks. Journal of Economic Literature, Volume 54, p. 779–831.
Haraguchi, M. & Lall, U., 2015. Flood risks and impacts: A case study of Thailand’s floods in 2011 and research questions for supply chain decision making. International Journal of Disaster Risk Reduction, Volume 14, p. 256–272.
Huang, X., Vodenska, I., Havlin, S. & Stanley, H. E., 2013. Cascading failures in bi-partite graphs: model for systemic risk propagation. Scientific reports, Volume 3, p. 1219.
Huizinga, J., Moel, H. d. & Szewczyk, W., 2017. Global flood depth-damage functions. Methodology and the database with guidelines.
Inoue, H. & Todo, Y., 2019. Firm-level propagation of shocks through supply-chain networks. Nature Sustainability, Volume 2, p. 841–847.
Ivanov, D. & Dolgui, A., 2022. Stress testing supply chains and creating viable ecosystems. Operations Management Research, Volume 15, p. 475–486.
Jackson, M. O. & Pernoud, A., 2021. Systemic risk in financial networks: A survey. Annual Review of Economics, Volume 13, p. 171–202.
Lehner, B. & Grill, G., 2013. Global river hydrography and network routing: Baseline data and new approaches to study the world’s large river systems. Hydrological Processes, Volume 27, p. 2171–2186.
Pichler, A. et al., 2022. Forecasting the propagation of pandemic shocks with a dynamic input-output model. Journal of Economic Dynamics and Control, Volume 144, p. 104527.
Ramani, V., Ghosh, D. & Sodhi, M. S., 2022. Understanding systemic disruption from the COVID-19-induced semiconductor shortage for the auto industry. Omega, Volume 113, p. 102720.
Simchi-Levi, D. & Simchi-Levi, E., 2020. We need a stress test for critical supply chains. Harvard Business Review, Volume 28.
Summer, M., 2013. Financial contagion and network analysis. Annu. Rev. Financ. Econ., Volume 5, p. 277–297.
UNEP, 2024. Emissions Gap Report 2024: No more hot air … please!
Vodenska, I. et al., 2021. Systemic stress test model for shared portfolio networks. Scientific reports, Volume 11, p. 3358.
Zhang, H. & Doan, T. T. H., 2023. Global Sourcing and Firm Inventory During the Pandemic. s.l.:RIETI.
Klemens von Metternich (ca. 1830), Austrian diplomat and statesman.
Examples include the Critical Raw Materials Act, the European Chips Act and the list of strategic products for which the EU depends significantly on imports from third countries (Commission Staff Working Paper Strategic dependencies and capacities (SWD(2021) 352 final).