Over the last decade, central banks have increasingly used “unconventional measures” to reach their macroeconomic stabilization objectives as short-term policy rates – their traditional instruments – were judged to be close to their lower bound. In its attempt to counter disinflationary pressures, the European Central Bank (ECB) deployed a unique combination of monetary policy instruments, including a negative interest rate policy (NIRP), rate forward guidance (FG) and quantitative easing (QE). Our analysis finds that the impact of this combination of policy instruments on interest rates and the macroeconomy has been significant. Without NIRP and FG, yields in the front- to medium-term portion of the term structure would have been markedly higher; without QE, the yield curve would have been steeper and the average euro area 10-year government bond yield would have been significantly higher. Had the ECB abstained from using NIRP, FG and QE between 2013 and 2020, annual GDP growth and inflation in 2019 would have been 1.1 p.p. and 0.75 p.p. lower, respectively, and the unemployment rate 1.1 p.p. higher than they actually were.
With short-term policy rates approaching their putative lower bound, several central banks over the last decade resorted to “non-standard” or “unconventional” monetary policy measures. A burgeoning literature has emerged studying the effect of these measures on financial markets, growth and inflation, answering questions of the type: what is the impact of an asset purchase volume equivalent to 1% of GDP? Fewer studies have run counterfactuals to assess how inflation and economic activity would have evolved absent the full package of quantitative easing measures taken over a certain time span. Quantifying such counterfactuals is relevant as a stock taking exercise for central banks, for the design and recalibration of policy measures in the future and eventually for the debate on whether these instruments would eventually become part of the “standard” toolkit of monetary policy, as discussed, for example, in Bernanke (2020) and Bhattarai and Neely (2021).
In addressing the risk of a deflationary scenario and preserving price stability according to its mandate, the European Central Bank (ECB) has stimulated the euro area economy by using a unique set of instruments including: a negative interest rate policy (NIRP), with the ECB’s Deposit Facility Rates being reduced from zero to -50 basis points in five steps between June 2014 and September 2019; rate forward guidance (FG), adopted in July 2013 and revised sequentially over the following years; and asset purchases or quantitative easing (QE), comprising the ECB’s Asset Purchase Programme (APP) of sovereign and privately-issued securities launched in January 20152 and the Pandemic Emergency Purchase Programme (PEPP) introduced in March 2020. In our recent paper Rostagno et al. (2021b) we quantify the joint impact of NIRP, FG and QE on the yield curve and the macroeconomy.3 Thus, unlike several other papers in the academic literature with a focus on individual instruments or only on certain aspects of their transmission, we seek to capture the overall effect of the full instruments mix.
To score the impact of negative rates, forward guidance and quantitative easing on interest rates, we employ a novel identification approach combining interest rate options, policy events and survey-based information.
Our analysis starts by identifying the impact of NIRP, FG and QE on short- and long-term interest rates. In order to estimate the effect of NIRP on forward rates, we use predictive densities derived from interest rate options to gauge the probability that investors have been attributing to the possibility of observing negative rates in the future and we create a no-NIRP counterfactual scenario in which the contemporaneous overnight interest rate is counterfactually always non-negative and agents are assumed to never expect observing negative interest rates at any point in time in the future.
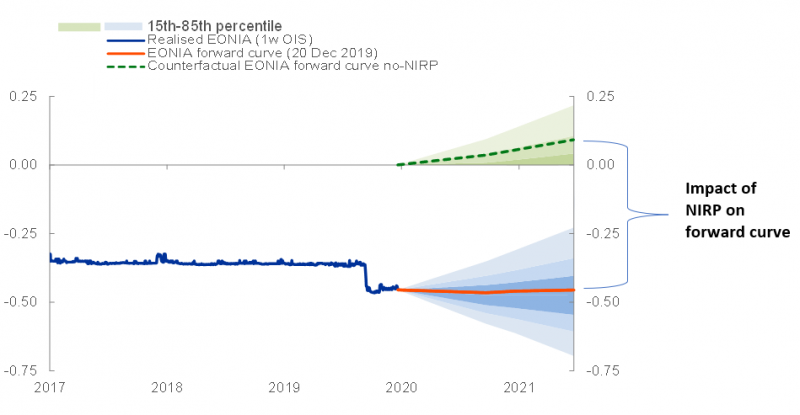
For illustration, Figure 1 shows a fan-type distribution of future realisations of overnight rate paths that we derive from the interest rate options traded on one day at the end of 2019 (blue distribution in Figure 1). The figure also shows the EONIA forward curve observed on that day (red line), which – on that particular date and, more generally, at any point in time – can be thought of as the mean of the distribution of future realisations of overnight rate paths derived from the interest rate options. Our counterfactual forward curve is then constructed based on a hypothetical future interest rate distribution, in which all the probability assigned to negative rate outcomes in the historical distribution is re-allocated to just-zero rates. Specifically, the green distribution in Figure 1 results from a parallel shift in the historical blue density so that the overnight spot rate (EONIA) is counterfactually re-anchored at zero. Furthermore, in order to capture that financial markets completely exclude future negative rates under a “no-NIRP” counterfactual, we re-attribute to zero all the probability mass that the parallel-shifted fan chart would assign to negative rate outcomes.4 The difference between the (higher and steeper) counterfactual forward curve (green-dashed line consistent with the green distribution in Figure 1) and the actual one is the impact of NIRP on forward rates (see Figure 1) on the particular date to which the options-derived distribution corresponds. We conduct such an exercise for each trading day between June 2014 and end-2019.
Figure 1. Eonia forward rates and risk-neutral distributions: history and no-NIRP counterfactual scenario (percentages per annum)
Sources: Refinitiv and ECB calculations.
Notes: The risk-neutral option-implied densities for future Eonia (3M OIS, obtained from the density for 3M Euribor by subtracting the 3M Euribor – 3M OIS spread) are given by the blue fan chart around the red solid line representing the Eonia (3M OIS) forward curve as of end-2019. The green fan chart represents a counterfactual no-NIRP scenario, where the dashed line indicates the forward curve in the no-NIRP scenario. The forward curve is the mean of the distribution; due to the asymmetry with a lot of probability mass at zero, the mean is above the median.
For measuring the effect of FG and QE we use a carefully selected set of events associated to ECB communication on FG and/or QE: announcements of revisions to the rate forward guidance formulation, recalibration of QE parameters (i.e. pace of purchases or purchase horizon), communication about future asset purchases etc. Daily changes in interest rates (short- to medium-term forward rates for FG and long-term sovereign bond rates for QE) are regressed on event dummies and a set of control variables, so that the sum of the regression coefficients corresponding to the events measures the cumulated surprise impact associated with those announcements. Importantly, the set of control variables includes revisions to the ECB’s macroeconomic projections, in an attempt to disentangle the pure Odyssean policy impulse from central bank information effects.5
When measuring the effect of QE, we not only quantify the impact associated to the announcement (the ‘’surprise’’ component), but we also use survey information to account for the gradual build-up of QE expectations that typically materialise in anticipation of the ECB’s announcements. The expectations-building channel turns out to be important. Overall, the cumulated impact on the 10-year sovereign bond yield (average across the big euro area countries) is estimated to reach around 150 basis by end-2019, of which a bit less than half is attributable to the expectations formed before announcements, and the rest comes from market surprises following announcements.
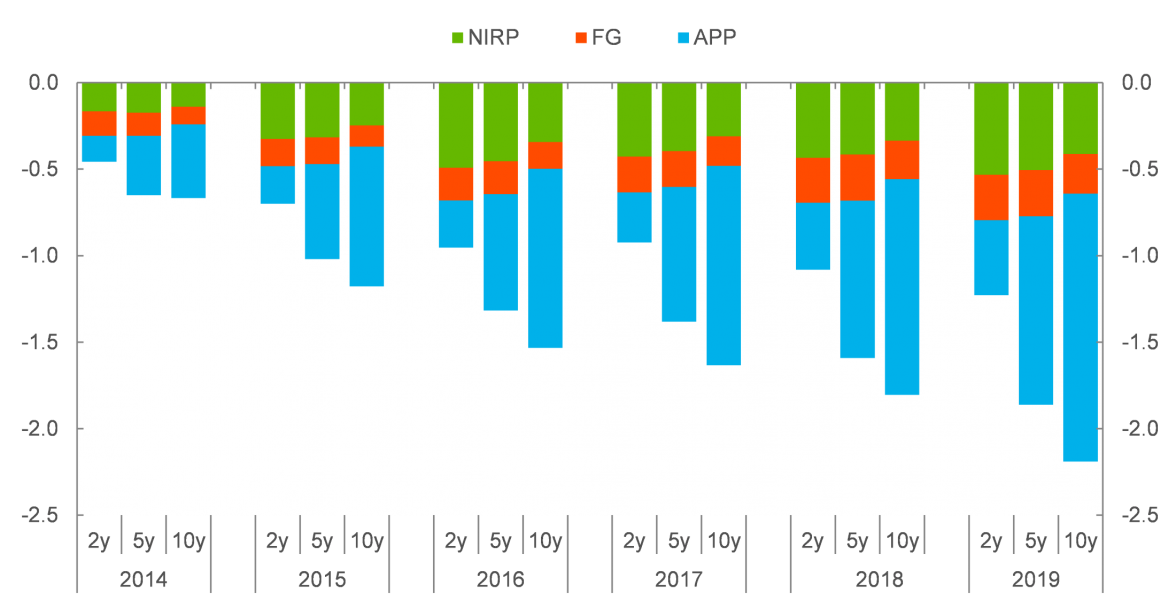
The impact of the three policy measures on the yield curve from 2014 to 2019 is summarized in Figure 2.6 The overall bearing of NIRP, FG and QE on all maturities is increasing over time. NIRP has a relatively stronger effect on shorter maturities, yet affecting longer-term rates more strongly than a same-sized sequence of standard rate cuts in positive territory.7 Forward guidance contributes to easing along maturities but less so than NIRP. The lion’s share of the yield curve impact comes from QE, with a relatively stronger effect for long-term maturities, i.e. QE has contributed to flattening the yield curve.
Figure 2. Impact of ECB’s non-standard measures on sovereign yields (percentage points)
Source: Rostagno et al. (2021b).
Notes: The bars capture the impact of NIRP, FG and QE (the ECB’s APP) on the yield curve over time. Sovereign yields are averages across the four largest euro area economies.
The combination of instruments contributed to significantly higher growth and inflation rates and reduced the unemployment rate.
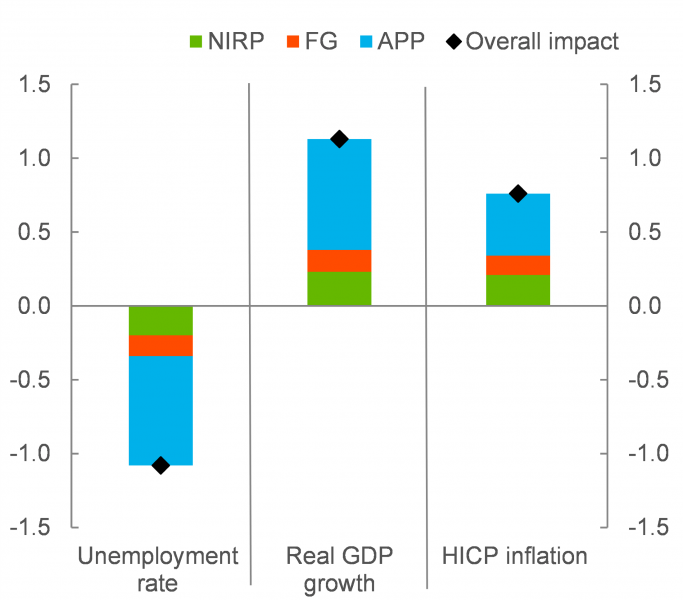
We feed the counterfactual rate histories into a Bayesian VAR to score the effects of the three policies on the macro-economy, and we obtain evidence for a significant stimulus.8 Figure 3 shows the impact of NIRP, FG and QE on growth, unemployment and inflation. Summing over the three measures, in 2019 GDP growth and annual inflation would have been 1.1 p.p. and 0.75 p.p. lower, respectively, and the unemployment rate 1.1 p.p. higher than they actually were, had the ECB abstained from using NIRP, FG and QE since 2014.
Figure 3. Impact of ECB’s non-standard measures on the macroeconomy (percentage points)
Source: Rostagno et al. (2021b).
Notes: The bars capture the impact of NIRP, FG and QE (the ECB’s APP) on the unemployment rate, the annual growth rate of real GDP and the HICP inflation rate in 2019.
Agarwal, R., and Kimball, M. (2019), “Enabling Deep Negative Rates to Fight Recessions: A Guide”, IMF Working Paper, WP/19/84.
Altavilla, C., Brugnolini, L., Gürkaynak, R. S., Motto, R., and Ragusa, G. (2019), “Measuring euro area monetary policy”, Journal of Monetary Economics, Vol. 108, pp. 162-179.
Andrade, P. and Ferroni, F., (2021) “Delphic and odyssean monetary policy shocks: Evidence from the euro area”, Journal of Monetary Economics, vol. 117(C), pp. 816-832.
Bernanke, Ben S. (2020), “The New Tools of Monetary Policy”, American Economic Review, 110 (4), pp. 943-83.
Bhattarai, S., and Neely, C.J. (2021) An Analysis of the Literature on International Unconventional Monetary Policy, Journal of Economic Literature (forthcoming)
Jarociński, M., and Karadi, P. (2020), “Deconstructing monetary policy surprises – the role of information shocks”, American Economic Journal: Macroeconomics, Vol. 12, Issue 2, pp. 1-43.
Lane, P. (2019), “The yield curve and monetary policy”, Speech by Philip R. Lane, Member of the Executive Board of the ECB, Public Lecture for the Centre for Finance and the Department of Economics at University College London.
Miranda-Agrippino, S., and Ricco, G. (2020), “The transmission of monetary policy shocks”, American Economic Journal: Macroeconomics, Vol. 13, Issue 3, pp. 74-107.
Rostagno, M., Altavilla, C., Carboni, C., Lemke, W., Motto, R., Saint-Guilhem, A. and Yiangou, J. (2021a), “Monetary Policy in Times of Crisis: A Tale of Two Decades of the European Central Bank”, Oxford University Press.
Rostagno, M., Altavilla, C., Carboni, C., Lemke, W., Motto, R., and Saint-Guilhem A. (2021b), “Combining negative rates, forward guidance and asset purchases: Identification and impacts of the ECB’s unconventional policies”, Working Paper Series, No 2564, ECB.
The views expressed in this Policy Brief are those of the authors and do not necessarily reflect those of the European Central Bank (ECB).
While private-sector paper (covered bonds and asset-backed securities) had been purchased by the ECB since summer 2014, it was in January 2015 that the inclusion of public-sector debt securities was announced.
The paper leaves aside the assessment of other important instruments, in particular the Targeted Long-Term Refinancing Operations (TLTROs) launched in June 2014. For a comprehensive overview of all the ECB’s unconventional instruments – including targeted and untargeted liquidity operations deployed since 2008 – see Rostagno et al. (2021a).
The green fan chart hence represents distributions that feature a probability “point mass” at zero and a continuous distribution of the remaining probability mass to positive rate outcomes.
The described density- and event-based approaches lead to an estimated impact of NIRP, FG and QE on selected (risk-free) interest rates. With the same BVAR approach as described for the macro assessment in the next section, the estimated rate impacts are translated to the impact of the sovereign bond yields shown in Figure 2.
This is related to the specific transmission channels of NIRP that comes with a stronger portfolio rebalancing channel than standard rate cuts and typically also gives a strong signal that the central bank is open to do (even more deeply) negative rates in the future, see Agarwal and Kimball (2019), Rostagno et al. (2021a) and Lane (2019) for a discussion of those channels that make NIRP transmission different from rate cuts in positive rate territory.
See Rostagno et al. (2021b) for details on the model specification and estimation/simulation strategy.