
The views expressed in this paper are those of the author and do not necessarily reflect the views of the Bank of Finland or the Eurosystem.
When assessing future growth prospects, does it matter how the economy grows now? In other words, does the current structure of demand affect future growth? This question is analyzed in our paper using global and EU panel data. The result is quite striking: consumption-led growth – either in terms of private or public or total consumption – leads to slower growth compared with investment-led or exports-led growth. The same qualitative result emerges irrespectively of the length of the past growth period (lag window). It is only that the more often the past is characterized by consumption-led growth, the slower the growth rate is in the future. This is surely important news from the point of view of both structural and cyclical policies.
In a crisis situation, it is almost always argued that some demand stimulus is needed. More precise policy proposals are less often put forward, and if they are, they are motivated by practical or public policy reasons. But we have good reasons to think that “just more demand” is not a sufficient policy recipe. One piece of evidence which shows this is Kharroubi an Kohlscheen (2017). They demonstrated with data from 12 countries that consumption-led expansions tend often to be significantly weaker than when growth is driven by other components of aggregate demand. Their analysis was based on predictions from a model where the time path of output growth was predicted by eventual consumption-led expansions and various controls like house prices and household credit. It turned out that the slowdown of growth was particularly significant when important imbalances co-existed with the consumption expansion. The fact that the structure of demand has also important long-run consequences was pointed out in Bughin et al (2018). Also the relatively large differences in fiscal multipliers (see e.g. Kilponen et al. (2015)) with respect to different policy variables suggest that changes inside aggregate demand are all but trivial in terms of economic importance.
In this paper we concentrate on the comparative effects and not only focus on consumption but on all demand components and compare their effects on future output growth. For that purpose, we carry out some sort of horse-race test for the different demand components and use data from all World countries and the EU. In both data sets we find that consumption led expansions – both private and public – show up as slower output growth in the future compared with investment and exports-led expansions.
Why then should different demand components’ expansion today affect future growth differently? To some extent, the answer is simple. Most of consumption has no effect on productive capacity and thus on future output. An increase in consumption might even take place at the cost of savings which lowers resources for future consumption. Often consumption booms are “financed” by debt and eventually the debt service costs will also depress consumption.
Opposite to consumption, investment increases productive capacity and output in future periods. As for exports, income from exports makes it possible to expand capacity and output in the future. Higher exports growth may also signal gains in exports markets which may show up in continuing growth of exports, not to speak of other side effects (dealing e.g. with technology, cf. Haddad and Shepherd 2011).
We apply the Kharroubi & Kohlscheen definition of consumption-led growth (or other demand components-led growth) by selecting the observations where the growth rate of a specific demand component exceeds the growth rate of GDP in years t-1, t-2 up to t-5 (Kharroubi & Kohlscheen use a three-year window). Altogether we scrutinize four demand components: private consumption CQ, public consumption GQ, (total) investment IQ and (total) exports EX. Instead of private and public consumption we also use total consumption CA that is the sum of these two. Thus, we get four (five) indicator variables cq, gq, ca, iq and ex, which in the case of e.g. private consumption CQ is computed as cq = 1 if 100*∆log(CQ) > 100*∆log(GDP). Then we just run a regression equation for the growth rate GDP so that the set of RHS variables consist of lagged values of these indicator variables (dummies) and the lagged value of the growth rate of GDP, the per capital GDP level (in USD) plus fixed country and time effects.
Some idea of the results can be obtained by scrutinizing the conditional mean values of GDP growth values with respect to different lagged values of demand components (Table 1).
Table 1: Sample mean values of GDP growth conditional to previous year’s growth pattern
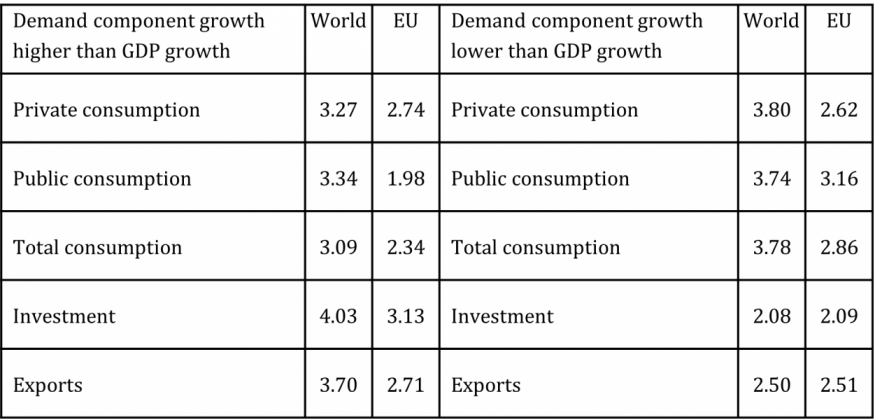
Notes: Here, the private consumption row indicates the average GDP growth rate conditional to cqt-1 > gdpt-1 (first two columns) or cqt-1 ≤ gdpt-1 (last two columns). Similar notation applies to other variables. The data cover 1960-2021 and the number of data points in the World panel data is 5754 and in the EU panel data 1069.
Quite clearly, GDP growth is lower following periods when consumption – private or public or total – growth has exceeded GDP growth. If we reverse the inequality condition in the sample selection, the results turn around (even though not exactly) indicating for instance, that low-consumption growth periods are followed by high GDP growth periods. By contrast, low investment or exports growth periods are followed by low GDP growth periods.
If we use a longer (5-year) window, and count the number of years during which demand component x leads growth we get even clearer results as the following figure for consumption-led growth illustrates:
Figure 1: GDP growth and past consumption-led growth years
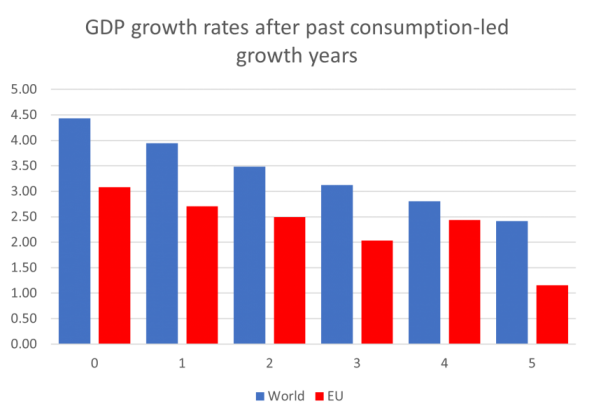
Note: The x-axis indicates the number of years with consumption-led growth during past five years
The pattern is clear. If consumption-led growth periods are more frequent in the past, the lower the subsequent output growth rate. The figure illustrates the situation for total consumption but the outcome is very similar for private and public consumption. Not surprisingly, the opposite outcome turns out when we focus on investment-led growth or exports-led growth. The more often they take place, the higher the growth rate is in the future.
More robust results can be obtained by estimating the above-mentioned equation for GDP growth (for the current and the future periods) using either separate lags for the indicator variables or counting the number of years for the specific expansion periods, see Viren (2022) for details. In almost all cases we find that consumption-led periods are followed either by lower growth rates or the growth effect is simply zero (the coefficients are not statistically different from zero). This is especially clear when we consider aggregate consumption (ca) in the same way as in Table 1. The future outcome is quite different for investment and export-led expansion periods. Then the GDP growth rate is clearly higher. Results for the whole (global) data and the EU data are qualitative very similar, it is only that with the global data much more precise results are obtained.
We have seen that the pattern of aggregate demand growth does affect the future values of GDP growth in the future. Thus, it is not fair to say: “just increase the demand”. The structure of demand makes a lot of difference and also the length and frequency of specific demand periods matter. If aggregate demand is, and has been, very much consumption-led, subsequent growth rates are more likely lower than in the case where investment or exports had led the expansion. This should be kept in mind when designing public policies which intend to boost output – especially if we aim to obtain permanent results.
Bughin, J., H.‐H. Kotz and J. Mischke (2018) Strong aggregate demand: Critical for reaping benefits of digitisation. VOX EU. https://voxeu.org/article/strong-aggregate-demand-critical-reaping-benefits-digitisation
Haddad, M. and B. Shepherd (2011) Export-led growth: Still a viable strategy after the crisis? Vox EU. https://voxeu.org/article/export-led-growth-still-viable-strategy-after-crisis
Kharroubi. E. and E. Kohlscheen (2017) Consumption-led expansions. BIS Quarterly Review, March 2017, 25-37. https://www.bis.org/publ/qtrpdf/r_qt1703e.htm
Kilponen, J, et al.(2015) Comparing fiscal multipliers across models and countries in Europe, ECB Working paper 1760. https://www.ecb.europa.eu/pub/pdf/scpwps/ecbwp1760.en.pdf
Viren, M (2022) Does future growth depend on the current and past demand structure? ACE Working paper.
