The analysis is based on Avignone, G., Girardone, C., Pancaro, C., Pancotto, L., Reghezza, A., “Making a virtue out of necessity: The effect of negative interest rates on bank cost efficiency”, ECB Working Paper Series, No. 2718, 2022.
This brief shows that euro area banks’ cost efficiency, measured by a cost efficiency score inferred from an input-output analysis alongside the ratio of operating expenses over total assets, has improved somewhat in recent years. However, the analysis also indicates that there is still ample scope to achieve further efficiency gains. Banks most affected by the negative interest rate policy (NIRP), i.e. those relying mostly on retail deposits as a source of funding, strategically reacted to the negative effects of NIRP on their net interest margins by improving their cost efficiency. In particular, high-deposit banks that were larger, less profitable, with riskier loan portfolios, weaker pre-NIRP lending growth and that operated in more competitive banking sectors enhanced their cost efficiency more strongly after NIRP than their peers. This helped them to offset the impacts of negative interest rates on their profitability and, thus, supported their solvency and extension of credit. On the other hand, low-deposit banks recorded a decline in their cost efficiency after the introduction of the NIRP. Therefore, going forward, these latter banks will need to invest more effort in improving their efficiency.
This analysis estimates banks’ cost efficiency scores for a large sample of euro area banks1 over the period between 2011 and 2020, focussing on the parameters that are under the effective control of banks’ management. A cost function is used to estimate2 banks’ relative ability to convert inputs into outputs while minimising costs. The most efficient bank is the one that incurs the lowest cost to generate a given amount of output at predetermined input prices. The estimated bank cost efficiency score ranges between 0%, which indicates an entity with structural inefficiency, and 100% that identifies the theoretical best practice frontier. This approach is a useful complement to the accounting indicators typically used to assess efficiency in the banking sector. An advantage of this approach is that the resulting measure of cost efficiency controls for the fact that banks produce different outputs (loans and investments) and pay different prices for inputs (financial capital, physical capital and labour), thereby allowing for a better comparison across banks of different size, ownership structure and specialisation. The bank on the frontier represents the best practice in the banking sector and the remaining banks are measured against this benchmark.3
The median euro area bank has moved closer to the efficiency frontier, as its relative cost efficiency increased from 75% to 79% between 2011 and 2020 (Chart 1). The relative cost-efficiency exhibited a moderate cross-sectional dispersion over time. In 2020, the 25th percentile bank recorded a cost efficiency of 74% while the 75th percentile bank recorded a cost efficiency of 83%. Overall, despite the improvement in relative cost efficiency recorded over the past years, the scope for efficiency gains by emulating best performers was sizeable over the considered time period. Indeed, these findings suggest that if the median bank operated on the efficiency frontier, it could have produced the same level of output at only 79% of its costs in 2020. In other words, about 21% of the costs in 2020 could be attributed to cost inefficiency relative to the most cost-efficient bank.
Chart 1: Cost efficiency has moderately increased over the past ten years…
Cost efficiency score for euro area banks (Percentages; 25th, 50th and 75th percentile for all banks in the sample)
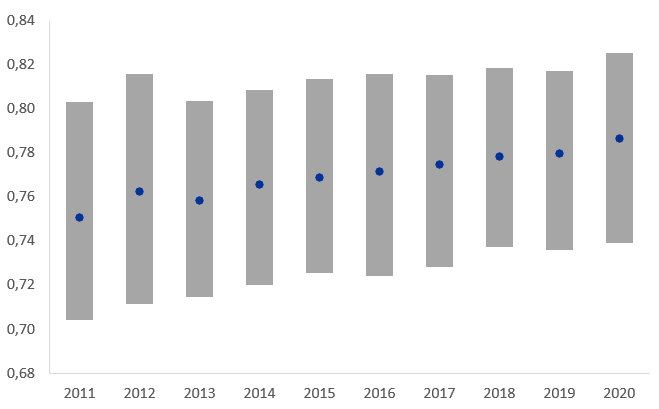
Sources: BankFocus and ECB calculations.
Chart 2: …as operating expenses have moderately declined
Operating expenses over total assets (Percentages; aggregate for all banks in the sample)
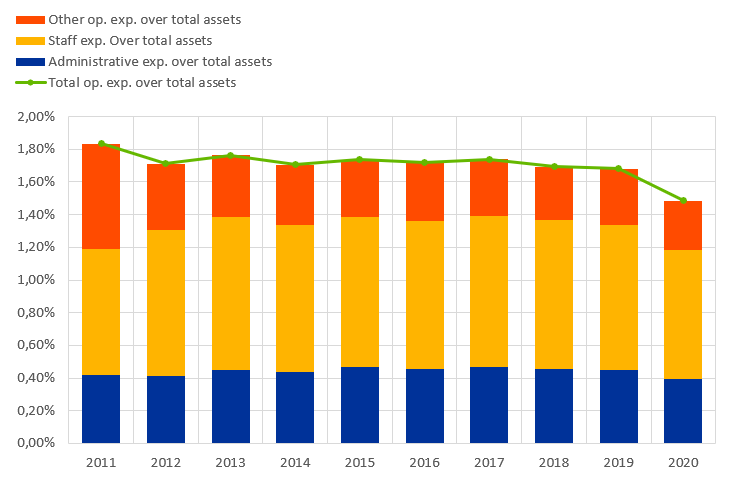
Sources: BankFocus and ECB calculations.
Similarly, total operating expenses over total assets (Chart 2) declined from 1.83% to 1.48% between 2011 and 2020 providing further evidence that euro area banks improved their cost efficiency. Over this period, total operating expenses grew less than total assets in particular due to a decline in other operating expenses and slower growth of administrative expenses.
As a response to the introduction of the negative interest rate policy (NIRP) by the ECB in 2014, euro area banks that were more reliant on retail deposits improved their cost efficiency. High-deposit banks4 had stronger incentives than low-deposit banks to improve their cost efficiency as they experienced greater pressure on their net interest margins due to negative interest rates (Chart 3). In this special feature, using a difference in differences (DiD) approach, in the spirit of Heider et al. (2019)5, the estimated cost efficiency of euro area banks is compared with different deposit to total asset ratios, before and after the ECB’s adoption of NIRP.6 This strategy hinges on the assumption that the behaviour of low-deposit banks offers the counterfactual for the behaviour of high-deposit banks. Indeed, the development of the cost efficiency score for the high- and low-deposit banks shows that cost efficiency for the two group of banks shared a comparable trend prior to the NIRP introduction while it improved for high-deposit banks after the adoption of the NIRP (Chart 4)7. Specifically, high-deposit banks improved their cost efficiency by about 100 basis points due to the introduction of the NIRP in comparison to low-deposit banks (Chart 5). This suggests that the move of policy rates into negative territory has pushed high-deposit banks, which are more materially affected by the NIRP due to their funding structure, to substantially enhance their cost structure compared to low-deposit banks, most likely to offset the stronger pressure they experienced on their net interest margins.
Chart 3: Net interest margins declined more for banks more reliant on deposits
Net interest margin before and after NIRP (Percentages, average for all banks in the sample)
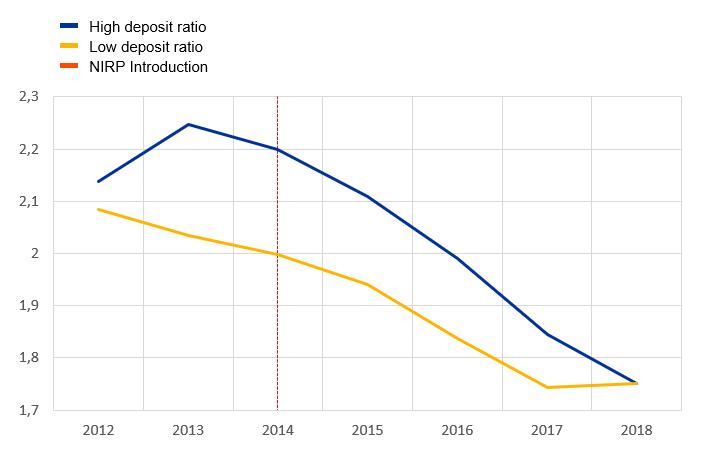
Sources: BankFocus and ECB calculations. Note: The figure displays the evolution of net interest margins over the period 2012-2018 for high-deposit banks (blue line), i.e. banks relying mostly on deposits as a funding source, and low-deposit banks (yellow line), i.e. banks relying to a less extent on deposits as a funding source. The vertical dashed red line indicates the year of the introduction of NIRP, i.e. 2014.
Chart 4: Banks more reliant on deposits improved their cost efficiency
Cost efficiency evolution before and after NIRP (2014=1; index of the average bank in the sample)
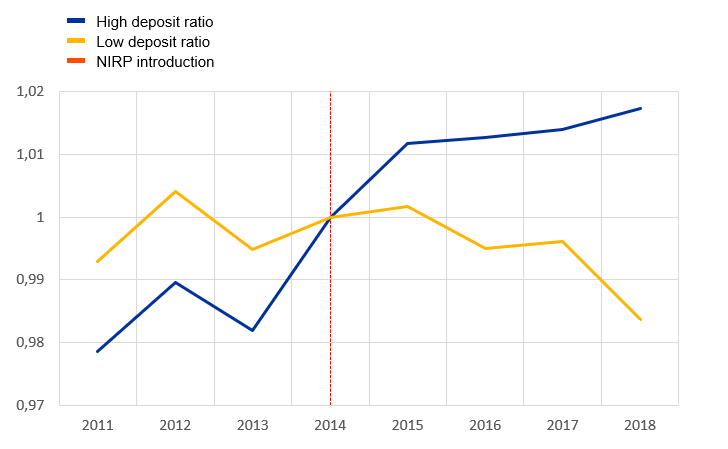
Sources: BankFocus and ECB calculations. Note: The figure displays the normalised evolution (2014=1) of the average bank cost efficiency over the period 2012-2018 for high-deposit banks (blue line), i.e. banks relying mostly on deposits as a funding source, and low-deposit banks (yellow line), i.e. banks relying to a less extent on deposits as a funding source. The vertical dashed red line indicates the year of the introduction of NIRP, i.e.2014.
High-deposit banks that were larger, less profitable, with riskier loan portfolios, weaker pre-NIRP lending growth and that operated in more competitive banking sectors had greater incentives to enhance their cost efficiency after the NIRP adoption than the other banks in the sample. Chart 5 (from the second to the sixth bar) also shows how the estimated impact of the NIRP on cost efficiency is affected by some bank specific characteristics, i.e. size, profitability, asset quality, loan growth, and by the degree of competition prevailing in the banking sector where a bank is established before the introduction of the NIRP. The estimated results show that smaller high-deposit banks had lower capacity to increase their cost efficiency. Smaller banks engaging in relationship lending incur higher monitoring costs given that the so-called “soft” information is gathered and updated through costly long-term lending relationship. Thus, smaller banks found it harder to react to NIRP by improving costs via laying off loan officers and other frontline staff. Moreover, small banks being largely retail oriented had less capacity to effectively diversify their income stream and, thus, boost their margins in response to the NIRP effect. It is also found that less profitable high deposit banks had stronger incentives to improve their cost efficiency likely as they were left with fewer options to tackle the pressure on their margins due to negative interest rates. Banks with weaker asset quality had stronger incentives to improve their cost efficiency as they had to face additional impediments to react to NIRP. First, lower asset quality reduces bank profitability, thus, limiting banks’ ability to expand lending volumes. Second, banks with impaired asset quality cannot exploit in full the beneficial implications of negative interest rates on their funding costs as investors expect a higher risk premium for lending to them. Banks with weaker lending growth before NIRP had stronger incentives to improve their cost efficiency in response to NIRP because of the limited capacity to further boost lending volumes in a negative interest rate environment. Finally, it is found that banks operating in more competitive banking sectors had stronger incentives to improve their cost efficiency as their margins were subject to higher pressure from negative interest rates than banks operating in less competitive markets.
Chart 5: NIRP pushed high-deposit banks to enhance their cost efficiency but bank features matter
Estimated impacts of NIRP on cost efficiency (Basis points)
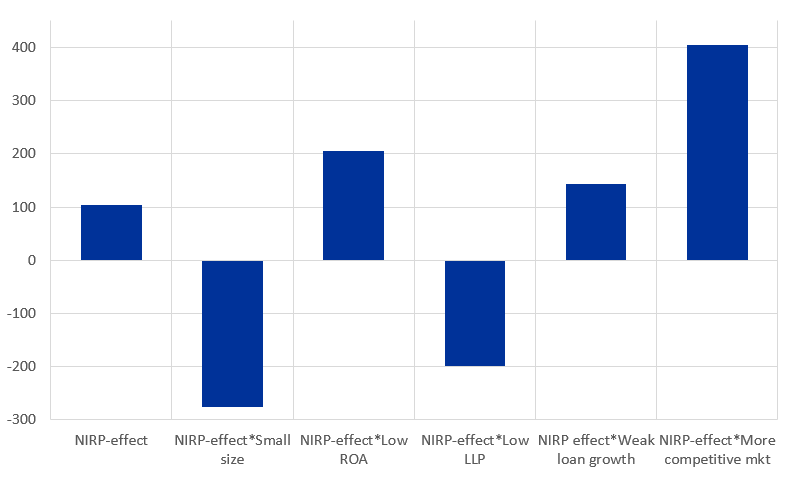
Sources: ECB calculations based on BankFocus data. Note: This table shows the estimated impacts of the introduction of the NIRP on the estimated bank cost efficiency score. To assess how bank specific features affect the relationship between the NIRP and the cost efficiency score, triple interactions between the NIRP effect and some bank specific features and the degree of competition prevailing in the banking sector where a bank is established before the introduction of the NIRP are added to the baseline model once at a time. All estimated models include bank and macroeconomic controls. The included bank controls are the ratio of gross loans-to-total assets, the logarithm of bank total assets, the ratio of net income-to-total assets, the total capital ratio, the ratio of interest income to operating income, the ratio of loan loss provisions-to-total loans. The included macroeconomic controls are real GDP growth and inflation. All estimated models also include bank and time fixed effects. Robust standard errors are clustered at bank-level. *, **, *** indicate statistical significance of 10%, 5% and 1%, respectively.
These findings hold relevant implications for financial stability. By improving their cost efficiency, banks most affected by the NIRP were able to support their profitability and solvency (offsetting to some extent the pressure on their margins exerted by the negative interest rates) with beneficial effects for their soundness and, consequently, for the extension of credit. On the other hand, low deposit banks recorded a decline in their cost efficiency after the introduction of the NIRP. Therefore, going forward, these latter banks will need to invest more effort in improving their efficiency.
Data are sourced from BankFocus. The banks in the sample are established in 17 euro area countries. After removing institutions with unreliable or low-quality data, the resulting sample is unbalanced and includes up to 1947 banks.
Cost efficiency scores are estimated using Stochastic Frontier Analysis (SFA). In this context, the function used is a multi-product translog function. It is assumed that banks use funds (liabilities), labour and physical capital to produce loans and investments. To control for risk and technical change, the equity ratio and a time trend are included as semi fixed inputs.
A similar approach is also used in Huljak, I., Martin, R., Moccero, D. “Cost efficiency of euro area banks”, 2018, Box 6, ECB Financial Stability Review, May. See also Huljak, I., Martin, R., Moccero, D., “The productivity growth of euro area banks”, 2022, Journal of Productivity Analysis.
In this analysis, reliance on deposit funding is measured by retail deposit to total asset ratios. High (low)-deposit banks are those institutions with a retail deposit to total asset ratio above (below) the median value of the related distribution in the period before the introduction of the NIRP.
Heider, F., Saidi, F., Schepens, G., “Life below Zero: Bank Lending under Negative Policy Rates”, 2019, Review of Financial Studies.
In the DiD setting, the NIRP is the treatment and high (low)-deposit banks are the treatment (control) group. In the baseline setting, the variable which measures the NIRP-effect is defined as an interaction dummy Treated* Post; where Treated is a dummy variable that takes the value 1 if in 2013 (i.e. before NIRP) the ratio of deposits to total assets of bank was above the median, and 0 otherwise. Post is a dummy variable that assumes the value 1 after the introduction of NIRP, and 0 otherwise. The dependent variable is the estimated cost efficiency score.
Low-deposit banks recorded a decline in their cost efficiency after the introduction of the NIRP.