Disclaimer1
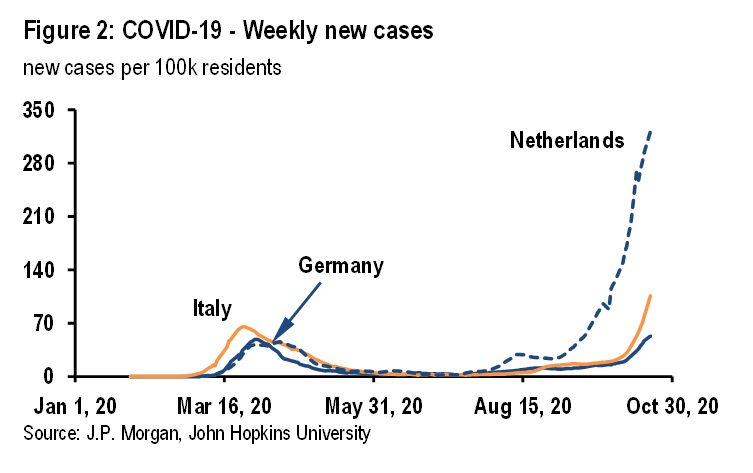
A number of Western European countries have seen a powerful second wave of COVID-19 infections in recent weeks, but not all have had the same experience. While in Spain, France, the Netherlands, and the UK new infections significantly exceed the peak in the first wave, increases in new infections in Germany and Italy have been much less dramatic (Figure 1).
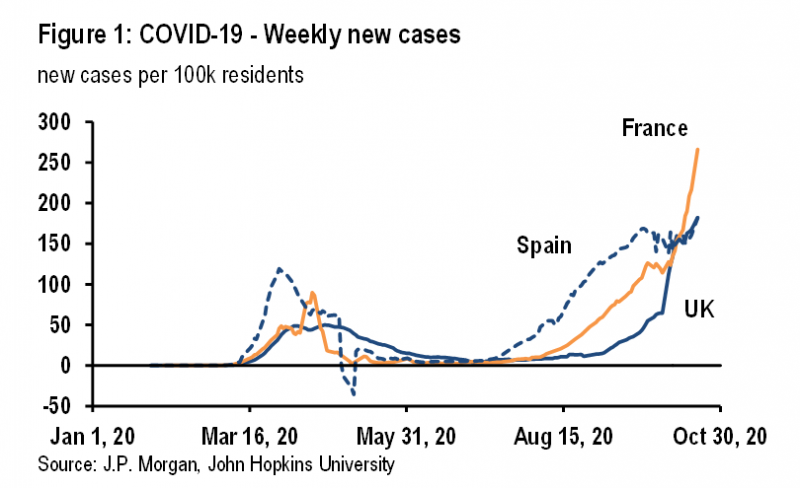
It is certainly possible that Germany and Italy simply lag other countries by two to three weeks. Given the exponential growth of new infections, the picture can change very quickly and notably infections have accelerated in both countries in recent days (Figure 2). But this note considers whether there are other reasons for these cross-country differences, which may help in managing new infections going forward.
Clearly, mobility across Western Europe recovered strongly over the summer as the first-wave lockdowns were eased. By the end of the summer, reproduction numbers had likely moved back above one. The increased mobility associated with the return of students to schools and universities likely put more upward pressure on reproduction numbers. Most likely, in our view, the difference between Germany and Italy, on the one hand, and France, Spain, the Netherlands and the UK, on the other, is not mobility but rather the breadth of mask wearing and the efficacy of test and trace regimes.
One way to try to gauge what explains these cross-country differences is to use a simple framework for understanding the effective reproduction number, which determines whether new infections rise, remain stable, or fall. Clearly, the strong rise in new infections in France, Spain, the Netherlands, and the UK suggests that the effective reproduction number has moved back well above one, after the spring lockdowns pushed it down to well below one. Meanwhile, the much smaller increases in new infections in Germany and Italy suggest that the effective reproduction number is only modestly above one.
Three things determine the reproduction number: the number of daily contacts between infectious individuals and susceptible individuals, the length of the infectious period in days, and the probability of infection given contact between an infectious individual and a susceptible individual. Measures introduced since the spring have sought to influence one or more of these determinants.
Stay at home orders, the closure of non-essential businesses, school and university closures, working from home, and travel restrictions are all attempts to reduce the number of daily contacts between infectious individuals and susceptible individuals. Test, trace, and quarantine regimes are an attempt to reduce the length of the infectious period and limit the number of daily contacts between infectious and susceptible individuals by removing infectious and potentially infectious individuals from the population. And wearing masks and increased hygiene are attempts to reduce the probability of infection given contact between infectious individuals and susceptible individuals. Differences in the pace of growth of new infections across countries reflect differences in one or more of these determinants of the effective reproduction number.
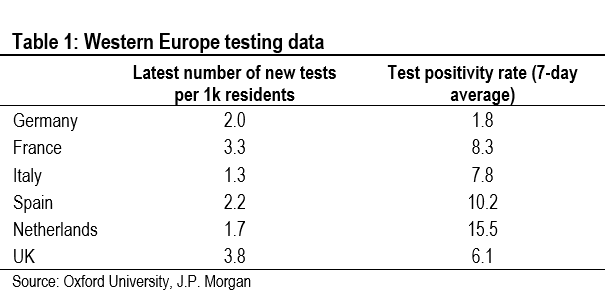
Estimating the current reproduction number, and making comparisons with the first wave, is made difficult by changes in the number of tests conducted. Early on in the pandemic, when testing was very constrained, the reproduction number estimated using the evolution of reported new infections was likely an underestimate, due to the large number of asymptomatic and mild cases that were not identified. Even today, with a much larger number of tests, many asymptomatic and mild cases likely still are being missed, although far fewer than in the spring.
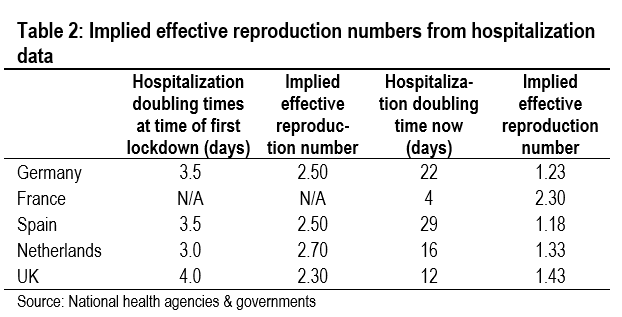
One way around this problem is to calculate an effective reproduction number using hospitalization data. Strictly speaking, this is not a true measure of the reproduction number. It can be thought of as the reproduction number for serious infections, rather than the reproduction number for all infections. But we can make a comparison over time to gauge changes in the seriousness of infections. This is what we do in Table 2, in which we compare doubling times of hospitalizations. These calculations suggest that the reproduction number in Germany is only just above one, while in France, the Netherlands, and the UK it is well above one (there are no data on new hospital admissions in Italy). Spain has a surprisingly low reproduction number, but these estimates are highly tentative due to the lag between tests, when new cases are identified, and hospitalizations.
We have used Apple and Google mobility data as proxies for the number of daily contacts between infectious and susceptible individuals. This worked well in the first wave when the 70% decline in the mobility data after lockdowns were imposed broadly matched the decline in the effective reproduction number. But after lockdowns eased, mobility rose strongly everywhere and the differences across countries are not sufficient to explain the differences in the effective reproduction number.
According to the Apple mobility data, the number of daily contacts across Europe has been above pre-COVID-19 levels in a number of countries in recent weeks. Thus, it is not surprising that second waves have occurred. But, what is striking is that the two countries that have thus far had the mildest second waves, Germany and Italy, have seen the largest increases in mobility. Meanwhile, in Spain, the Netherlands, and the UK, countries where infections have surged, the recovery in mobility has been much more moderate (Table 3).
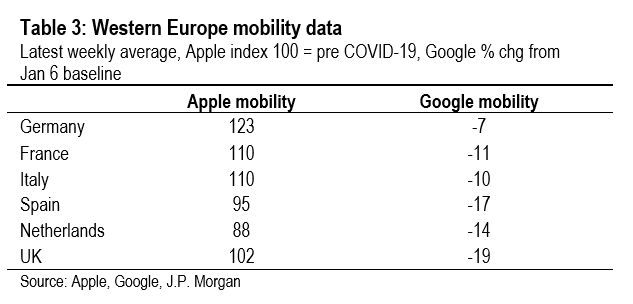
Meanwhile, according to the Google data, mobility has not yet recovered to pre-COVID-19 levels, but again the cross-country developments don’t help to explain developments of new infections across countries. The Google mobility data have recovered the least in Spain, the Netherlands, and the UK, three countries with particularly severe second waves.
Thus it doesn’t seem that differences in mobility—and hence daily contacts—can explain cross-country differences in the pace of new infections. This means that other determinants of the effective reproduction number are driving the cross-country experiences.
One possible explanation for the cross-country differences in new infections is the efficacy of the contact tracing regimes. The efficacy of such regimes is multidimensional and depends on the speed at which infectious people are identified, the number of their contacts that are traced quickly, and the compliance regarding isolation requirements. Unfortunately, there is very little data to gauge the efficacy of contact tracing regimes, but anecdotally the German system is viewed very favorably, while the UK system is perceived to be struggling. In fact, the UK government is the only European government that publishes data on the efficacy of the contact tracing regime, and its shortcomings can be illustrated easily.
According to Kucharski et al,2 in order to reduce the effective reproduction number from 2.6 to 0.9 using a contact tracing regime, for each 1,000 symptomatic individuals identified each day, 41,000 people need to be isolated. This includes the isolation of all of the identified symptomatic individuals and their households (1,900 individuals) and all of their 39,100 contacts (1,000 symptomatic individuals multiplied by 10 daily contacts multiplied by an infectious period of 3.9 days). Despite this very efficient system, which isolates 100% of symptomatic individuals and 100% of their contacts, the effective reproduction number is not pushed all the way down to zero because of the large number of asymptomatic individuals who are not identified but who can still pass on the virus.
The UK regime falls far short of this benchmark. In the first week of October, according to the NHS test and trace regime data, 89,874 individuals in England tested positive for COVID-19. Of these, 76,918 individuals were transferred to the contract tracing system. Of these, 59,073 individuals were contacted, who identified 216,627 close contacts. Of these, 135,609 individuals were contacted and asked to isolate. This is not a very good outcome. According to the Kucharski et al. model, 89,874 positive cases should lead to 3,684,834 individuals being isolated. In England, in the first week of October, only 225,483 individuals were asked to isolate (6% of the Kucharski et al. baseline). Assuming that everything is linear, the UK test and trace regime is only reducing the effective reproduction number by 0.1pt, compared to the reduction of 1.7pts in the Kucharski et al. baseline.
The efficacy of mask wearing has been intensely debated during this pandemic, but in our view differences in mask wearing across countries have the potential to explain cross-country differences in new infections.
Studies have shown that in a clinical setting, mask wearing has a huge impact on the transmission of COVID-19. In a study of the impact of universal mask wearing by both healthcare workers and patients in 12 hospitals in Massachusetts, Wang et al.3 discovered that a shift in policy toward universal mask wearing appeared to reduce the effective reproduction number from 2.67 to around 0.70. This is a huge impact.
In a community setting, mask wearing is unlikely to have such a dramatic effect on the effective reproduction number, but there are good reasons to think that wearing masks reduces transmission. Gandhi et al.4 argue that not only do masks reduce the probability of infection given contact between an infectious individual and a susceptible individual, but they also reduce the severity of COVID-19 in the individual that is infected. This is because the inoculum, or dose of the virus, is reduced by masks. The infectious individual emits less inoculum, and the susceptible individual inhales less inoculum.
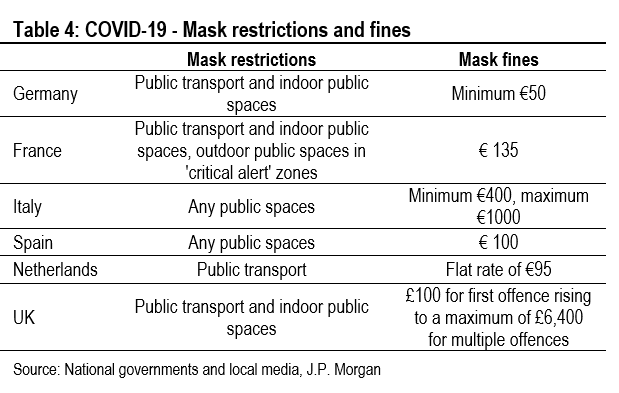
It is very difficult to do cross-country comparisons of the impact of mask wearing, because what matters is not only government requirements, but also compliance with those requirements. Table 4 summarizes government requirements for mask wearing across countries and fines for non-compliance. It seems likely that compliance will be higher in countries with greater financial consequences for non-compliance.
It is certainly the case that mask requirements and fines are the least onerous in the Netherlands, which has seen the most dramatic increase in new infections. Meanwhile, Italy has among the tightest requirements and the highest fines, and the second wave in Italy is much more moderate than in the Netherlands (Table 4). This certainly suggests that mask wearing may be part of the explanation for the cross-country differences in new infections across Europe.
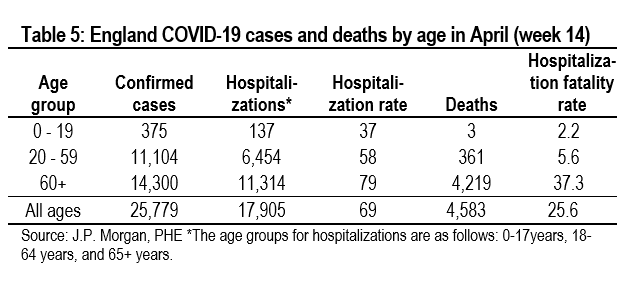
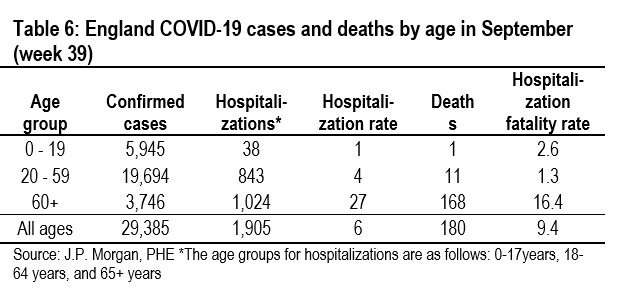
We can also try to gauge the impact on mask wearing by considering developments in the severity of infections, which can be gauged by looking at developments in hospitalization rates (new hospitalizations divided by new cases) and hospitalization fatality rates (new deaths divided by new hospitalizations) across age groups. Given that medical treatments have evolved in similar ways across countries, differences in these two metrics might indicate cross-country differences in the severity of illness, which can be linked to mask wearing.
Tables 5 and 6 show these data for England. Hospitalization rates and hospital fatality rates have both fallen significantly since the spring, which may indicate a decline in the seriousness of infections as well as reflecting an improvement in treatments. Unfortunately, these data are not available for Germany and Italy, which would be needed to indicate that the severity of COVID-19 is greater in the UK.
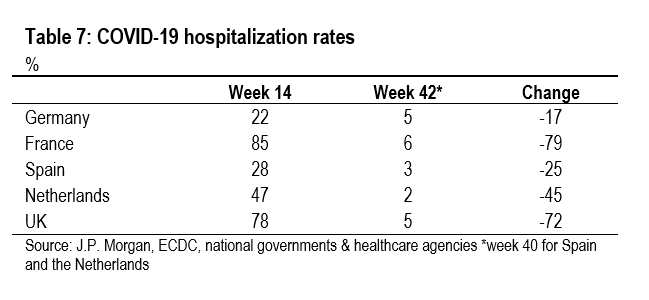
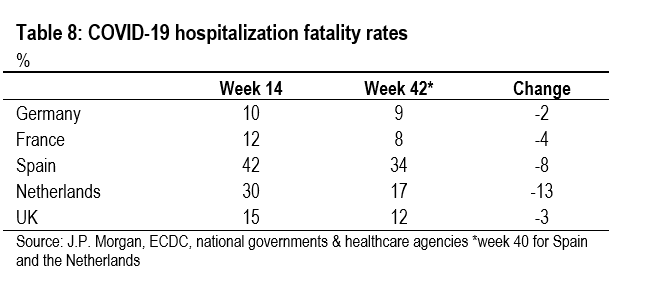
The best we can do is look at data for all age groups (Table 7 and 8). The evidence here is a bit inconclusive, perhaps partly due to lags and partly due to the huge shift in the age distribution of new cases in recent months. In any event, hospitalization rates remain very low everywhere and there is not much to choose between the five countries. Meanwhile, hospitalization fatality rates are much higher in Spain and the Netherlands, which suggests more severe infections, but are relatively low in France and the UK, which suggests milder infections. Unfortunately, shifts in the age distribution of new infections could explain these differences in hospitalization rates and hospitalization fatality rates.
It is not possible to clearly demonstrate that differences in test and trace regimes and mask wearing can explain the country differences in Western Europe’s second COVID-19 wave, but some of the evidence is suggestive. But, more importantly, if mobility does not explain cross-country differences, then one or more of the other drivers of the effective reproduction number must be the reason.
Courtesy J.P. Morgan Chase & Co, Copyright 2020.
Disclaimer: This SUERF policy brief includes research content published by J.P. Morgan on 22 October 2020. J.P. Morgan has granted SUERF a limited right to re-publish this research on an information only basis. J.P. Morgan has no liability in any regard for the publication of this SUERF policy brief or SUERF’s decision to reproduce any J.P. Morgan research content contained herein. It is not an offer to buy or sell any security/instruments or to participate in a trading strategy or trading activity; nor does it constitute any form of personal financial advice or investment recommendation by J.P. Morgan. This information should not be relied upon for any reason whatsoever by any natural or legal person. For important current standard disclosures that pertain to J.P. Morgan’s research please refer to J.P. Morgan’s disclosure website: https://www.jpmm.com/research/disclosures
Kucharski et al. Effectiveness of isolation, testing, contact tracing and physical distancing on reducing transmission of SAR-CoV-2 in different settings: a mathematical modelling study, The Lancet June 16th 2020.
Association between universal masking in a healthcare system and SARS-CoV-2 positivity among healthcare workers, Wang et al. 2020.
Masks do more than protect others during COVID-19: reducing the inoculum of SARS-CoV-2 protect the wearer, Gandhi et al. 2020.