To be able to make timely and precise policy recommendations, it is important to gauge activity in the economy in real time, and to be able to update the belief of the current state of the economy in terms of an estimate of real activity as soon as new information hits the economy. This has especially been the case during the covid-19 crisis, where uncertainty about the impact of the pandemic has been elevated and where the demand for monitoring the effects on the economy has increased continuously as the pandemic and lockdowns rolled on. In this policy brief, I explain how we at Danmarks Nationalbank addressed these issues.
For the purpose of monitoring the impact of the covid-19 crisis on the Danish economy, a dynamic non-linear Markov-switching factor model for the Danish economy was set up. The main part of the model is based on a model developed in a working group under the ECB, with the participation of Danmarks Nationalbank (Leiva-Leon et al (2020)). While the model for the Danish economy is explained in detail in Pedersen (2021), Leiva-Leon et al (2020) provides a full overview and a mathematical appendix of the estimation procedure, and the interested reader is highly encouraged to look there for more detail.
The idea behind the model is to capture comovements in economic variables and real activity in one factor, which can be thought of as approximating GDP. The average growth rate is subject to regime switching. Hence, based on data, the model estimates a probability of the economy being in a low-growth or high-growth regime. This variation in the mean enhances the ability of the model to forecast and enables it to provide a statement of the state of the economy in terms of probabilities.
Additionally, to better capture the depth of recessions, an extra term is added to the factor: When the economy resides in a high-growth state, this term does not affect the factor, while in a recession an extra figure is drawn capturing the depth of the crisis. Hence, all normal episodes share the same mean of factor, while each recession episode involves a different mean. The interpretation is that all expansions are the same, while all recessions are different.1 Without this term, the model would have had a hard time capturing less severe recessions: The model would attribute the financial crisis and the covid-19 crisis only to be a recession; the rest of the recessions in the Danish economy would be small blips compared to the financial crisis and less severe, and future recessions would not be captured by the model.2 Against this background, something needs to inform the model that the financial crisis and the covid-19 crisis were especially severe and unusual; this is what the extra term does.
The model can be estimated using mixed frequency data, allowing for the inclusion of both quarterly and monthly data. Further, the model can be updated as new information comes through. That is, with a ragged edge to the data set. This means that an estimate of real activity can be calculated using only the part of the data set which has been announced at the relevant point in time, and the user does not need to wait until a full, balanced data set is available.
The model includes six variables – quarterly GDP and five monthly variables – imports, exports, industrial expectations, unemployment and a business sentiment indicator for services, and it is estimated on data going back to 2000. The main idea is to mimic the way quarterly GDP is constructed by including data from the production side and the demand side (Stock and Watson (1991 and 2016)). In doing so, the model should in principle be able to capture all types of recessions: If there is a recession, it will be reflected in these variables. The model cannot handle much larger data sets due to the non-linearities inherent in the model.
The model provides at a monthly frequency both a statement about the probability of the Danish economy being in a recession and an estimate of the growth rate, the nowcast. Further, the model provides a measure of the uncertainty surrounding such a nowcast. These distributions are depicted in the figure below.
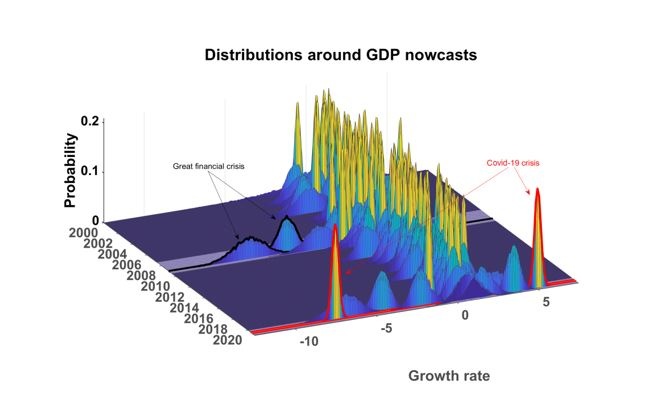
The density is a mixture of two normal distributions weighted by the estimated probabilities of the growth rate being in a ’low’-growth regime or a ’high’-growth regime. In the sample and outside periods of crisis, the estimated distributions are close to following a normal distribution. However, during periods of recessions, kurtosis and skewness increase markedly. This means that the probability of large growth downfalls is higher than large positive growth numbers. Movements in the shape of the distributions are thus clearly related to large crises. On average, the uncertainty around the GDP nowcasts is smaller in months in which the model observes GDP, reflecting its importance for the developments in the real activity factor.
During the current covid-19 crisis (highlighted in red in the figure), the model at first points to great uncertainty about GDP growth, while one month later the distribution is significantly tighter, reflecting the greater certainty about low activity of around -7 per cent compared to the previous quarter. This, however, cannot be observed during the financial crisis (highlighted in black in the figure). Here, the uncertainty surrounding the depth of the crisis was larger, although the mean of the distribution is comparable to the mean of the distribution during the covid-19 crisis (highlighted in red in the figure). As a result, the model pointed to relatively low uncertainty about the state of the Danish economy during some months of the covid-19 crisis – according to the model, real activity in the economy was certain to fall considerably and then rebound. During the financial crisis, the model found that activity would be low, which was reflected in a sharp downward shift in the distribution of GDP growth, but compared to the covid-19 crisis the model pointed to relatively higher uncertainty about exactly how low the activity would be.
The main focus for nowcasting is to be able to capture real economic activity in real time. That is, how would the model have performed historically given the information that was available in the past? By a technical recession is meant two consecutive quarters of negative growth. To analyse the model’s real-time properties, the model is estimated up until June 2005 and then recursively evaluated out-of-sample adding one month of data at a time. The real-time recession probabilities are shown together with the probabilities estimated using the full sample in the figure below.
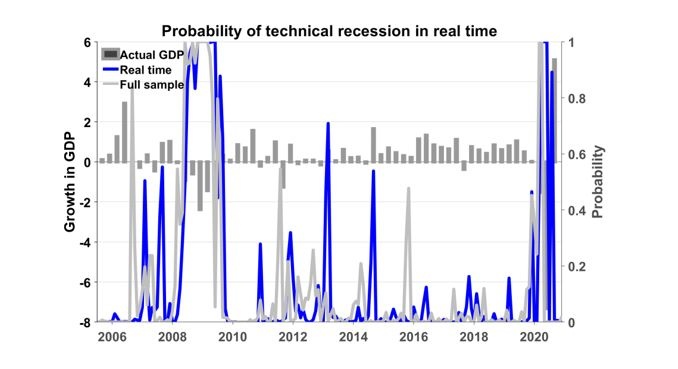
Note: This figure shows the probability of a technical recession in real time. The grey line depicts the respective probabilities estimated using information from the full sample shown. The blue line represents the real-time probabilities. The columns denote actual revised GDP growth from Statistics Denmark.
The probabilities of a technical recession confirm prior knowledge about the history of the Danish business cycle pointing to recessions where the Danish economy was in a recession. The recession probabilities estimated in real time are quite close to their full-sample counterpart, and they are not much more volatile. When the economy was in recession, like during the great financial crisis, the model does provide a clear signal in real time that something bad is going to happen. Hence, the probability of a recession estimated in real time gives a robust and clear signal about the state of the economy.
The model has been used in supporting the overall monitoring of the Danish economy – but modelling during covid-19 is hard as empirical relationships broke down
The model has been in use almost throughout 2020 providing valuable inputs to the surveillance of the Danish economy. However, I quickly found out that caution is needed in using the model during the unprecedented events surrounding the covid-19 crisis. And the model comes with one disadvantage related to the covid-19 period.
Output from the model must necessarily be combined with what users of the model also know about the state of the economy, and this has especially been so during the covid-19 crisis due to a breakdown of empirical relationships, primarily between output and unemployment and the role played by the K-shaped recovery. In Denmark, as part of a rescue package, many workers were furloughed. This means that they did not figure in the official unemployment figures. As an example, around 250,000 workers were furloughed during April 2020, while unemployment only had increased by 55,000 persons since the first lockdown in the Danish economy, which began in March 2020. Such a large discrepancy between official unemployment and shadow unemployment has distorted the relationship between output and unemployment, causing the model to underestimate the downturn. The economy experienced recoveries in some sectors, primarily in industry, while activity in the service sectors, primarily restaurants and the retail sector, has been hard hit throughout the pandemic. This has been hard to capture using the rather small set of indicators. When lockdowns were announced, it was clear that a turning point had been reached, emphasising communication output from the model both to policymakers and to the wider public. Clearly, the model cannot detect a turning point before this is reflected in data.
Danmarks Nationalbank has been using a suite of models to monitor the real-time developments of the economy during the covid-19 crisis
The main disadvantage of the model during the covid-19 crisis has been the inability of the model to handle big data, including soft indicators. This is because the regime-switching setting only allows for a relatively small set of indicators. While widely believed not to be an issue during periods outside the covid-19 crisis, the pandemic-driven events demanded, if not daily, weekly monitoring of the economy. And further, the use of soft data sources, like crossings of the large bridges in Denmark, credit card transactions, passengers in the main airports, was in great demand during the covid-19 crisis as these indicators can capture the degree of the lockdown almost on a daily basis, especially in terms of measuring mobility during lockdowns.
There are other approaches to detecting turning points or growth in real time. One approach is the approach taken in another real-time nowcasting model for the Danish economy developed during the covid-19 crisis (Schmith and Grenestam (2021)). This model builds on the Federal Reserve Bank of New York’s nowcasting model (Bok et al (2017)) and (Banbura, Giannone and Reichlin (2010)). This approach builds on a much richer data set, the idea being to include as much information as possible on different frequencies. This approach has its pros and cons relative to the framework set up in this study. The richer data set allows the model to be reestimated more frequently, and the model can utilise the large information set available. However, this also makes the model difficult to extend to a non-linear setup. The model is thus neither able to provide probability statements about growth nor can the model framework provide density forecasts and thus estimates of uncertainty of the current state of the economy. These relative strengths of the two approaches to estimating nowcasts for the Danish economy have led Danmarks Nationalbank to apply both methods in the process of monitoring the Danish economy.
Danmarks Nationalbank publishes nowcasts each week
From June 2020, the estimated distribution of future GDP growth and corresponding nowcasts estimated using both models were published on Danmarks Nationalbank’s website.3 These real-time nowcasts using data available during each week can be seen in the figure below. There were at times sizeable discrepancies between the two models’ nowcasts during summer 2020. But outside this period, the models give quite similar answers to the main issue models for nowcasting need to address: Performing an estimate of real activity.
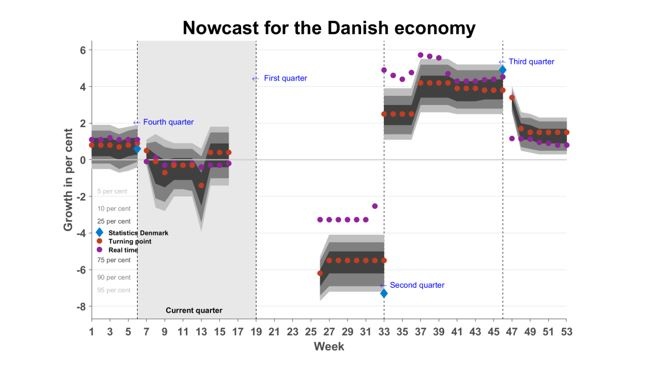
Note: This figure shows the published nowcasts from the non-linear factor model with regime-switching means with distributions from the model (denoted by ’Turning point’ in the figure), and nowcasts produced by the linear factor model for the Danish economy (Schmith and Grenestam (2021)) (denoted by ’Real time’ in the figure). The figure also shows GDP growth rates published by Statistics Denmark in blue.
The plan for the future is to continue to publish output from the models, while the economists at Danmarks Nationalbank continuously learn about the strengths and weaknesses of the model and continue to update and improve them. As an example, to take care of furlough workers distorting the empirical relationship between unemployment and GDP, the regime-switching factor model might be extended with employment.
Banbura, M., D. Giannone and L. Reichlin (2010): “Large Bayesian vector auto regressions”, Journal of Applied Econometrics 25(1), 71–92.
Bok, B., D. Caratelli, D. Giannone, A. Sbordone and A. Tambalotti (2017): “Macroeconomic Nowcasting and Forecasting with Big Data”, Federal Reserve Bank of New York, Staff Report No. 830.
Leiva-Leon, D., G. Perez-Quiros and E. Rots (2020): “Real-time weakness of the global economy: a first assessment of the coronavirus crisis”, European Central Bank Working Paper No 2381.
Schmith, A. M. B. and E. Grenestam (2021): “Nowcasting Danish GDP using real-time indicators”, Economic Memo, Danmarks Nationalbank.
Stock, J. H. and M. W. Watson (1991): “A Probability Model of the Coincident Economic Indicators”, in “The Leading Economic Indicators: New Approaches and Forecasting Records”, K. Lahiri and G. Moore, eds.
Stock, J. H. and M. W. Watson (2016): “Dynamic Factor Models, Factor-Augmented Vector Autoregressions, and Structural Vector Autoregressions in Macroeconomics”, in Handbook of Macroeconomics, Volume 2A,.
At the time of writing, the nowcasts and the historical nowcasts can be found at https://www.nationalbanken.dk/en/knowledge_bank/themes/Pages/Nowcast-models.aspx.