This Policy Brief is based on De Nederlandsche Bank Working Paper No. 808. Views expressed are those of the authors and do not necessarily reflect official positions of De Nederlandsche Bank.
We construct a leading indicator for turning points in the core inflation cycle of the euro area. The selection of variables in the indicator is based on turning point matching and dynamic correlation. The indicator predicts a turning point in the core inflation cycle on average seven months ahead. Since the pandemic the cycle of core inflation, as reflected in the indicator, has mainly been driven by external factors.
The increased uncertainty about inflation dynamics since the Covid-19 pandemic has raised questions about the use of model forecasts for inflation (Lagarde, 2023). The recent large and unprecedented shocks and shifts in economic relationships have reduced the trust in models, which are usually based on past regularities. In this environment, central banks have adopted a data-dependent approach for their interest rate decisions. This approach is helped by variables that embed forward looking information about inflation. Such information can be combined in a composite leading indicator (CLI), which includes variables with leading properties regarding a reference series.
CLIs are a common metric in business cycle analyses – with GDP growth being the reference series – as for instance used by the OECD (Gyomai and Guidetti, 2012). Such CLIs are used to predict switches between expansion and recession phases of the economy up to several months ahead. CLIs for inflation are less common. De Bondt et al. (2021) develop a CLI for inflation in the euro area. Since CLIs are mainly used to predict turning points in the cycle of the reference series and not to forecast GDP growth or inflation, they complement forecasting models. Moreover, CLIs are non-parametric in the sense that they do not rely on an estimated model, which is advantageous in an environment of elevated uncertainty.
In Hoeberichts and van den End (2024) we extend the approach of De Bondt et al. in several ways. First, we select the indicator variables in the CLI based on their predictive power for the turning points in the inflation cycle. Second, we focus on annualised 3-month-on-3-month (3m-3m) core inflation, which ensures a faster detection of turning points than year-on-year (y-o-y) inflation. Third, we use rebalanced weights for the construction of the CLI instead of equal weights to downplay the influence in the CLI of variables that are mutually correlated.
We extract the cycles of core inflation and the indicator variables by a band-pass filter. The cycles are then standardised. Subsequently we identify the turning points in the cycles by the Bry-Boschan (1971) algorithm. Within our sample period 2002m1 and 2023m11 the algorithm dates 12 turning points in the euro area core inflation cycle (Figure 1). On average, the turning points are detected 4 months earlier for the cycle based on 3m-3m inflation compared to y-o-y inflation.
Figure 1: Turning points in the core inflation cycle of the euro area
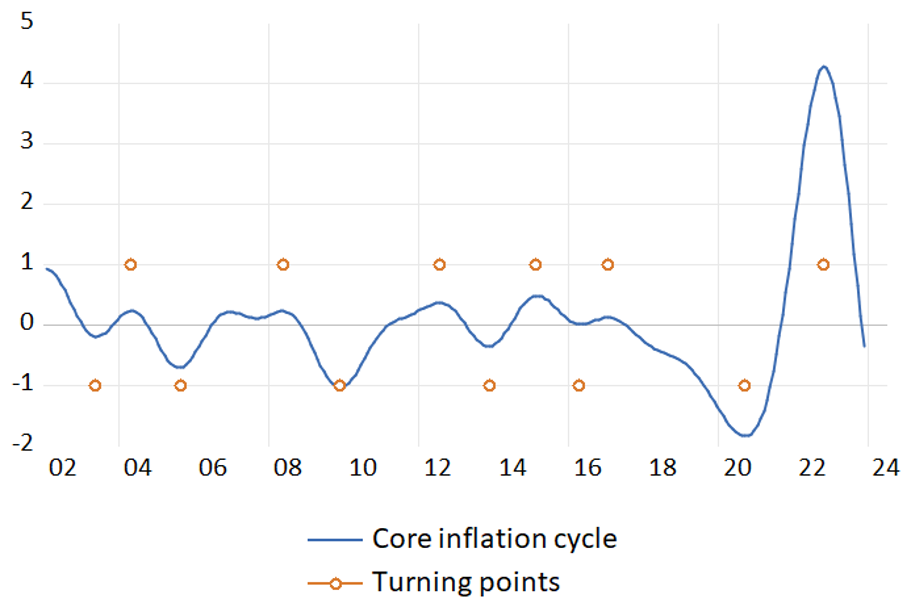
Note: core inflation cycle and cyclical turning points (dots). Based on 3m-3m inflation and standardised cycles.
To include variables with leading properties in the CLI we apply two selection criteria. First, we impose that at least 60% of all turning points in the core inflation cycle should be preceded by a turning point in the cycle of the indicator variable, with a minimum (maximum) average lead time of 6 (18) months. This is the turning point matching criterium. Second, we apply a correlation criterium, by imposing that the absolute correlation between the core inflation cycle and lags of the indicator variable is at least 0.5, with a similar lead time as the matching criterium. It appears that 4 out of 34 variables that we tested meet both criteria: i.c. OECD headline inflation, house prices, CPI energy prices and commodity prices of non-energy items. It means that the turning points in the cycle of these variables precede the turning points in the core inflation cycle in more than 60% of the cases, while the cross-correlation is at least 0.5. Financial variables, such as interest rates and monetary aggregates, do not meet the selection criteria. After the variable selection, the CLI is constructed by rebalancing the variable weights to take into account the mutual correlation of the variables. This results in relatively low weights for the energy and commodity variables.
Figure 2 presents the CLI based on the four selected variables, of which the lags that have the highest correlation with the core inflation cycle are included. The lead time of the CLI is 7 months, In other words, the CLI predicts a turning point in the core inflation cycle 7 months ahead. The CLI tracks the effects of the pandemic and the Ukraine war on the core inflation cycle well. In the pandemic the troughs in the core inflation cycle and the CLI were almost synchronized, while the CLI peaked in tandem with the inflation cycle in 2022. Since Autumn 2023, core inflation has fallen below the trend component (i.c. below the horizontal axis).
Figure 2: Composite indicator CLI and cycle of core inflation (euro area)
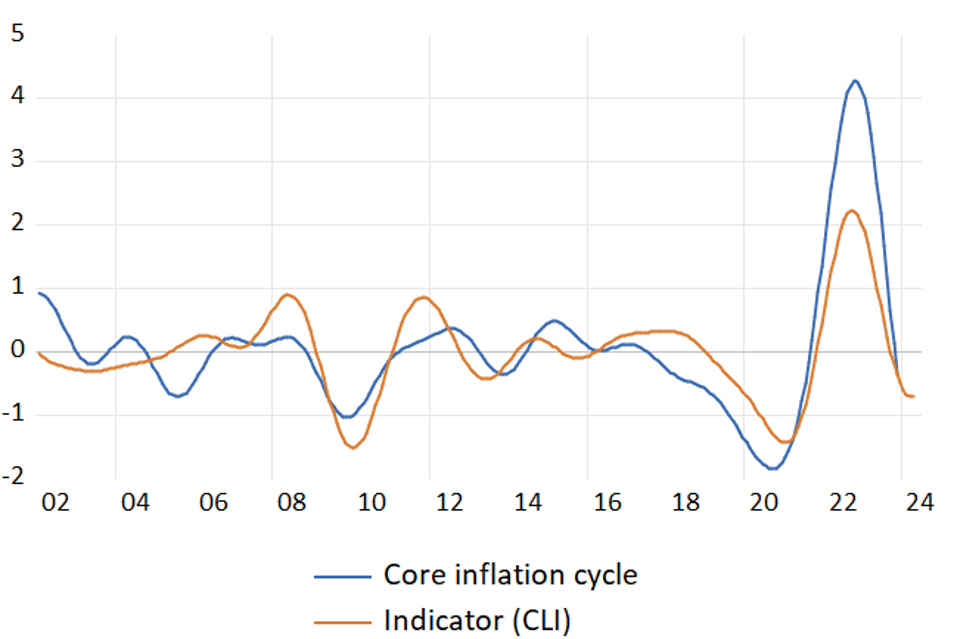
Note: core inflation cycle based on 3m-3m core inflation. Indicator (CLI) based on four variables and rebalanced weights. Inflation cycle and indicator are both standardised. Percentage on y-axis; years on x-axis.
Furthermore, we classify the 34 potential indicator variables in six groups that cover different economic categories (like external conditions and the business cycle). We then decompose the CLI by the ontribution of the first principal component of each group. The decomposition displays the relative change across time of the contribution of each driver to the core inflation cycle. Figure 3 shows that the business cycle component was most dominant in the aftermath of the global financial crisis (2008-2012), while the external conditions were a relatively important driver during the Covid-19 pandemic and the Ukraine war. It suggests that the effects of these shocks on the core inflation cycle were to a relatively large extent related to global conditions. Since commodity prices were strongly correlated with these conditions, the weight of this group in the CLI has been reduced by the rebalancing procedure.
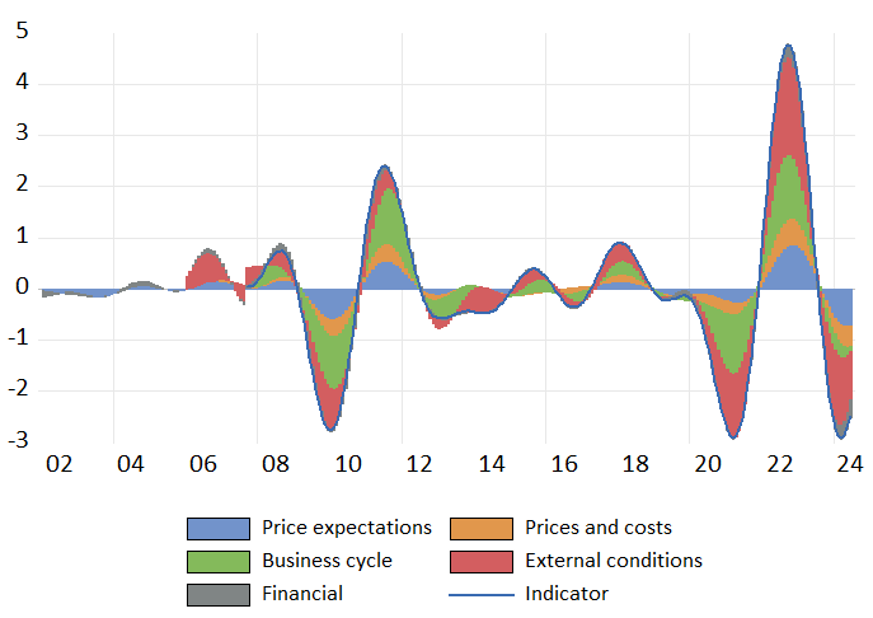
Note: decomposition of (standardised) indicator (CLI) based on principal component approach. Based on 3m-3m core inflation and rebalanced weights. Percentage on y-axis; years on x-axis.
By predicting turning points in the core inflation cycle, the CLI complements structural macroeconomic and time series models that are commonly used to forecast inflation. Since such forecasting models tend to be less accurate at cyclical turning points, the information produced by the CLI particularly adds value to forecasts made at inflection points of the inflation cycle.
An, Z, J. T. Jalles and P. Loungani (2018), How well do economists forecast recessions?, International Finance, 21 (2), 100-121.
Bry, G. and C. Boschan (1971), Cyclical analysis of time series: selected procedures and computer programs, New York, NBER.
De Bondt, G. J., E. Hahn and Z. Zekaite (2021), ALICE: Composite leading indicators for euro area inflation cycles, International Journal of Forecasting, 37(2), 687-707.
ECB (2016), A guide to the Eurosystem/ECB staff macroeconomic projection exercises.
Gyomai, G. and E. Guidetti (2012), OECD system of composite leading indicators, Methodology guideline.
Hoeberichts, M. and J. W. van den End (2024), Detecting turning points in the inflation cycle, DNB working paper, 808.
Lagarde, C. (2023), Policymaking in an age of shifts and breaks, Speech delivered at the Jackson Hole conference, 25 August 2023.