menu
close

Author(s):

Alena Bachleitner | Austrian Fiscal Advisory Council
Doris Prammer | Oesterreichische Nationalbank

Keywords:

Government Debt , Debt Forecast Error , Forecast Evaluation , Fiscal Rules

JEL Codes:

H60 , H63 , H68

The ongoing revision of the EU economic governance framework proposes public debt-to-GDP projections as the central fiscal anchor. It is, therefore, crucial to gain a deeper understanding of their reliability and the reasons for deviations from the forecasts. In this policy brief (based on Office of the Austrian Fiscal Advisory Council Working Paper No. 9/2023), we highlight some of the issues involved in setting up a new governance framework based on projected debt developments, drawing on past experience: There are significant errors in governments’ debt projections for European Union member states. Debt growth is systematically underestimated, especially for highly indebted countries and over longer projection horizons. The main drivers of the debt forecast errors appear to lie partly outside the direct control of governments: Wrongly projected GDP developments and stock flow adjustments – a factor that has been neglected in the literature so far. Moreover, the European Commission’s debt-to-GDP forecasts are as biased as those of governments, which limits their usefulness as the proposed benchmark.

Introduction

Since the setup of the European Monetary Union, public deficit, not debt, has been the focus of EU fiscal rules. This is about to be changed in the revised fiscal government framework. The European Commission has proposed to use debt forecasts of governments or the European Commission as a fiscal anchor deriving operational fiscal rules from debt-to-GDP projections (European Commission, 2022). Given this focus on debt forecasts, it is crucial to have a deeper understanding of the reliability of both governments and the European Commission’s debt forecasts and reasons for deviations. In line with the deficit focus of fiscal rules, EU deficit forecast errors have been extensively studied (e.g. (Frankel (2011); Larch et al. (2021); Beetsma et al. (2022)), while there is limited research on debt forecast errors covering multiple countries (exception: Estefania Flores et al. (2021) for IMF forecasts). Both strands signal a positive forecast error which is more pronounced in the long-term and due to overoptimistic growth forecasts.

Data and Methodology

To assess the reliability of government forecasts in the EU, we construct a new dataset based on the stability and convergence programmes of the EU Member States (excluding Greece and Ireland) from 2000 to 2021. These programmes contain information on fiscal and macroeconomic variables for last-year values, current-year values, and projections for at least the next three years. The European Commission’s spring forecast provided in the AMECO database is used to analyze the Commission’s forecast error. This forecast is however, restricted to the nowcast (T) and next year forecast (T+1). Following the literature, we calculate the debt forecast error by taking the difference between the realized debt-to-GDP ratio and the forecast debt-to-GDP ratio, based on first release data. A positive forecast error indicates that realised debt was higher than forecast, i.e. that the debt projection was overly optimistic.

Results

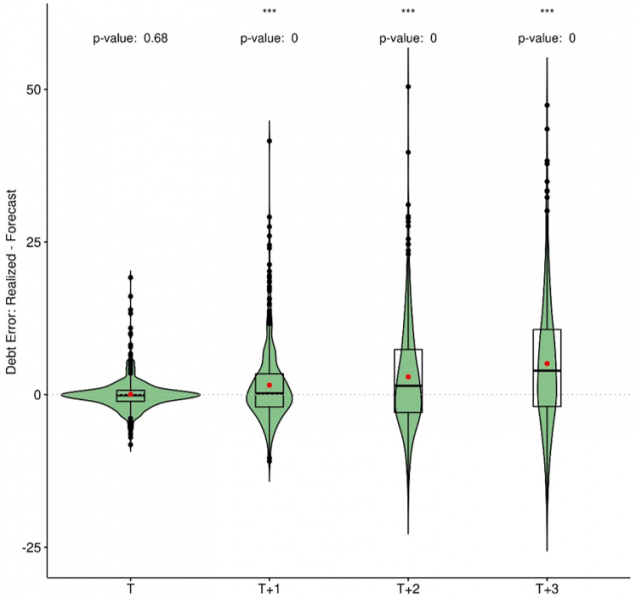
Figure 1 displays the average EU debt-to-GDP forecast error for different forecast horizons. While the majority of debt now-casts is still quite precise, the forecast error becomes significantly positive from horizon T + 1. The longer the projection horizon, the more optimistic but also the more dispersed the debt projections are. Analysing the stability or convergence programmes show that member states project on average a worsening in the debt-to-GDP ratio in the short-term but plan a strong improvement by the end of the projection horizon. However, the observed direction of change runs opposite: the realised average debt-to-GDP ratio shows a continuous increase over the forecast horizon. Hence, not only the level of the debt ratio was wrongly forecast, but also its direction of change. High debt countries (Belgium, Italy, France and Portugal)1 tend to backload the debt reduction even more. From T+1 onwards, they expect an ever-increasing speed of reduction of their debt ratios the further the projection horizon reaches out, reaching a 3.5 percentage point lower debt ratio after 3 years. However, the observed data show a steady increase in the debt ratio, which after three years is on average more than 6 percentage points higher.

Figure 1: Debt-to-GDP Forecast Error for Different Forecast Horizons
 width=

Note: The mean is represented by the red dot, the median is the black line in the box and the ends of the box indicate the first, and the third quartile, respectively.
P-values and significance levels refer to H0: µ= 0; *… 10%, **… 5%,***…1% significance.

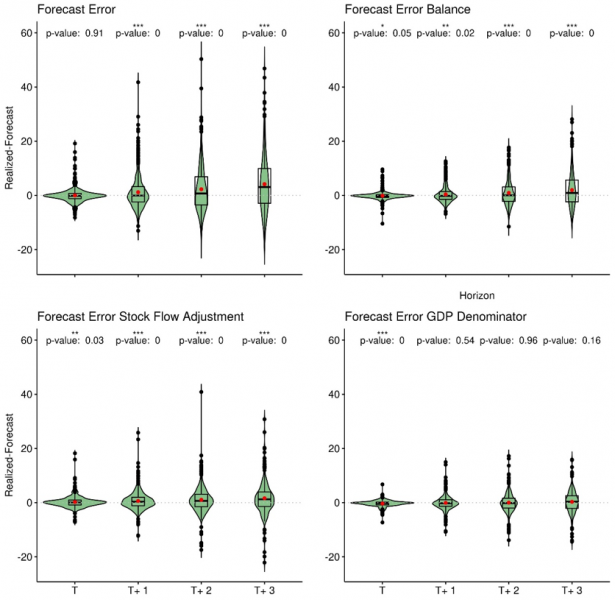
To identify the main drivers of the debt-to-GDP forecast error, we disentangle the error into its components. We use the standard accounting decomposition for the debt dynamics2 and augment it by the stock-flow adjustment (SFA). While stock flow adjustments are an important source of debt increases (e.g. Afonso and Jalles (2020)), they have been disregarded when assessing the forecast error so far.

Figure 2 shows that both fiscal deficit and stock-flow adjustment errors have contributed significantly to the positive forecast error for debt projections. Their role increases with the length of the forecast horizon as the deficit and stock-flow errors accumulate, indicating that slippages in one year are not compensated in future years. At the end of the forecast horizon, the deficit error explains almost half of the debt error; the remaining error is largely explained by the error in the stock-flow adjustment projections. In this augmented decomposition, the GDP denominator effect on the debt ratio plays only a minor role and stays insignificant, even at the end of the forecast horizon.

Figure 2: Standard SF-augmented Decomposition of the Debt-to-GDP Forecast Error
 width=
Note: The mean is represented by the red dot, the median is the black line in the box and the ends of the box indicate the first, and the third quartile, respectively.
P-values and significance levels refer to H0: µ= 0; *… 10%, **… 5%,***…1% significance.

However, the deficit forecast error, which plays an important role for the debt error according to the standard accounting decomposition, is itself partly driven by incorrect GDP forecasts. Therefore, we disentangle the deficit forecast error further into a “growth component” and a non-cyclical deficit error, using the European Commission’s standard cyclical adjustment method (Mourre et al, 2019). The part of the debt forecast error, which is (indirectly) due to a GDP forecast error, is now the second largest error term. It is about as large as the stock-flow adjustment error, while the cyclically adjusted deficit forecast error loses relevance (table 1). This contrasts with results from the earlier literature, which assigns almost the same weight to the growth and the deficit forecast errors (Estefania Flores et al. (2021)). However, this literature neglects the GDP forecast error implicit in the deficit forecast error and the stock-flow error term. Only for countries with high debt levels does the cyclically adjusted deficit error remain significant as the second largest driver of debt developments.

Table 1
 width=

Note: FE … Forecast Error, FE_Bt-1 … Forecast Error Debt T-1, FE SFA … Forecast Stock Flow Adjustment; H0: µ= 0;n.s. … not significant *… 10%, **… 5%,***…1% significance.

Since the European Commission’s debt forecast will serve as the benchmark for the development of the debt path of EU member states (European Commission, 2022), we also assess its forecasts, which are, however, restricted to T and T+1. In line with governments, the debt forecast is unbiased only for horizon T, while it gets significantly positive and dispersed already in T + 1. Stock flow adjustment errors and overly optimistic growth assumptions are the main sources of debt errors. For high debt countries stock-flow and growth induced errors are even larger and highly significant, resulting in a higher debt-forecast error than for governments.

Summary and Discussion

We observe projected public debt developments that are only realistic in the short term, in particular for the years covered by the budget laws. In the longer term, however, they are overly optimistic. This suggests that the consolidation itself is being postponed to later years, which are generally part of less binding medium-term budgetary rules. This wishful thinking is even more pronounced in high debt countries. It therefore appears that the level of a country’s debt has an impact on the quality of the projection and, more generally, on the commitment to reduce the debt ratio.

The decomposition of the debt forecast error into its components and its comparison with the European Commission forecast shows to what extent a government can be seen as responsible for the error. We consider forecasting errors in the cyclically adjusted primary balance as fully attributable to government action or inaction. In contrast, we argue that a government is only partly responsible for errors due to incorrect growth forecasts: The growth forecasts in the stability and convergence programmes are either provided by independent (economic) institutions or the government’s growth forecasts have to be approved by independent fiscal institutions.3 The source of errors in the stock-flow adjustment is more ambiguous as it can be used to hide undesirable deficit developments or might be due to unanticipated debt, such as bank nationalization during the Great Financial Crisis.

If the historical forecast errors were mainly due to unrealistic forecasts by the governments, then an independent institution, such as the European Commission, should have more accurate and unbiased forecasts. However, both governments and the European Commission make similar forecasting errors, which are to a similar extent due to stock-flow adjustment errors and growth-related errors. Moreover, the European Commission struggles even more than high debt governments to forecast debt developments for these countries. This suggests that it is not the government intention but the high uncertainty of debt forecasts that is the main problem. It is therefore unclear to what extent a government can be held accountable for deviating from a given debt path and how the European Commission’s debt forecasts can serve as a benchmark. Moreover, the reliability of the debt forecast as a fiscal anchor, as currently proposed in the Economic Governance Review proposal (European Commission (2022)), is questionable.

References

Afonso, A. and J. T. Jalles (2020). Stock flow adjustments in sovereign debt dynamics: The role of fiscal frameworks. International Review of Economics & Finance 65, 1–16.

Bachleitner, A. and D. Prammer (2023). Don’t blame the government!? An assessment of debt forecast errors with a view to the Economic Governance Review. Working Paper 9, March 2023, Office of the Fiscal Advisory Council

Beetsma, R. M., M. Busse, L. Germinetti, M. Giuliodori, and M. Larch (2022). Is the road to hell paved with good intentions? an empirical analysis of budgetary follow-up in the EU.

Estefania Flores, J., D. Furceri, S. Kothari, and J. D. Ostry (2021). Worse than you think: Public debt forecast errors in advanced and developing economies.

European Commission (2022). Communication from the commission to the European parliament, the council, the European central bank, the European economic and social committee and the committee of the regions, communication on orientations for a reform of the EU economic governance framework. European Commission, COM(2022) 583 final.

Frankel, J. (2011). Over-optimism in forecasts by official budget agencies and its implications. Oxford Review of Economic Policy 27 (4), 536–562.

Larch, M., J. Malzubris, and M. Busse (2021). Optimism is bad for fiscal outcomes. SUERF Policy Briefs 234.

Mourre, G., A. Poissonnier, M. Lausegger, et al. (2019). The semi-elasticities underlying the cyclically adjusted budget balance: an update and further analysis. Technical report, Directorate General Economic and Finan- cial Affairs (DG ECFIN), European Commission.

  • 1.

    We refer to these countries as high debt countries, as their debt levels were very close to or above 60 percent of GDP over the entire observation period and above 90% over an extended period according to first release data.

  • 2.

    The standard accounting decomposition states that the debt at the end of year T is the sum of the debt at the end of year T-1, the budget balance and the denominator effect; later versions also include the stock-flow-adjustments.

  • 3.

    This holds for stability and convergence programmes submitted after the introduction of the Six-Pack in 2011.

About the authors

Alena Bachleitner

Alena Bachleitner is economist at the Office of the Austrian Fiscal Advisory Council and a PhD student at the University of Vienna at the Department of Economics. Her research interests focus on fiscal policy and policy evaluation.

Doris Prammer

Doris Prammer is a senior economist at the economic analysis division of the Austrian Central Bank. She holds a doctoral degree in economics from the Vienna University of Business and Economics. Her research interests focus on fiscal policy and inflation policy.

More on these topics

Tags: