We document a durable increase in the cross-sectoral dispersion of earnings expectations during the COVID-19 crisis. The rise in dispersion stands in sharp contrast with developments during the Global Financial Crisis, potentially related to the specific nature of the policy measures taken to avert a public health disaster. Indeed, an empirical analysis shows that the rise in dispersion can partially be explained by the tight lockdown measures, especially prior to the start of vaccinations. Going forward, the cross-sectoral dispersion in earnings expectations remains elevated, implying that analysts expect the effects of the crisis to be of a rather structural nature, in line with expectations of a “K-shaped” recovery.
The COVID-19-related lockdowns have taken their toll on business activity, especially for firms whose business models are relatively dependent on free mobility. By contrast, others may have benefitted from the behavioral restrictions, in part because the related social distancing sped up societal developments that otherwise would likely have taken place only gradually. Is the heterogenous impact of the COVID-19 crisis long-lasting? We address this question by investigating forward-looking data on analysts’ earnings per share (EPS) forecasts (Bats et al., 2021). These data reflect how financial analysts expect firms’ earnings to develop over time and thus provide a forward-looking indicator of the dispersion across sectors.
Compared with before the pandemic, expected earnings remain permanently subdued for sectors such as travel and tourism, while they have recovered rapidly for the technology, utilities and financial services (excl. banks) sectors (Chart 1). As a result, current earnings expectations are in line with what is called a “K-shaped” recovery across sectors (the decoupling of the recovery paths of the best and worst performing sectors visualize the two arms of the letter “K”).
Chart 1: Earnings expectations for the best and worst performing sectors (percent)
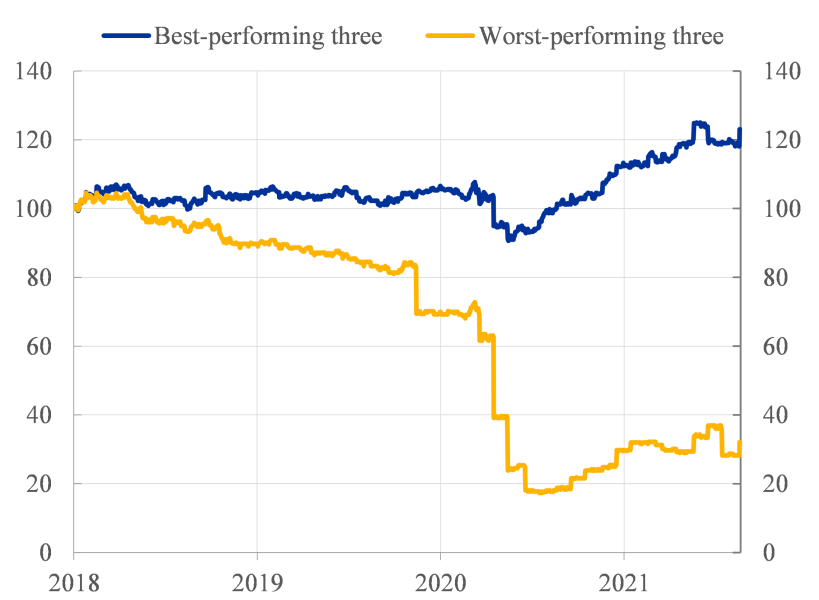
Sources: Refinitiv, IBES.
Notes: Figures are normalized to 100 at 1 Jan 2018. The top 3 represents the technology, utilities and financial services (excl. banks) sectors. The bottom 3 includes the travel, banks, and drugs and groceries stores sectors. Latest observation: 13 August 2021.
To provide a better gauge of cross-sectoral dispersion in earnings expectations, we construct the Gini coefficient of cross-sectoral earnings expectations. The advantage of the Gini coefficient is that it demonstrates the degree of inequality in any statistical distribution of earnings expectations, providing information on how the ranking of sectors changes over time. The Gini coefficient is easy to interpret: it reaches its maximum value of 1 when earnings expectations are positive for one sector and zero for all others, and 0 when all sectors contribute equally to the sum of expected earnings.
Chart 2 shows that the Gini coefficient of cross-sectoral earnings expectations has persistently risen since the onset of the COVID-19 crisis, in contrast to past crises such as the Dot-com bubble and Global Financial Crisis (GFC). While the Gini coefficient dropped after the collapse of Lehman Brothers during the Global Financial Crisis – reflecting a broad-based downward revision of the earnings outlook for especially the overperforming sectors – it trended upwards since the start of the COVID-19 crisis. Together, these observations signal a structural shift in expectations during the current pandemic: the market expects some sectors to continue to underperform others over the coming year.
Chart 2: Gini coefficient of corporate earnings expectations during the (i) Dot-Com Crisis, (ii) Global Financial Crisis and (iii) COVID-19 Crisis
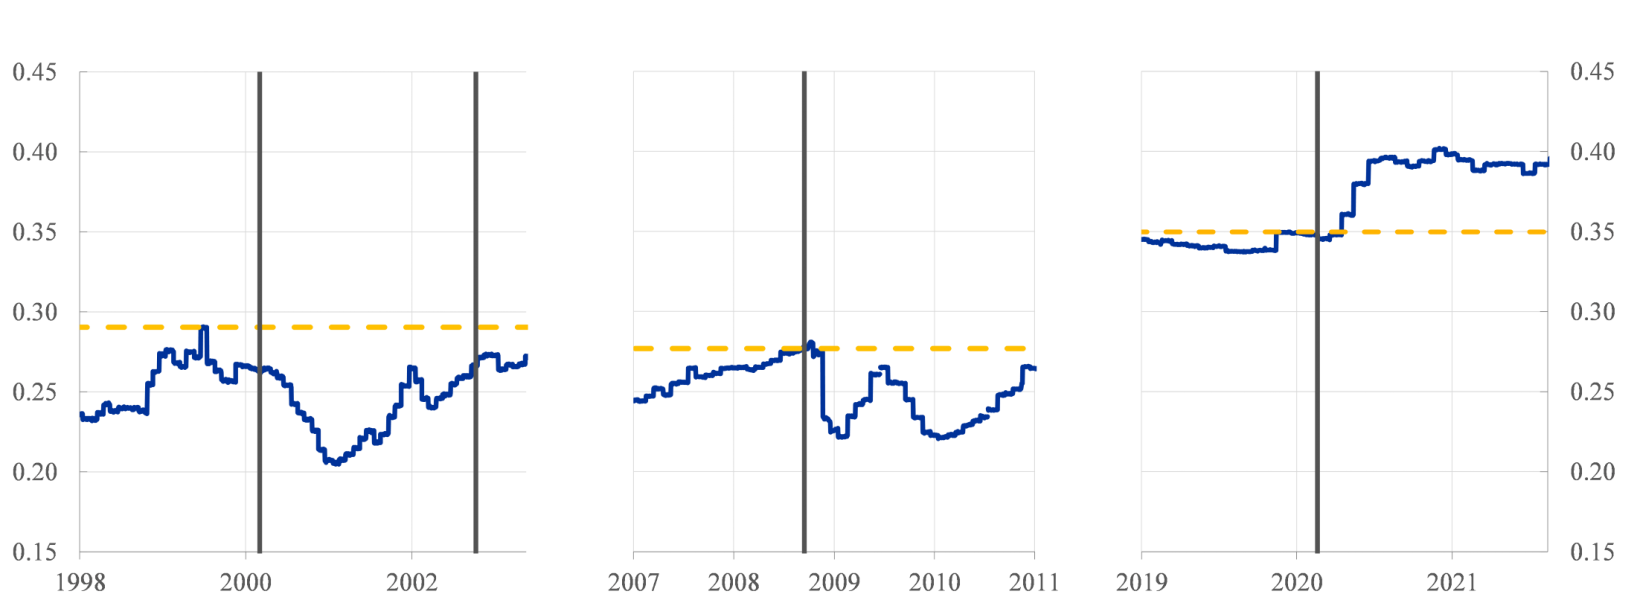
Sources: Refinitiv, IBES and author calculations.
Notes: The blue line shows the Gini coefficient based on earnings expectations 12-months ahead across 20 sectors. The yellow dashed line indicates the pre-crisis high for the relevant period. The vertical lines mark the date of the peak of the NASDAQ before the Dot-Com crisis outburst (lhs), the NASDAQ market bottom during the Dot-Com crisis outburst (lhs), Lehman bankruptcy (middle), and the outbreak of the COVID-19 crisis (rhs). Latest observation: 13 August 2021.
To empirically stipulate whether changes in cross-sectoral dispersion can be explained by the lockdown and social distancing measures, we regress the Gini coefficient of earnings expectations on the Goldman Sachs Effective Lockdown Index (ELI). The ELI accounts for a combination of official government restrictions and actual mobility data (using Google). The estimations also control for developments in the EPS forecasts for the total market, as well as broad stock market volatility.
Our results show that cross-sectoral dispersion in 12-month earnings forecasts for euro area corporates persistently increased with a tightening of lockdown measures (Chart 3). Up until December 2020, imposing a lockdown such that the ELI rises by 50 points (which is half of its maximum range from 0 to 100, and corresponds to the change observed during March 2020) significantly increased the Gini coefficient by 2.5 percentage points after 20 working days. A closer look at sectoral-level data indicates that, prior vaccinations, deteriorating earnings forecasts for the travel sector were the main driver of cross-sectoral dispersion during lockdowns. At the same time, the start of vaccination campaigns has been a game changer. Stringent lockdowns added far less to the dispersion metric after vaccinations started in the euro area in late 2020. Since mid-December 2020, the effects of restrictive lockdown measures on cross-sectoral dispersion decreased by more than 75 percent.
Chart 3: Sectoral dispersion in EPS forecasts and estimated impact of lockdowns before and after vaccinations (index, percentage points)
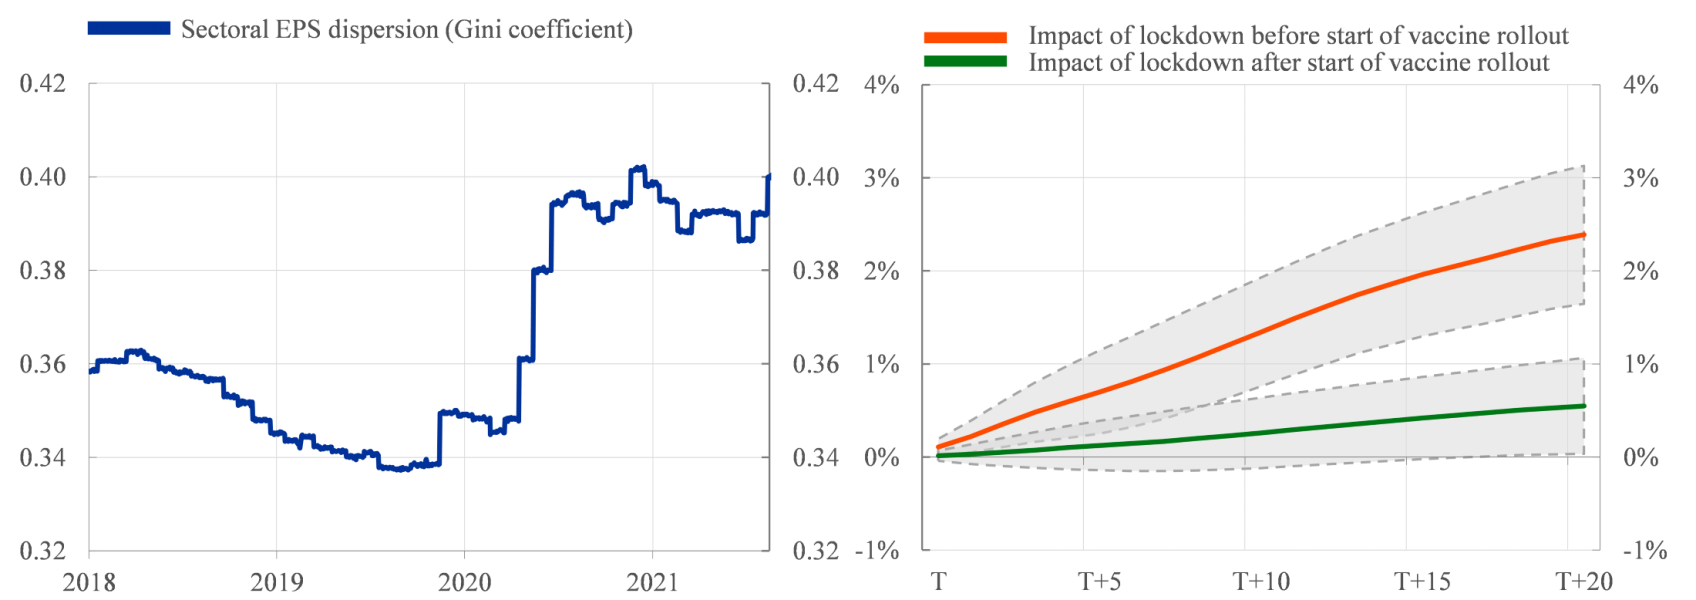
Sources: Refinitiv, Goldman Sachs, and author calculations.
Notes: This chart shows the impact of lockdowns (i.e. lockdown stringency index increase by 50 points) on the Gini coefficient of sectoral 12-month EPS forecasts. The estimated impacts are state-dependent on the start of vaccinations by the end of December 2020. The effects are estimated using local projections. The shaded areas represent 90% confidence intervals using Newey-West standard errors robust to heteroscedasticity and autocorrelation. Latest observation: 13 August 2021.
Looking ahead, the forward-looking metric of dispersion remains at historically elevated levels. This is worrisome. Analysts expect the societal and economic consequences for some companies to be of a lasting nature, which can lead to a more heterogenous recovery across countries. In terms of earnings expectations, we indeed find that corporates listed in countries that are relatively dependent on the underperforming travel sector are hurt the most by lockdown measures. Together, our findings signal that the success of vaccination campaigns is important to break ground for a more even recovery across sectors and countries than is currently expected.
Reference
Bats, Joost, William Greif, Daniel Kapp, 2021. The rise in the cross-sectoral dispersion of earnings expectations during COVID-19. DNB Working Paper 724.