
The views expressed in this article are those of the authors and do not necessarily represent the views of the Banca d’Italia or the Eurosystem. The note is based on the paper “The transmission of energy price shocks in the euro area”, which is available on the author’s homepage at https://sites.google.com/view/stefano-neri/home. I would like to thank Antonio M. Conti for his useful suggestions and comments and Arianna Marinelli for proof-reading the text. Any remaining errors are my sole responsibility.
Abstract
Shocks to energy prices significantly affect consumer prices and cause a substantial, prolonged downturn in economic activity in the euro area. The shocks of 2021 and 2022 had a larger and more lasting impact on inflation compared to previous shocks, highlighting the presence of state-dependent effects. If the ECB had adopted a more aggressive monetary policy – beyond what was implied by the actual policy rate and the Eurosystem’s balance sheet – to fully offset the influence of energy shocks on consumer prices, both real GDP and inflation in 2022 would have been lower, assuming all other factors remained constant. A response to net-energy inflation could have mitigated the adverse impact on real GDP.
In October 2022, inflation reached 10.6 per cent (year on year), a significant increase from the low figures between 2014 and 2019 (1.0 per cent, on average). The increase was to a large extent caused by the energy component of the consumption basket. However, within the energy goods, the drivers of the increase were different from the 2007-08 and 2011-12 high inflation periods. In those episodes, energy inflation was driven by the prices of liquid and solid fuels, which are closely linked to oil prices. In 2021 and 2022, however, gas and electricity prices were the largest contributors to headline inflation.
A recent paper (Neri, 2024) quantifies the contribution of energy price shocks to inflation and economic activity in the euro area using a Bayesian Vector Autoregressive (BVAR) model. The paper considers the price of a bundle of energy goods as it represents the cost paid by consumers for all energy products, which include gasoline, heating gas and electricity. These goods are produced from a variety of fossil (natural gas and oil) and renewable sources. Two simple figures illustrate the role of energy prices in the euro area. First, the average share of energy goods in the basket of the Harmonised Index of Consumer Prices over the period 2001-2023 is around 10 per cent. Second, when headline inflation peaked in October 2022, the direct contribution of the energy component was almost 4.5 percentage points out of 10.6 per cent year-on-year.
The BVAR is used to simulate the posterior distribution of the impulse responses to energy price shocks, their contribution to inflation and to carry out a counterfactual to assess the role of the ECB’s monetary policy in the transmission of the shocks. For the latter exercise, the identification of shocks to both energy prices and monetary policy is necessary.
The model comprises four variables in levels: the (log of the) energy component of the Harmonised Index of Consumer Prices (HICP), the (log of the) HICP net of the energy component, (the log of) real GDP and a measure of the shadow policy rate (Krippner, 2013 and 2020). The estimation period ranges from 1999:Q1 to 2023:Q4. The model includes a dummy variable with a value of one in the second quarter of 2020 to account for the unprecedented collapse in output following the outbreak of the pandemic. Bayesian methods are used for inference. The identification of the structural shocks combines the sign restrictions (Canova and De Nicolò, 2002, Uhlig, 2005 and Rubio-Ramírez et al., 2010) with the narrative restrictions (Antolín-Díaz and Rubio-Ramírez, 2018).
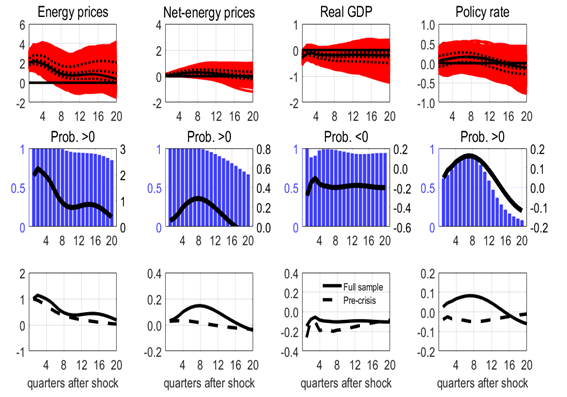
A positive shock to energy prices raises them by 2 per cent on impact (Figure 1). The probability that the response is positive after two years is close to 1, suggesting that the shock has a lasting impact. The shock causes a gradual increase in net-energy consumer prices, whose response remains positive with a probability larger than 0.80 until the end of the fourth year.
After the shock, real GDP falls persistently, reaching a minimum at the end of the second year. Throughout the whole horizon, the probability that the response is negative is larger than 0.80. The persistent increase in (net-energy) consumer prices calls for the ECB to raise the policy rate, which reach a peak after one year. After two years, the probability that the policy rate is above its baseline is around 0.80.
Figure 1. Impulse response to a positive shock to energy prices
(per cent and percentage points; deviation from unshocked paths)

Notes: Top row: the black solid line denotes the Bayes estimate based on the expected absolute loss. The red areas show the full range of impulse responses within the 0.68 joint credible set. Middle row: the black lines denote the Bayes estimate based on the expected absolute loss; the blue bars represent the posterior probabilities of the responses being either positive or negative (see title to each panel). The bottom row reports the Bayes estimate of the impulse responses for the full sample (solid lines) and the pre-crisis (dashed lines) sample.
In order to identify potential non-linearities and state-dependence associated with the level of inflation and the size of the shocks, two sample periods are considered: the first sample ends in 2021:Q2 (pre-crisis), just before the inflation surge, the second (crisis) in 2023:Q4. Theory and empirical evidence suggest that price-setting may be state-dependent rather than time-dependent as in workhorse New Keynesian models. Cavallo et al. (2023) show, using granular datasets, that the frequency of price changes increased sharply after the large shocks in 2022. In a parsimonious New Keynesian model that is consistent with the empirical findings, firms adjust their prices more rapidly in response to large increases in marginal costs than to small increases. In the wording of Cavallo et al. (2023), “large shocks travel fast”.
A comparison of the impulse responses over the two periods (bottom row in Figure 1) reveals that a shock to energy prices, whose persistence is similar in the two estimation samples, has a more pronounced and sustained impact on net-energy consumer prices in the sample that includes the energy crisis. While the impact on real GDP is comparable, the ECB increases the policy rate by more and keeps it at a higher level for longer in the crisis sample.
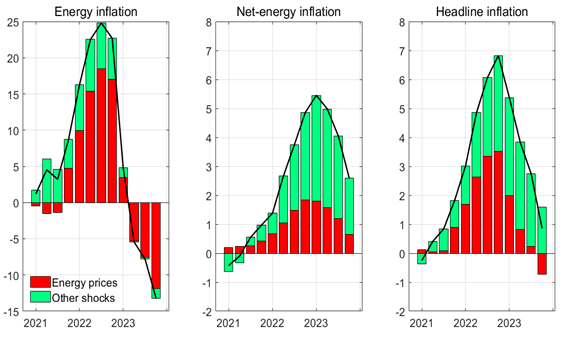
Figure 2. Historical decomposition: energy, net-energy and headline inflation
(percentage points; deviations from the baseline)

Note: The bar denotes the Bayes estimate of the contribution of the identified shocks to the deviations of the inflation rates from their respective baseline levels. The contributions are computed within the Gibbs sampling algorithm as the year-on-year changes in the contributions to the corresponding consumer price series.
Since the third quarter of 2021, positive shocks to energy prices have pushed these prices to unprecedented levels. In the first quarter of 2022, when Russia invaded Ukraine, these shocks account for 14 p.p. of a total deviation from the baseline of 16 p.p. (Figure 2, left panel). The maximum contribution is reached in the third quarter of 2022, amounting to 20 out of a total deviation of 25 p.p. The maximum contribution of energy shocks to net-energy inflation is reached in the first of 2023, when they account for 1.4 p.p. out of a total deviation of 5.6 (Figure 2, mid panel), thereby confirming that energy price shocks exert significant indirect effects on the prices of food, non-energy industrial goods and services. The contribution of energy shocks to headline inflation increases gradually throughout 2021 and 2022, reaching a maximum of 3 p.p. out of a deviation of 7 in the last quarter of 2022 (Figure 2, right panel).
This section employs a structural counterfactual to evaluate the influence of the ECB’s monetary policy on the propagation of shocks to energy prices during the 2021-22 period of high inflation. The counterfactual documents how inflation and real GDP growth would have evolved in the absence of a more restrictive monetary policy aimed at offsetting the impact of energy shocks on headline inflation. Theory suggests that a tighter monetary policy in response to a shock to the price of energy would result in a decline in output and would counter the increase in inflation, ceteris paribus.
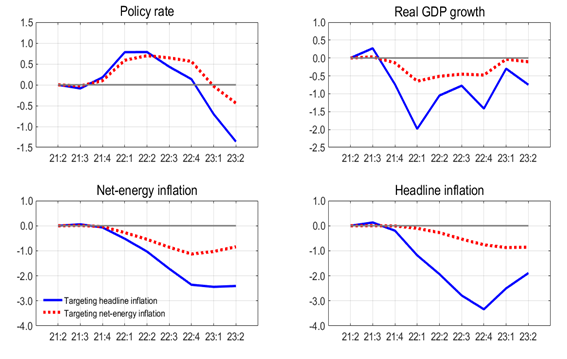
Figure 3. Structural counterfactual: targeting headline vs. net-energy inflation
(percentage points)

Note: the blue solid lines denote the Bayes estimate of the counterfactual scenario in which the ECB adjusts the policy rate in order to offset the impact of the shocks to energy prices on headline inflation; the red dotted lines denote is the Bayes estimate of the counterfactual scenario in which the ECB adjusts the policy rate in order to offset the impact of the shocks to energy prices on net-energy inflation.
The simulation is computed as follows. Conditional on an accepted draw from the posterior distribution, the monetary policy shocks are calibrated in order to offset the impact of the energy shocks on headline inflation in each quarter between 2021:3 and 2023:2. In the baseline simulation, the BVAR is fed only with the identified shocks to energy prices. The results are compared with those obtained on the assumption that the monetary policy shocks offset the impact effect of the energy shocks on net-energy inflation. In this scenario, the ECB looks through the direct impact of energy prices on headline inflation and adjusts its policy rate only to the extent that the shocks give rise to indirect effects. The simulations are conducted on the assumption that long-term inflation expectations remain anchored after the shocks to energy prices.
Figure 3 compares the results of the two counterfactuals. If the ECB tightens monetary policy to offset the impact of the energy price shocks on headline inflation, real GDP growth and inflation fall by more than when the central bank aims to offset the impact on net-energy inflation. While the peak increase in the policy rate in the former case is twice as large as the peak increase in the latter case, the maximum impact on real GDP growth and headline inflation is, respectively, 3.3 and 4.7 times larger. If the ECB aims at counteracting the impact of energy price shocks on headline inflation, the cost in terms of economic activity can be large. Following shocks to energy prices, the central banks faces a trade-off between the stabilization of inflation and output.
Since mid-2021, the euro area has experienced unprecedented adverse shocks to energy prices, which have pushed inflation to levels not seen since the 1970s. In response, the ECB implemented a rapid and unprecedented increase in the policy rates and a reduction of the Eurosystem’s balance sheet to prevent the upward de-anchoring of long-term inflation expectations and second-round effects. In accordance with theory, had the ECB had tightened monetary policy more than it did to fully counteract the impact of energy price shocks on consumer prices, both real GDP growth and inflation would have been lower in 2022, all other things being equal. A response to net-energy consumer prices would have resulted in a reduction of the output cost.
Antolín-Díaz, J. and J. F. Rubio-Ramírez (2018). “Narrative sign restrictions for SVARs”, American Economic Review 108, 2802-2829.
Canova, F. and G. De Nicolò (2002). “Monetary disturbances matter for business fluctuations in the G-7”, Journal of Monetary Economics 49, 1131-1159.
Cavallo, A. F. Lippi and K. Miyahara (2023). “Large shocks travel fast”, National Bureau of Economic Research Working paper 31659.
Kilian, L. and X. Zhou (2023). “Oil price shocks and inflation”, Federal Reserve Bank of Dallas Working paper 2312.
Krippner, L. (2013). “Measuring the stance of monetary policy in zero lower bound environments”, Economics Letters 118, 135-38.
Krippner, L. (2020). “Documentation for shadow short rate estimates”, available at https://www.ljkmfa.com/test-test/international-ssrs/.
Neri, S. (2024). “The transmission of energy price shocks in the euro area”, Banca d’Italia, mimeo.
Rubio-Ramirez, J. F., D. Waggoner and T. Zha (2010). “Structural Vector Autoregressions: Theory of identification and algorithms for inference”, Review of Economic Studies 77, 665-696.
Uhlig, H. (2005). “What are the effects of monetary policy on output? Results from an agnostic identification procedure”, Journal of Monetary Economics 52, 381-419.