This Policy Note is based on Natixis Special Report “Europe: How much damage could tariff hikes cause?,” Natixis, May 2024.
It looks increasingly likely that European companies will face rather sooner than later new tariffs when exporting to China or the US. As the EU hiked tariffs for Chinese imports of electric vehicles, China in turn is likely to respond by raising import tariffs for European exporters to China. Whether European exporters to the US will also face new tariffs will very much depend on the outcome of the elections in November. A re-election of Trump would likely lead to new tariffs being slapped on European imports in the US.
We try to quantify the growth effect of tariffs in this report with the help of two different empirical approaches. Our analysis shows that tariff hikes have clearly the potential to dent growth in the euro area significantly. A 10% tariff hike could reduce output in Germany by around 0.5%, 0.3% in France, 0.4% in Italy and 0.2% in Spain. Thus, depending on the size of the hikes, the euro area could slide into recession in response to higher tariffs.
European exporters are used to adapt to a challenging external environment. Brexit and the accompanying erection of explicit and implicit trade hurdles is only the most noteworthy recent example of how important trade linkages can deteriorate. The temporary increase of tariffs in the US for European imports during the Trump administration were yet another reminder that the days of a smooth function of the global trade system are gone (see Chart 1).
Chart 1: US Tariffs on EMU5 imports (%)
 Source: WITS, World Bank, UN.
Despite these headwinds, euro area exports have broadly developed along their long-time trend: real exports have increased by around 36% over the last 10 years. Thus, European exporters have proven their general adaptability to a changing landscape.
The relative robustness of euro area export growth, however, should not be seen as proof that exporters will be able to deal smoothly with any new challenge. For one, euro area export growth has recently developed more sluggishly than fundamentals would suggest (see “Euro area: are structural factors behind weaker exports?”). Moreover, it is increasingly likely that European exporters will soon face new tariffs when trading with China and the US, its two biggest trading partners. The reason for this is twofold. First, the European Commission announced a hike of tariffs for Chinese EVs. The Box at the end of this report explain in all detail how trade policy is conducted in the EU.
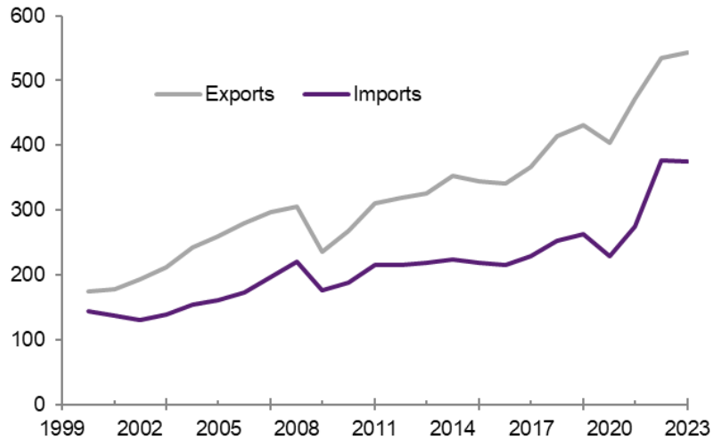
Beyond electric vehicles, there is a general concern regarding the rising trade deficit with China (see Chart 2), suggesting that further investigations into unfair trade practices are likely to follow.
Chart 2: EU: Exports and Imports with China (bn USD)
 Source: Datastream, Natixis.
The Chinese government has suggested that it will respond in kind making it very likely that European exporters, at least for some sectors, will face higher tariffs. But it is not only trade with China where European companies may face new tariffs. Depending on the outcome of the election in the US this November, tariffs for European imports to the US may be increased too. A Trump led administration would point to the big trade deficit with the EU and impose new tariffs (see Chart 3).1
Chart 3: EU: Exports and Imports with US (bn USD)
 Source: Datastream, Natixis.
If a country imposes a tariff on imports from another country it essentially increases the price of that good for its domestic buyers. To what extent the price effectively changes and what the macro-economic implication are, depends on several other factors. One crucial determinant, for example, is the price sensitivity of the demand for that specific good. Depending on how high or low that sensitivity is, the company may be able to pass that tariff hike onwards to its customers (or not). To calculate the overall impact of the tariff one also needs to know the weight in the economy of the exporter to which the tariff applies to. Finally, one has to consider second round effects of lower activity on the sector hit by the tariff for other sectors not directly affected.
With all this in mind we will try in the following to quantify the effect of a general 10% tariff hike on European exports to the US and China. To calculate the impact, we apply sector specific demand elasticities for 97 different manufacturing sectors. This allows us to estimate the decline in exports to the US and China in response to a 10% increase in tariffs. In order to gauge the overall impact on GDP we then – with the help of an input-output table – calculate how much output in all other sectors were to decline in response to the reduced output in a given sector. To make this more concrete. A decline in demand for German cars in the US owing to a rise in tariffs will reduce output in the German car sector by X%. This lower output will feed through to lower output in other sectors that produce intermediate inputs for other sectors. The total impact of the tariff is then simply the sum off the decline across all sectors.
Chart 4 shows the decline in GDP for the EMU4 countries in response to a 10% increase of tariffs for all goods exports from the EMU4 countries to the US. Given that the price sensitivity of demand is a crucial factor for the calculation we show the results for 4 different estimates of the demand elasticity.2 As the chart makes clear, the outcome varies significantly depending on which elasticity is used. Based on World Bank elasticities the impact of a 10% hike would be rather moderate at 0.24% of a decline in GDP in Germany, -0.13% in France, -0.19% in Italy and -0.07% in Spain. Applying the elasticities found by CEPII (2022), the impact would be -1.6% of GDP decline in Germany, -0.8% in France, -1.2% in Italy and -0.5% in Spain.
Chart 4: Impact on GDP of 10% increase of tariffs on all US imports (%)
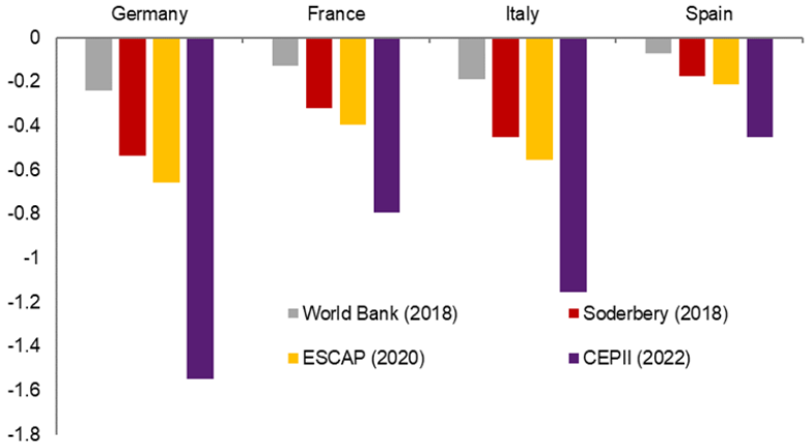 Source: World Bank, Soderbery, ESCAP, CEPII, Natixis.
The fact that these estimates vary significantly depending on the chosen elasticity underlines the general degree of uncertainty surrounding the effect of tariff hikes. That said, the CEPII based estimates look extreme and we would think an average of the three other estimates provides a better gauge for the overall impact. Thus, a 10% tariff hike could reduce GDP by around 0.5% in the case of Germany, 0.3% in France, 0.4% in Italy and 0.2% in Spain. For completeness Chart 5 shows the decline in activity broken down into several sectors (using a weighted average of elasticities).
Chart 5: Sectorial breakdown of decline in value-added after 10% increase of US tariffs (%)
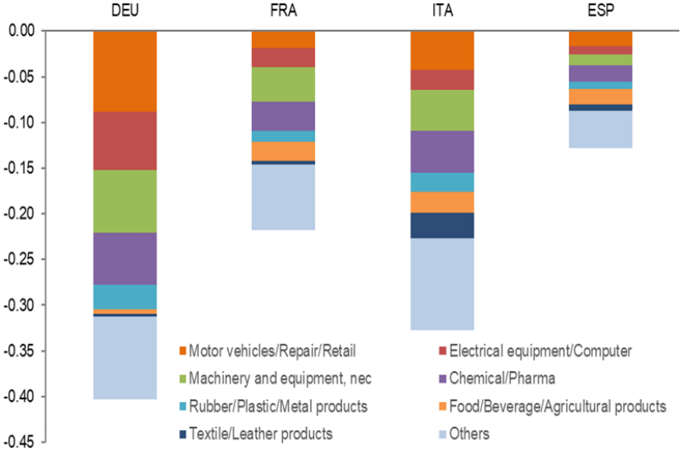 Source: World Bank, Natixis.
We now report the result for the same exercise for China (see Chart 6). Not surprisingly the results are similar to US given that the same elasticities were used. Although European exports to China are smaller than to the US, differences in the structure of exports imply a similar growth impact. Using again the average of World Bank, ESCAP, and Soderbery estimates for the demand elasticity, output in Germany would also decline by 0.5, 0.3% in France, -0.2% for Italy and 0.1% for Spain.
Chart 6: Impact on GDP of 10% increase of tariffs on all Chinese imports (%)
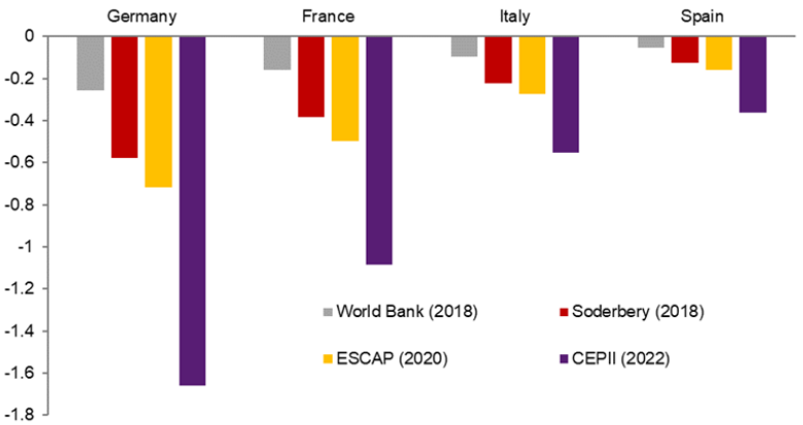 Source: World Bank, Soderbery, ESCAP, CEPII, Natixis.
To sum up our results, a 10% tariff on all goods exported to the US and China would lead in combination to a noticeable decline in GDP, with Germany clearly hit the hardest and Spain the least.
The results presented so far were based on a “static -analysis”, meaning that we have only calculated the direct impact of the rise in tariffs, ignoring any potential second round effects of the decline in activity. Related to this, we also did not specify the “timing” of the effect, i.e. how long it will take until the full effect of tariffs hikes is felt.
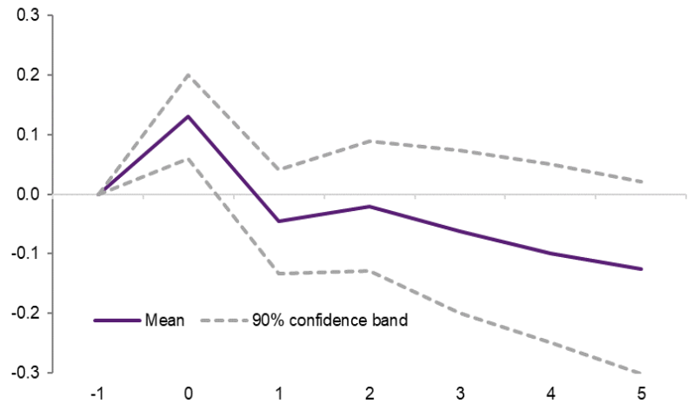
In order to incorporate second order effects fully we follow Furceri et al (2021) and estimate the dynamic response of euro area GDP to a tariff hike.3 The estimate is based on a large panel of countries and produces (taking country specific effects into account) the average response of GDP to an increase in tariffs. Chart 7 shows the response of GDP to a 1% increase in tariffs.4 As expected a tariff hike leads to a decline in GDP of around 0.05% after 1 year. The negative effect than rises to around 0.1% after three years.
Chart 7: GDP response to a 1% increase in tariffs (% deviation from baseline)
 Source: Natixis, World Bank.
The order of magnitude of the effect after 1 year is somewhat higher than the results we showed for the static analysis (Chart 4 and 6), which is not surprising given that second-rounds effects are now also included.
Our analysis showed that tariffs hikes have clearly the potential to dent growth in the euro area significantly. Depending on the size of the hikes, the euro area could slide into recession. The coming months will show how relevant this risk is and whether countermeasures from China will lead to a sharp escalation in trade tensions. Our baseline scenario for now is one of limited tariff hikes and thus a limited growth impact.
The European Union’s (EU) trade policy is one of the most integrated common policies. It falls largely under the exclusive competence of the Union, with its objectives and principles set out in Articles 206 and 207 of the TFEU. The procedure for negotiating and concluding trade agreements is specified in Articles 207 and 218 of the TFEU (Articles 206, 207, and 218 of the TFEU). The EU’s trade policy is based on uniform principles, including tariff changes, the conclusion of tariff and trade agreements, standardization of liberalization measures, export policy, and trade defense measures.
Regarding the negotiation of trade agreements with third parties, the European Commission leads the negotiations and presents its recommendations, which must then be validated by the Member States through the Council by qualified majority. The EU’s trade policy is decided through a legislative process that involves several stages.
The EU’s common trade policy measures are adopted by the European Parliament and the Council through the ordinary legislative procedure. However, in some areas, the Council decides unanimously:
The unanimity rule thus gives Members of the European Parliament a veto right, as a single vote against can invalidate the decision. However, an abstention does not prevent the adoption of a decision.
The EU’s common trade policy rests on three pillars:
One of the EU’s objectives is global trade liberalization, but it also seeks to ensure that “imported products are sold at a fair and reasonable price on its territory, regardless of their origin.” This is why the EU has undertaken a comprehensive reform of essential trade regulations, covering foreign direct investment, anti-dumping, and trade defense instruments.
On December 20, 2017, the EU’s new rules to better protect the EU against unfair trade practices came into effect. The EU’s anti-dumping rules apply to cases where the prices of imported products are artificially reduced by state intervention. The anti-dumping rules coincide with a broader revision of the EU’s trade defense instruments (TDIs). When in the form of trade defense instruments, trade regulation is a means to protect EU producers from harm and counter unfair competition practices by foreign companies, such as dumping and subsidies.
On March 5, 2019, the Council adopted a new regulation on the screening of foreign direct investments (FDIs). It has been fully operational since October 11, 2020. This allows the EU to coordinate the control of investments from third countries in strategic sectors to ensure they do not pose a threat to security or public order.
On October 23, 2023, the ministers adopted the establishment of an anti-coercive instrument to assist the EU and its Member States in protecting themselves against economic coercion exercised by third countries. This represents a significant change in policy. The coercive instrument establishes the EU’s principles, objectives, and measures regarding economic coercion exercised by third countries, emphasizing the importance of respecting international law and multilateral cooperation in international relations. The objective of this anti-coercion instrument is to act as a deterrent, allowing the EU to resolve trade disputes through negotiation. However, as a last resort, it could be used to initiate countermeasures against a third country, including a wide range of trade, investment, and financing-related restrictions.
Mr Trump has said several times during the election campaign that he would impose 10% tariffs across the board.
For the different sources see ESCAP (2020); World Bank (2020); CEPII (2022); Soderbery (2018).
See Furceri et al (2021) “The Macroeconomy After Tariffs”, Policy Research Working Paper 9854; World Bank. The authors use a so-called local projection method on a panel of 151 countries over the period from 1963 to 2014 for their estimates.
This is the “average“ response of GDP across the whole panel and not necessarily the response of the euro area. There would simply not enough data available to base the estimation only on euro area data.