This Policy Note is based on Deutsche Bank Research EU Monitor Global Markets Publication, August 2024. The author would like to thank Conor O’Toole, Lionel Becker, and Lennart Zwingenberger for their valuable contributions to this report.
A well-functioning securitisation market could help to unlock capital to fund Europe’s economy and its green and digital transition. The bundling of loans into a tradable security can act as a funding tool for banks and/or allow them to transfer risk to investors, thereby creating additional lending capacity. The European securitisation market has been stagnating since the financial crisis. Issuance has been fluctuating around EUR 200 bn per year. This is much lower than in the US, where average annual issuance has been about EUR 2 tr in the period 2013-23. Renewed political support, stronger push factors in the form of looming higher capital requirements for banks and the winding-down of central bank refinancing as well as a more benign macroeconomic environment all provide tailwinds for the securitisation market. However, without targeted regulatory measures, a meaningful pick-up in securitisation volumes will probably remain elusive.
A well-functioning securitisation market could help to unlock capital to fund Europe’s economy and its green and digital transition. Therefore, securitisation is one of the cornerstones of the Capital Markets Union (CMU)1 and figures high on EU leaders’ priority list2 for the new legislative term (2024-29). Since 2019, the EU has already introduced different legislative acts to revive securitisation and there is probably more to come over the next few years. The European market has been stagnating since the peak of the global financial crisis in 2008, triggered by US subprime mortgages – not least because the instrument is considered to have contributed to the crisis. Over the past ten years, issuance in Europe remained at a relatively constant nominal level of around EUR 200 bn pa. Market-placed annual issuance has been lower still, averaging ca. EUR 100 bn. This is much less than the average annual issuance of EUR 2 tr seen in the US in the period 2013-23. However, several factors could provide new impetus for the European securitisation market in the medium term: i) renewed political support, ii) looming higher capital requirements for banks, iii) the winding-down of central bank refinancing schemes.
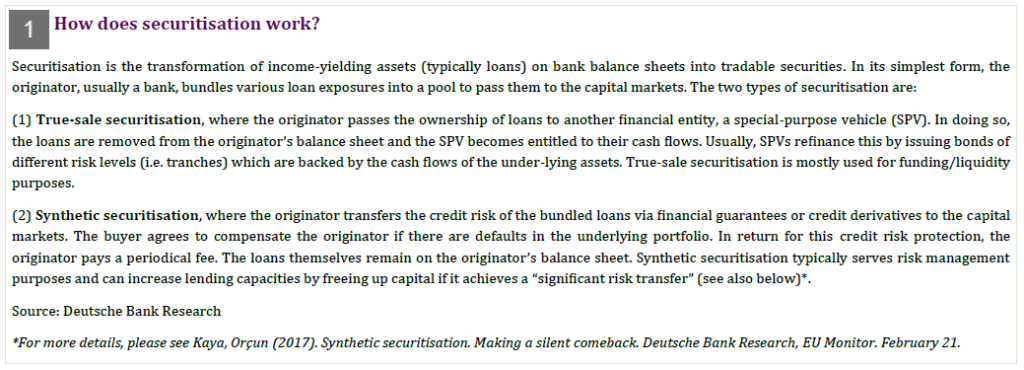
How securitisation can contribute to financing of the economy. The bundling of loans into a tradable security (Box 1) can act as a funding tool for European banks and/or allow them to transfer risk to investors.3 This frees up regulatory capital and creates additional capacity to lend to the economy, including the financing of green and digital projects. The European Commission estimates that a rebound of the securitisation market to pre-financial crisis levels could lead to additional lending of about EUR 100-150 bn a year.4 This could facilitate the access to funding, particularly for SMEs and households, which generally rely on bank loans. By aggregating these typically small loans, securitisation transforms these rather illiquid assets into tradable securities. This can also generate opportunities for investors that are not able to provide such small-scale loans themselves, including in green projects like solar panels or electric vehicles. Securitised products are potentially attractive to a broad range of investors given that the pooled assets are divided into tranches with different risk/return profiles. Admittedly, ESG-labelled securitisation so far only accounts for a small part of the market, with issuance of EUR 2 bn in 2023 (about 1% of the total).5
Against the backdrop of the renewed interest in securitisation, this study looks at the recent evolution of the European market. It takes a closer look at different segments and regional developments and draws comparisons with the US. Furthermore, it points out which factors have hindered market growth and highlights key regulatory developments.
Before the global financial crisis, securitisation boomed in Europe. Issuance of true-sale products reached an all-time high of EUR 711 bn in 2008 (Chart 2). This brought the outstanding amount to over EUR 2 tr in the following year (Chart 3). In the aftermath of the crisis, issuance fell to EUR 180 bn in 2013, even though the European market performed robustly during the crisis and was not nearly as affected by defaults as the US (Chart 4). Over the last decade, issuance remained stable at around EUR 200 bn per year. The outstanding amount has been flat for years at about EUR 1.2 tr – half of the pre-crisis level. However, latest figures point to a slight upward trend. In 2023, issuance rose by 5% yoy and in H1 2024, it was up 6% yoy.6
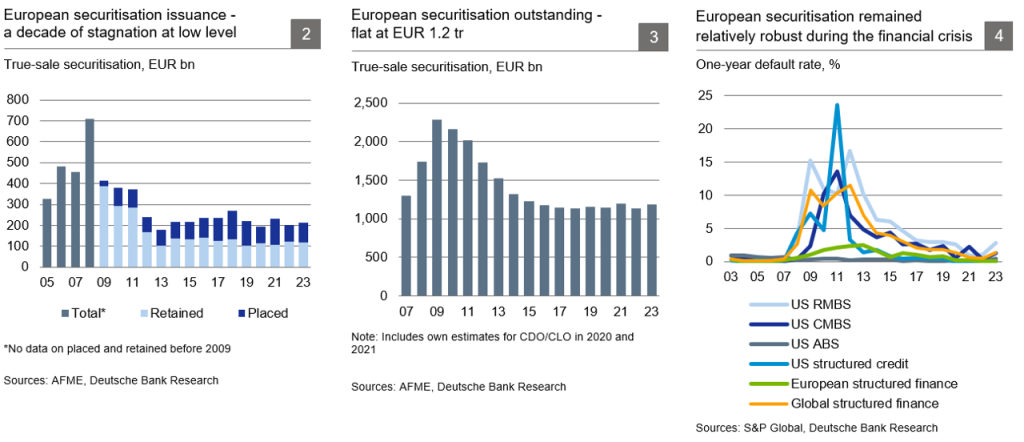
True-sale securitisation is mainly used as a funding tool. On aggregate, the issuing banks place only about 40-50% of the securitisation on the market, usually senior tranches. They retain the remaining portion, often incl. the high-risk first-loss piece. Part of the retained senior tranches is used as collateral in central bank lending schemes or to meet liquidity requirements. But banks also act as investors in such products. Consequently, they held the vast majority of the outstanding paper in Europe (84%) in 2021 (latest date available), with investment funds a distant second (7%), followed by insurance companies (5%).7
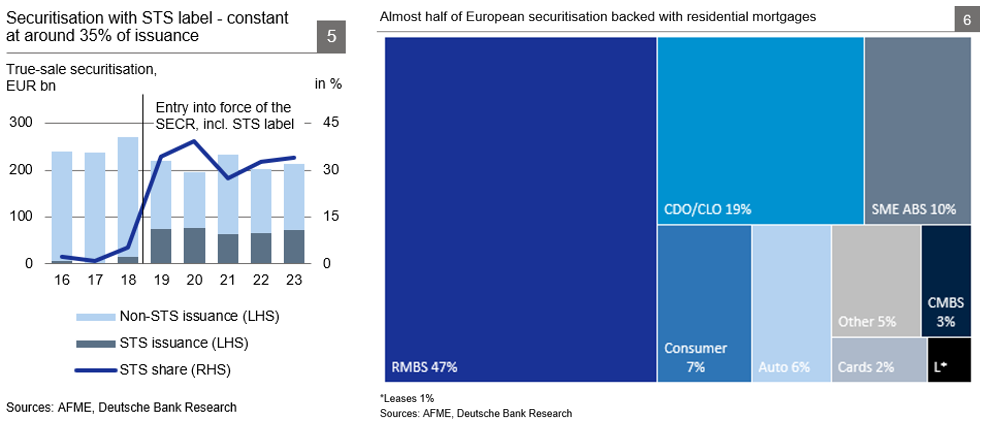
The STS label has not brought the hoped-for rebound. The EU Securitisation Regulation (SECR) introduced the voluntary “Simple, Transparent, Standardised” (STS) label (see below for more details on the regulatory framework). The label is available for securitisation that is of high quality and not overly complex in structure. This comes with the benefit of lower capital requirements for banks. Still, capital requirements remain higher than for other asset classes such as covered bonds. Since the entry into force of the SECR in 2019, STS securitisation accounted for around one-third of new issuance (Chart 5). However, the label did not bring the hoped-for new originators or investors to the market, as indicated by the rather stable level of total issuance, though perhaps it did prevent a further decline. By and large, securitisation that would have been issued anyway now carries the STS label if it meets the criteria.
Type of collateral – half of it residential mortgages. Retail mortgages are the most common type of collateral, with residential mortgage-backed securities (RMBS) accounting for 47% of outstanding European true-sale securitisation at the end of 2023 (Chart 6). Other main sources of collateral were SME (10%), consumer (7%) and auto loans (6%). One of the most dynamic segments are collateralised debt obligations (CDOs), typically consisting of collateralised loan obligations (CLOs) which mainly invest in leveraged loans (i.e. bank loans to highly indebted counterparts). In parallel to a growing leveraged debt market, the amount of outstanding CDO/CLOs rose from EUR 117 bn in 2014 (9% of the total) to EUR 229 bn (19%) in 2023. The segment is expected to grow further in 2024.8
At the end of 2023, 97% of outstanding securitisations had an investment-grade rating, i.e., supposedly a relatively low risk of default.9
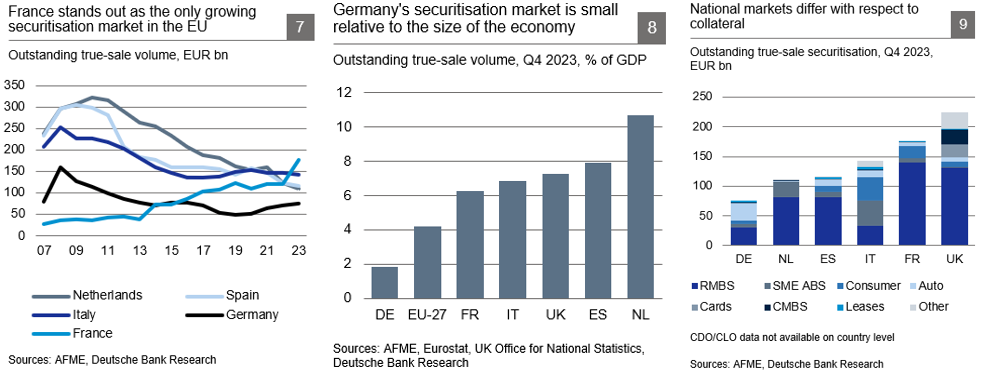
Origin of collateral – regional composition is dominated by large countries. The European true-sale securitisation market is heavily concentrated on a few countries. Almost 90% of the collateral in outstanding securitisation came from the UK, France, Italy, Spain, the Netherlands and Germany in 2023 (while these economies accounted for only 68% of European GDP)10. Pan-European securitisations with collateral from several countries only play a minor role, representing less than 1% of the total. France is the sole country in Europe where the securitisation market has been growing since the financial crisis, with outstanding amounts increasing from EUR 28 bn in 2007 to EUR 176 bn in 2023. All other major European markets have shrunk over the same period, although there has been a slight recovery in Germany over the past three years (Chart 7). Relative to the size of the economy, the Netherlands boast the largest market with outstanding volumes equivalent to 11% of GDP. By contrast, at 2% of GDP, the German market is relatively small (Chart 8).
The individual national markets differ in terms of collateral usage (Chart 9)11. Residential mortgages are the dominant asset class in most countries, especially in France where they account for roughly 80% of total outstanding. Some countries like Italy and Germany have a more diversified pool of collateral. In Germany, about 40% is backed with auto loans. In Italy, the securitisation market consists of three main asset classes – SME asset-backed securities (ABS) (29%), consumer ABS (28%), and RMBS (23%).
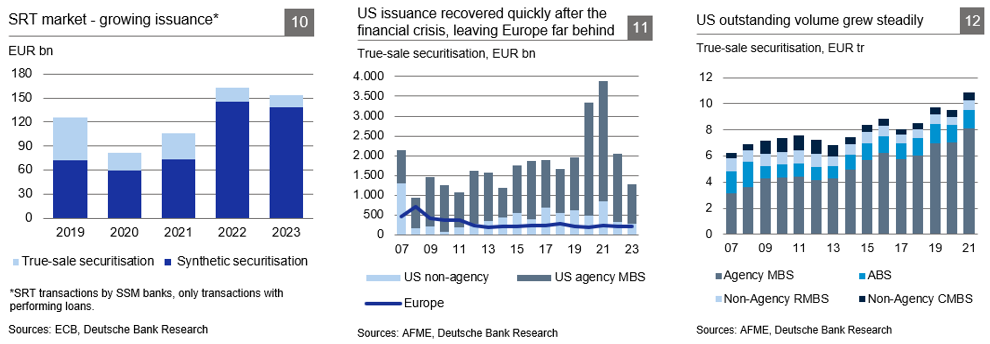
Securitisation can help banks to free up lending capacity. This is the case when it meets the criteria for a “significant risk transfer” (SRT) which allows the originating bank to reduce the regulatory capital for the underlying portfolio if it can transfer a sufficient amount of credit risk to investors.12 This is particularly relevant for synthetic securitisation, where the issuing bank retains the underlying loans on the balance sheet (therefore it is also known as “on-balance-sheet securitisation”). Accordingly, synthetic securitisations make up the lion’s share of the SRT segment (91%). By contrast, true-sale securitisation, where banks often retain the first-loss piece, only accounted for 9% in 2023, according to ECB data. SRT can therefore provide an idea of the size of the synthetic market for which no exact data is available.
The euro-area SRT market grew strongly between 2021 and 2022, when issuance reached a record level of EUR 163 bn (Chart 10). A key driver was synthetic SRT transactions that almost doubled from EUR 73 bn in 2021 to EUR 145 bn in 2022. This was mainly due to the inclusion of synthetic securitisation in the STS framework in 2021, which reduced capital requirements for such positions even further. In 2023, the SRT market moved sideways with EUR 139 bn of synthetic securitisation issued. Half of the transactions qualified for the STS label, an increase from 42% in 2022 and 33% in 2021.13 Going forward, generally higher capital requirements resulting from the full implementation of Basel III could make SRT securitisation and the associated capital relief increasingly important for banks.14
Similar to the true-sale segment, the SRT market is concentrated on a few countries, with France accounting for over 30% of the total volume in the euro area in 2022. The largest chunk of underlying assets in SRT securitisations were corporate loans(57%), and also SME loans (9%). This could be due to confidentiality restrictions of such loans that make a typically public true-sale transaction unfeasible (synthetic deals tend to be private). Moreover, there are transfer restrictions at certain loan facilities for companies (e.g. revolving loans) which make these loans better suited for a synthetic rather than a true-sale transaction.15 SRT securitisation has traditionally been used by only few of the largest euro-area banks, but other banks have recently begun to step into the market too.16
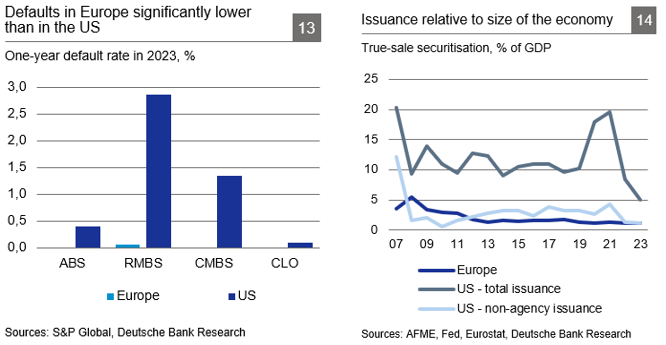
In contrast to Europe, the US securitisation market recovered rather quickly after the financial crisis with issuance of true-sale products growing steadily and reaching a record-high EUR 3.9 tr in 2021. The very large volumes in 2020 and 2021 were driven by a boom in the mortgage market due to a drop in interest rates during the pandemic. At the same time, as part of its quantitative easing policies, the Fed purchased significant amounts of MBS.17 However, issuance fell back in 2022 and declined further to EUR 1.3 tr in 2023 in light of high inflation, rising interest rates, and emerging recession fears (Chart 11).
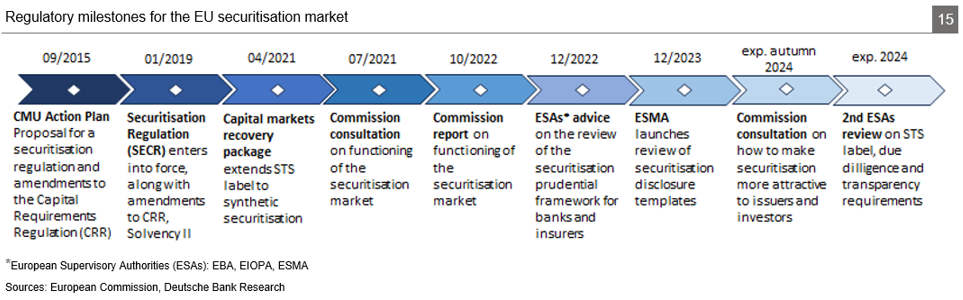
Outstanding securitisation reached EUR 11 tr in 2021 18 (Chart 12). This is equivalent to 54% of GDP, compared to just 6% in Europe. The most prominent asset class are RMBS, accounting for 81% of the total – much more than the 58% market share of RMBS in Europe (on a comparable basis, i.e. excluding CDO/CLOs for which no data is available in the US). Overall, default rates remain substantially higher in the US than in Europe. While they were 0% in Europe for ABS, CMBS and CLO, and 0.1% for RMBS in 2023, they ranged between 0.1% (CLO) and 2.9% (RMBS) in the US (Chart 13). With respect to investors, US banks are estimated to hold only about 30% of outstanding MBS, while other investors seem to play a bigger role than in Europe.19
There are two main reasons for the differences between Europe and the US. First, banks’ funding traditions are somewhat different. In the US, securitisation especially of retail loans such as mortgages, car or student loans is common practice whereas European banks keep most of these loans on their balance sheet. Hence, combined with other factors such as a much larger US corporate bond market, total assets of European banks tend to be substantially higher than those of their peers in the US. On the other hand, unlike the US, Europe has a well-established covered bond market that offers banks an alternative funding instrument.
Second, public guarantee schemes play a much more important role in the US than in Europe. US government-sponsored enterprises (GSE) such as Fannie Mae and Freddie Mac on average accounted for 81% of securitisation issued between 2020 and 2023. By contrast, guarantees by the European Investment Fund (EIF) for securitised products on average amounted to only EUR 2-3 bn per annum between 2013 and 2023, equivalent to about 1-2% of the total transaction volume. Even for the non-agency segment alone, securitisation issuance in the US surpasses that in Europe – both in absolute terms (Chart 11) and relative to economic strength (Chart 14). However, the gap has narrowed over the past two years.
Synthetic securitisation is less prevalent in the US than in Europe. EU banks held an estimated share of 62% of the global synthetic securitisation market by issuance in 2023.20 This is down from 80% in the years before the coronavirus pandemic, as banks in the US and other regions have become increasingly active in the market. In 2023, banks outside Europe issued almost EUR 80 bn of synthetic securitisation.21 In the US, this was driven by the anticipated increase in banks’ capital requirements due to the final Basel III rules, the regional banking crisis in March 2023 as well as a new Fed guidance 22 for SRT.23
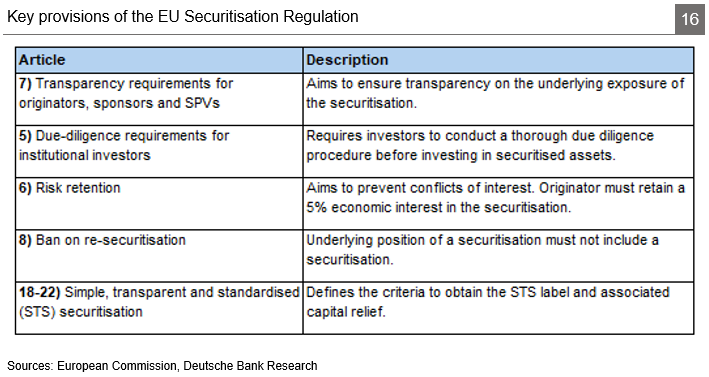
The current rule book for securitisation in the EU emerged from the proposals to create a single market for capital presented in 2015 (Chart 15).24 It was an attempt to revive securitisation and enhance transparency in the market, protect investors and safeguard financial stability. The resulting framework consists of three main elements:25
I. The Securitisation Regulation (SECR) established a general set of rules for securitisation in the EU and came into force in 2019. It includes provisions adopted after the financial crisis, such as due diligence requirements, risk retention and reporting obligations (Chart 16).
II. The introduction of a label for “simple, transparent, and standardised” (STS) securitisation. Securitisation products that meet the criteria of the voluntary STS label are eligible for preferential capital treatment (initially only for true-sale transactions).
III. Amendments to the prudential requirements for securitisation in the Capital Requirements Regulation (CRR) and Solvency II.
During the coronavirus pandemic, the Commission proposed targeted amendments to the framework as part of a capital markets package to support the economy.26 This included an extension of the STS label to synthetic securitisation and an easing of provisions for the securitisation of non-performing loans. These amendments came into effect in April 2021.
The final Basel III prudential regulations, which will enter into force on January 1, 2025, contain a temporary adjustment for securitisation to cushion the impact of the newly introduced output floor that will lead to higher capital requirements for banks using an internal ratings-based approach. Such banks are eligible for a reduced capital surcharge (so-called “p-factor”) for securitised assets until 2032 (applies only to the calculation of the output floor). However, past experience with the original Basel III regulations has shown that the capital market usually “looks through” temporarily relaxed measures. That is, investors tend to focus on fully loaded capital ratios from the beginning, which limits the benefit of transitional rules.27
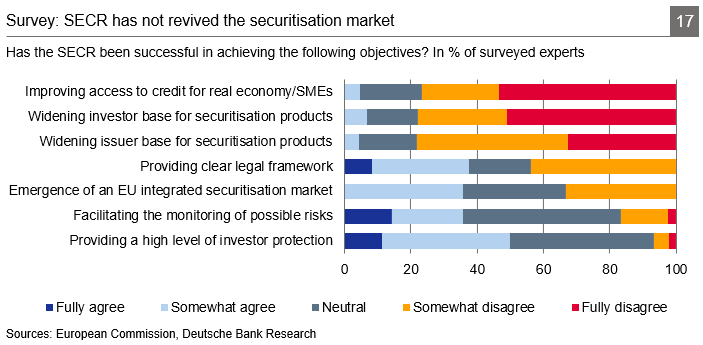
Securitisation in Europe – with the exception of the synthetic segment – has not picked up since the financial crisis, in nominal (let alone real) terms. Repeated regulatory efforts to revitalise the market seem not to be bearing fruit so far. In an expert consultation conducted by the European Commission in 2021 28, about 75% of the respondents said that the SECR has not attained its goals of facilitating access to credit for SMEs and widening the investor and issuer base for securitisation products (Chart 17). To be fair, the regulation has contributed to making the market more robust29 and may have helped to rebuild trust in the instrument per se, e.g. by creating more transparency. More importantly, the regulatory framework has been only one of several market drivers, alongside macroeconomic conditions and the availability of other funding sources.
Cyclical macroeconomic factors – limited issuance because of elevated uncertainty and access to cheap central bank funding. Since the introduction of the SECR in 2019, the securitisation market has been faced with a highly uncertain environment due to the coronavirus pandemic, inflationary pressures, and heightened geopolitical tensions. Already in the years before, unconventional monetary policy with negative interest rates and generous central bank refinancing schemes (i.e. TLTROs, PELTROs) may have slowed down securitisation issuance as it provided banks with a cheap source of funding. On top, slow growth in the European banking sector and ample deposits may have also dampened funding needs. Meanwhile, low interest rates limited the return on securitised assets, thus keeping a lid on demand. Overall, however, the US market has developed robustly under similar macroeconomic conditions, pointing towards other reasons as well.
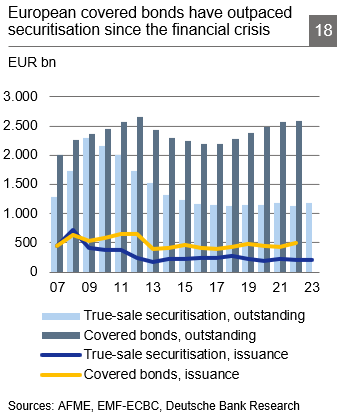
Structural factors – availability of other established funding instruments and regulatory liquidity competitive disadvantage. Another factor holding back securitisation in Europe is the well-established market for covered bonds (Chart 18). These are alternative funding instruments for banks that are also secured by a pool of assets (mostly residential mortgage loans). For investors, covered bonds are appealing in part because of their dual recourse,30 which arguably makes them structurally less risky. For banks, they are easier to issue than securitised products and hence tend to be a cheaper source of funding. However, unlike securitisation, covered bonds are limited to a set of eligible assets and do not allow for transferring the underlying risks off the balance sheet.
Moreover, covered bonds benefit from a more favourable regulatory liquidity treatment than securitisation bonds. Under the current regime, securitisation remains rather inefficient for bank investors in terms of High-Quality Liquid Assets (HQLA) haircuts. A double-A rated covered bond for example attracts a haircut of 7% under current rules, whereas haircuts for STS RMBS and Auto securitisations are 25%, and stand as high as 35% for STS SME and Consumer securitisations. This greatly reduces the incentive for bank investors to buy senior tranches of RMBS and SME securitisations. Higher minimum rating cut-offs and caps also further act to introduce rating cliff risk and hamper the market’s development. The minimum rating required for a securitisation to be included in the HQLA buffer is triple-A versus single-A for covered bonds. An upper cap of 15% on the quantum of securitisation that can form part of the overall HQLA is also in place, whereas no such cap exists for covered bonds. Non-STS bonds are not even contemplated in the LCR framework, i.e., are not eligible.
Regulatory factors on the supply side – capital charges and disclosure requirements. The EU securitisation framework introduced a “non-neutrality” principle for securitised assets on the basis that they are considered to be more risky than other assets.31 First, this includes a capital surcharge – the so-called “p-factor” – on the holding of securitised assets as compared to directly holding the underlying assets.32 Second, there is a minimum risk weight for senior securitisation positions regardless of their rating (10% for STS and 15% for non-STS securitised assets). This can make securitisation unattractive for originators, especially in the case of SRT transactions where the bank often retains the relatively large senior tranche. This has led to different proposals on how to adjust capital requirements to make securitisation more viable while still adequately taking into account the associated risks. The European Supervisory Authorities (ESAs) have recommended reducing the risk weight floor for retained senior tranches.33 The former Governor of the Bank of France, Christian Noyer, has gone even further in calling for adjusting the p-factor in order to approach a regulatory level playing field with the US.34
In addition, originators face comprehensive transparency and disclosure requirements under the SECR. The associated compliance cost may account for a rather small part of the overall cost of a securitisation. Nevertheless, the reporting requirements are widely regarded as too extensive,35 especially in some cases like private deals. The same holds true if securitisation disclosure requirements in Europe are compared to those for other financial instruments, other jurisdictions, and if they are set in relation to their benefit to investors. As a result, ESMA launched a review of the disclosure templates in December 2023.36
Demand side – lack of interest; capital & due diligence requirements. Today, insurers are virtually absent from the securitisation market and hold only 5% of the outstanding amount. An EIOPA analysis shows that only 12% of insurance companies invest at all in securitisation. They held a mere EUR 12 bn in 2021, which equalled just about 0.3% of their overall investments.37 Strict capital requirements laid down in Solvency II are one of the key reasons for this lack of insurance capital participation in securitisation markets.38 The rules have meant European insurance companies are often incentivised to hold lower-rated corporate credit risk over more senior-rated securitisation bonds. For example, under the current regime, a non-AAA rated non-senior STS mezzanine securitisation would attract a spread charge (i.e., essentially a capital requirement) of between 3.1 and 3.5 times an equivalent corporate rating with a duration of 5 years (Chart 19). The spread charges applied to the non-AAA non-STS mezzanine positions are even higher and can be between 4.4 and 12 times as high as the ones applied to corporate bonds with a duration of 5 years. This matters as insurance capital should be an important buyer base for mezzanine European securitisation. Performance history also shows that these positions are over-capitalised relative to their risk.
One of the most critical outcomes of securitisation treatment under Solvency II is that it is more capital efficient to hold a whole pool of loans rather than a senior securitisation tranche of those same assets. For example, a 5-year AAA-rated STS RMBS will incur a capital charge of around 5% for the senior tranche, and 14% for a non-senior tranche. This compares to a spread charge of ca. 3% for instance for a pool of 30-year mortgages with an 80% loan-to-value (LTV), where the investor is exposed to far greater risk of loss.

Other insurance-related aspects include how insurers appear to prefer other assets that supposedly better match their risk-return preferences and asset-liability management. Many insurance companies may also lack familiarity with the instrument. Often, they still perceive securitisation as a complex asset class that requires extensive due diligence (SECR, Article 5).39This results in an “assessment premium” that makes securitisation costly compared to other assets.
Fragmented markets. A lack of harmonised contract and insolvency laws in the EU may contribute further to the muted securitisation market, especially in contrast to the US. On top, the GSE schemes have brought about a certain standardisationof mortgage loans.40Originators typically use large and homogeneous asset pools for securitisations. In Europe, the median deal size was between EUR 458 m (auto loans) and EUR 798 m (corporate loans) in 2021.41Yet the different national contract laws lead to varying asset characteristics (for example mortgage loans with fixed or variable interest rates). Moreover, diverging country-specific macroeconomic risk could play a role as well. As a result, securitisation is often done within national borders. This is to the detriment of smaller EU countries as indicated by the market concentration on large economies, and it reduces EU-wide market size by trapping collateral inside national boundaries.
Other insurance-related aspects include how insurers appear to prefer other assets that supposedly better match their risk-return preferences and asset-liability management. Many insurance companies may also lack familiarity with the instrument. Often, they still perceive securitisation as a complex asset class that requires extensive due diligence (SECR, Article 5).39 This results in an “assessment premium” that makes securitisation costly compared to other assets.
Fragmented markets. A lack of harmonised contract and insolvency laws in the EU may contribute further to the muted securitisation market, especially in contrast to the US. On top, the GSE schemes have brought about a certain standardisationof mortgage loans.40 Originators typically use large and homogeneous asset pools for securitisations. In Europe, the median deal size was between EUR 458 m (auto loans) and EUR 798 m (corporate loans) in 2021.41 Yet the different national contract laws lead to varying asset characteristics (for example mortgage loans with fixed or variable interest rates). Moreover, diverging country-specific macroeconomic risk could play a role as well. As a result, securitisation is often done within national borders. This is to the detriment of smaller EU countries as indicated by the market concentration on large economies, and it reduces EU-wide market size by trapping collateral inside national boundaries.
Market outlook – some growth expected for 2024. European securitisation could pick up slightly this year, especially in the market-placed segment which is expected to reach up to EUR 120 bn 42 (about +30% yoy). This is backed by strong issuance particularly of CLOs and RMBS in the first five months of the year. Total issuance (placed and retained) could again be somewhat over EUR 200 bn. 43 Key drivers are the expiry of large central bank refinancing schemes and rather slow deposit growth, which could make securitisation more relevant as a funding tool for banks. To date, though, this has been primarily limited to UK banks and their use of UK RMBS, rather than euro-area banks’ use of European RMBS. A brightening macroeconomic outlook and expected rate cuts could also be supportive on the supply side as the underlying credit volume might expand.44 However, borrower demand for loans may be dampened in case of higher-for-longer interest rates. These, together with elevated debt servicing cost, are also likely to weigh on some borrowers’ asset quality, which may limit investors’ appetite for securitisation.
Synthetic securitisation could maintain its momentum as it may become more important for banks in view of increasing capital requirements due to the roll-out of the final Basel III rules. Moreover, a higher-for-longer rate environment could also fuel demand as synthetic securitisation offers exposure to high-yield junior tranches.
Regulatory outlook – scaling-up the EU securitisation market is a clear political priority. Strengthening the securitisation market is atop the EU finance ministers’ priority list 45 for the new legislative term. They have asked the Commission to identify supply and demand factors holding back securitisation and to evaluate the adequacy of the regulatory framework. The Commission is currently working out plans how to revive the market and has announced a public consultation in autumn.46 The ESAs’ reviews of the securitisation prudential frameworks for banking 47 and insurance 48 as well as the Noyer report will probably serve as inputs. Targeted reform of the regulatory and prudential framework would be needed in order for securitisation to regain momentum. However, without targeted measures around reduced capital charges for securitisation for banks and insurance companies and liquidity buffer regulation for banks which is competitive with covered bonds, a meaningful pick-up in securitisation volumes will probably remain elusive.
No immediate progress is expected, however, with regards to measures that could reduce market fragmentation such as the harmonization of insolvency rules.
Already underway is the ESMA review of the securitisation disclosure templates that could lead to some simplification in the reporting requirements. Moreover, the final Basel III prudential regulation will enter into force on January 1, 2025. The EBA has been mandated to monitor and present a report on the effects of the new output floor and the related transitional rules on securitisation by end-2026.
Taken together, the new market dynamics as well as current political efforts to revive securitisation – if successfully enacted – are likely to provide new momentum for this critical segment of the European capital market, both in the short and medium to longer term. It comes at a time when banks are faced with rising capital requirements and can no longer draw on ample funding programmes from central banks. As a consequence, securitisation could become a more important refinancing and capital management tool for banks in future. It would help them to free up lending capacity in order to further support the financing of the economy and the ongoing green and digital transition.
For more details on the CMU’s progress, please see Walther, Ursula (2024). Strong risk capital markets. Vital for unlocking green & digital innovations. Deutsche Bank Research, EU Monitor. January 29.
European Council (2024). Special meeting of the European Council (17 and 18 April 2024) – Conclusions. April 18.
The funding function is not its main added value, as banks in a normal funding environment have access to an array of funding sources, including deposits and covered bonds, but it does offer a means of diversifying these sources.
European Commission (2015). Capital Markets Union: an Action Plan to boost business funding and investment financing. Press release. September 30.
AFME (2024a). Securitisation data report Q4 2023 & 2023 full year. March 28.
AFME (2024b). AFME securitisation: Q2 2024. Data Snapshot. August 5.
ESRB (2022). Monitoring systemic risks in the EU securitisation market. July 1
FT (2024). European CLO issuance hits record rate as investors chase yields. June 13.
AFME (2024a).
EU-27, UK, Norway, and Switzerland.
CDO/CLOs not included in this section because collateral cannot be assigned to a country of origin.
Among other criteria, an SRT requires that the originating bank does not hold more than 50% of the total mezzanine or more than 20% of the first- loss tranches.
IACPM (2024). Synthetic Securitization Market Volume 2016-2022. June 25. The findings are based on a survey of 37 global banks.
Bloomberg (2024). Great bank asset sale is a boon for bond market: credit weekly. June 9.
AFME (2020). Questions and answers on a new STS framework for on-balance-sheet securitisations. September 14
ESRB (2023). The European significant risk transfer securitisation market. Occasional paper series No 23. October 3.
Newton, Natalie, and James I. Vickery (2022). The pandemic mortgage boom. In: Economic Insights, Federal Reserve Bank of Philadelphia, 2022, Q3- Q4, p. 18-27.
Latest date available due to data aggregation issues in the US. No market volume for 2022-23.
Levitin, Adam J. (2023). Report on the institutional and regulatory differences between the American and European securitization markets. German Council of Economic Experts, Working Paper 03/2023. November. Other investors include the Federal Reserve system (25%), foreign investors (11%), and other US investors (33%).
Noyer, Christian, et al. (2024). Developing European capital markets to finance the future. Proposals for a Savings and Investments Union. Report commissioned by the French government. April 25.
IACPM (2024).
Fed (2023). Frequently Asked Questions about Regulation Q. September 28.
Fitch Ratings (2024). Synthetic risk transfers reduce US bank RWA, boost alt IM capital deployment. May 29.
European Commission (2015).
Bavoso, Vincenzo (2022). Surviving through crises: An overview of the securitisation regulation and its implementation. In: The Company Lawyer 43 (9).
European Commission (2020). Coronavirus response: Making capital markets work for Europe’s recovery. Press Release. July 24. So-called “Capital markets recovery package”.
Abad, Jose , and Antonio Garcí a Pascual (2022). Usability of bank capital buffers: the role of market expectations. IMF working paper 22/21. January 28.
European Commission (2022). Targeted consultation on the functioning of the EU securitisation framework. Summary report. September 29. 55 responses from financial institutions, public authorities, NGOs, and others like research institutes and individuals.
FSB (2024). Evaluation of the effects of the G20 financial regulatory reforms on securitisation. July 2.
The investor has a claim on both the originating bank as well as the cover pool of assets.
In particular, the capital surcharges are meant to address risks potentially arising from the information asymmetry (model risk) and conflicts of interest (agency risk) between originator and investor.
The p-factor is at minimum 0.3 for banks applying internal models for calculating capital requirements, and 0.5/1.0 for STS/non-STS securitised assets for banks using the standardised approach.
EBA, EIOPA, ESMA (2022a). Joint committee advice on the review of the securitisation prudential framework (banking). December 12.
Noyer et al. (2024).
European Commission (2022); EBA, EIOPA, ESMA (2022a); Noyer et al. (2024); and AFME (2021). Securitisation as an essential tool for Europe’s economy. September 17.
ESMA (2023a). Consultation paper on the securitisation disclosure templates under Article 7 of the Securitisation Regulation. December 21.
Only insurers using the standard formula. See EBA, EIOPA, ESMA (2022b). Joint committee advice on the review of the securitisation prudential framework (insurance). December 12.
The current revision of Solvency II, which has yet to be adopted by the Council, will request the Commission to review the capital requirements for insurers’ investments in securitisation.
EIOPA (2023). Investment of insurers and reinsurers in securitisations. April 25.
Levitin (2023). Also Mack, Sebastian (2024). Handle with care. How Europe can reap the benefits of securitisation. Hertie School/Jacques Delors Centre Policy Brief. March 22.
ESMA (2023b). The EU securitisation market – an overview. September 21.
Deutsche Bank Research (2024). European securitisation mid-year 2024 outlook. June 3.
For example, Morningstar and DBRS expect total European securitisation issuance to remain largely stable in 2024 at EUR 210-220 bn.
Euro-area banks expect corporate loan demand to pick up in Q3 compared to the previous three months, following seven consecutive quarters of decline, according to the ECB’s bank lending survey.
European Council (2024). Statement of the Eurogroup in inclusive format on the future of Capital Markets Union. March 11.
European Commission (2024). Keynote speech by Commissioner McGuinness at International Capital Market Association annual meeting. May 22.
EBA, EIOPA, ESMA (2022a).
EBA, EIOPA, ESMA (2022b).