This policy brief is based on the following paper: Goulet Coulombe, P., Göbel, M., and Klieber, K. (2024). Dual interpretation of machine learning forecasts. Available at SSRN 5029492.
Abstract
Debates about the future trajectory of economic conditions are often framed through the lens of historical analogies. Pundits and analysts alike commonly refer to past events, arguing about their relevance as representations of current circumstances. In this note, we demonstrate that black-box machine learning algorithms can similarly contribute to such discussions. While these models are typically interpreted through the aggregate contributions of included variables, we show that their predictions can alternatively be understood as a portfolio—a weighted average of various historical events from the training sample. This perspective provides economic analysts with a gateway to explain machine learning and econometric forecasts to policymakers as quantifiable combinations of historical analogies.
Machine learning (ML) predictions are typically interpreted as the sum of contributions of predictors. Yet, forecasters often speak in terms of historical analogies—how current conditions resemble past economic events. As it turns out, there is no need to translate: ML algorithms already speak this language.
Each out-of-sample prediction can be expressed as a linear combination of in-sample values of the predicted variable, with weights corresponding to pairwise proximity scores between current and past economic events. As shown by Goulet Coulombe et al. (2024), these proximity weights arise naturally from a wide range of models without further calculations, e.g., (kernel) ridge regression, random forest, boosted trees, and neural networks. This is also true of linear econometric models often used for forecasting, such as factor-augmented autoregressions.
The key lies in the dual solution to least squares-based problems, which provides a mathematical foundation for interpreting forecasts as weighted combinations of historical observations. For readers interested in the technical aspects, we refer to Goulet Coulombe et al. (2024). Intuitively, the weights indicate how closely the information in the test data–used to make one specific prediction—resembles the information from each historical period in the training sample. While some models (e.g., random forest) constrain weights to be positive, capturing only similarities, others accommodate both similarities and dissimilarities with the past. Regardless of the approach, the weights represent the attention assigned to each period covered by the in-sample data when formulating an out-of-sample prediction.
We suggest two ways to excavate the proximity information from a model. First, we look at the weights themselves. Second, applying them to the training observations of the target variable allows us to decompose a prediction into contributions from specific historical points. Summing these contributions creates a time series that precisely matches the prediction, offering a clear and intuitive explanation of how ML forecasts link past and present.
For the first stages of the inflation surge in the US many forecasting models underestimated the mounting upward pressures and failed to issue timely warnings of what was coming. Comparing predictions of different models (see Figure 1) in 2021Q1 reveals that those able to identify the surge in inflation already during 2021 progressively upweight the second inflation spike of the 1970s, followed by the first. One such model is the HNN (Goulet Coulombe, 2024), a neural network model building on a nonlinear Phillips curve. As presented in the lower panels of Figure 1, HNN’s prediction receives positive contributions from the late 1970s, with the highest (raw) weight in 1979Q2 at the beginning of the second oil crisis.
In contrast, lagging models, such as the tree-based boosting algorithm (Light Gradient Boosting Machine – LGB in Figure 1), align themselves with the “transitory inflation” narrative, projecting only modest deviations above the 2% target. As illustrated by the green line below, LGB predicts a return to business as usual as the most likely outcome, primarily by assigning greater weight to the last 30 years of the sample—an era characterized by low and stable inflation.
By 2022Q2, when inflation peaked, both models have their eyes set on the 1970s by assigning high weights to this high-inflation period. This alignment is unsurprising, as the supply-driven nature of the recent inflation surge and energy price jumps mirrored the dynamics of 1973 and 1979–80. Moreover, the historical context of accommodative monetary policy during these inflationary periods provides valuable insights for understanding the recent surge (Gagliardone and Gertler, 2023; Ball et al., 2022).
Figure 1. Dual Interpretation of US Inflation Forecasts
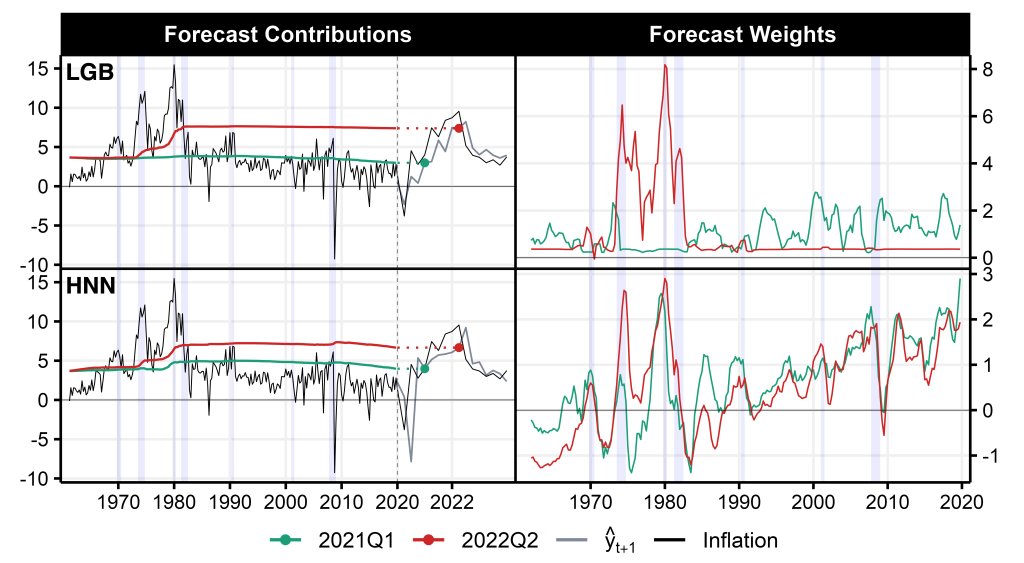
Notes: The figure presents results from predicting US CPI inflation one step ahead. The predictions in the upper panels are based on a Light Gradient Boosting Machine (LGB) while those presented in the lower panels are generated by Goulet Coulombe (2024)’s Hemisphere Neural Network (HNN). The left panels present the cumulative sum of forecast contributions over the training sample (1961Q2 to 2019Q4), which collectively sum to the final predicted value shown as dots. The holdout sample ranges from 2020Q1 to 2024Q1, indicated by the dashed line. The right panels show forecast weights as a moving average of four quarters scaled by the mean of absolute weights. Lavender shading corresponds to NBER recessions.
Debates about whether the US economy is on the brink of recession have intensified since the Federal Reserve began its tightening cycle in 2022. These concerns deepened following the August 2024 jobs report, which triggered the Sahm rule (Sahm, 2019) and signaled heightened recession risks. For early 2025 GDP growth, models disagree in their assessments of historical proximities, mirroring the divide among professional forecasters.
Pessimistic models, as for example neural networks (NN), project a mild contraction by 2025Q1(based on data through 2024Q1). As shown in the upper panels of Figure 2, they draw parallels to the Global Financial Crisis (GFC), the 1990s recession, and the early 1980s. The connection to the GFC arises from elevated uncertainty amidst strong momentum in stock markets. Financial conditions and market dynamics have been shown to be important for forecasting real activity, particularly in relation to downside risks (Adrian et al., 2019; Amburgey and McCracken, 2023). The early 1980s provide another apt parallel, given the rapid and sustained monetary tightening cycles in both periods to combat high inflation. While the US economy has shown resilience, the speed and magnitude of the current tightening cycle (Kwan and Liu, 2023) offer some ground for leveraging similarities.
More optimistic models, such as ridge regression (RR, lower panels of Figure 2), project future growth near its historical average over the last 50 years. These predictions derive from low weights throughout the training sample and show some offsetting effects within the weighting schemes.
Figure 2. Dual Interpretation of Post-Pandemic GDP Growth
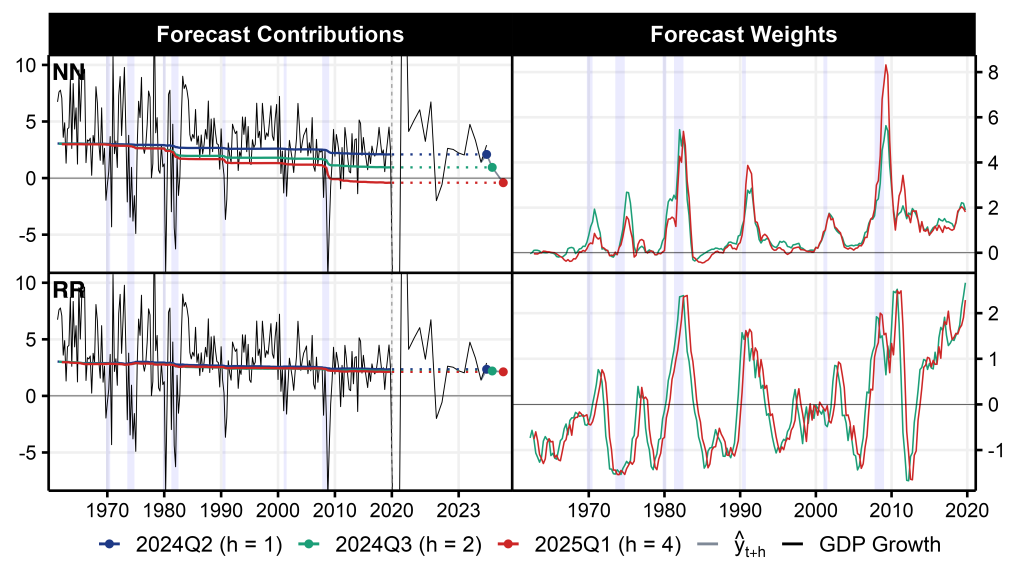
Notes: The figure presents results from predicting GDP growth one, two, and four steps ahead. The predictions in the upper panels are based on a standard feed-forward neural network (NN) while those presented in the lower panels are generated by a ridge regression (RR). The left panels present the cumulative sum of forecast contributions over the training sample (1961Q2 to 2019Q4), which collectively sum to the final predicted value shown as dots. The holdout sample ranges from 2020Q1 to 2025Q1, indicated by the dashed line. The right panels show forecast weights as a moving average of four quarters. Lavender shading corresponds to NBER recessions.
We often rely on historical analogies to understand current economic conditions, comparing the present with the past. Proximity weights offer a structured way to quantify these similarities and dissimilarities, revealing the parallels that models are leveraging to produce their forecasts. One of the major obstacles to the adoption of machine learning models in central banking is their lack of transparency, and this tool significantly helps mitigate that challenge.
Adrian, T., Boyarchenko, N., and Giannone, D. (2019). Vulnerable growth. American Economic Review, 109(4):1263–89.
Amburgey, A. J. and McCracken, M. W. (2023). On the real-time predictive content of financial condition indices for growth. Journal of Applied Econometrics, 38(2):137–163.
Ball, L., Leigh, D., and Mishra, P. (2022). Understanding us inflation during the covid-19 era. Brookings Papers on Economic Activity, 2022(2):1–80.
Gagliardone, L. and Gertler, M. (2023). Oil prices, monetary policy and inflation surges. NBER Working Paper, w31263.
Goulet Coulombe, P. (2024). A neural phillips curve and a deep output gap. Journal of Business & Economic Satistics, (forthcoming).
Goulet Coulombe, P., Göbel, M., and Klieber, K. (2024). Dual interpretation of machine learning forecasts. Available at SSRN 5029492.
Kwan, S. H. and Liu, L. (2023). Financial market conditions during monetary tightening. FRBSF Economic Letter, (3).
Sahm, C. (2019). Direct stimulus payments to individuals. Recession Ready: Fiscal Policies to Stabilize the American Economy, pages 67–92.