This Policy Brief is based on Arrigoni, Bobasu, and Venditti (IMF Economic Review, 2022). The views expressed are solely those of the authors and do not necessarily reflect the views of the European Central Bank, the Bank of Italy, or the Central Bank of Ireland.
This Policy Brief explores the effectiveness and comparative performance of different approaches to constructing Financial Conditions Indices (FCIs) for a broad range of countries. An econometric evaluation, conducted through quantile regressions and probit models, shows that FCIs constructed via equal weights combinations of financial variables have good statistical properties and often outperform more sophisticated methods such as factor models with time-varying parameters and principal component analysis.
These findings will be of particular interest for researchers and institutions interested in monitoring financial conditions for a large number of economies, including those for which data is too short or presents too many irregularities to be treated through more formal econometric methods.
The concept of financial conditions, a summary measure of how easily firms, households, and governments finance themselves, is crucial in both financial stability and monetary policy monitoring. Financial conditions indices (FCIs) summarize in a single indicator the information coming from different segments of the financial sector. These indices differ in terms of the underlying variables and the methodology used to combine them, ranging from more to less sophisticated approaches.
In the context of financial stability, FCIs provide valuable information regarding future risks to economic activity and can be used to appropriately calibrate macro-prudential tools. As for monetary policy, FCIs are often used by monetary policy makers to study the broad effects of monetary policy on financial markets (Arnaut and Bauer, 2024) and as a barometer of risk appetite in financial markets.
When building a FCI the key questions are: which indicators should an FCI include? How should these indicators be weighed? We address these questions by constructing and comparing different financial conditions indices for a wide panel of countries. We find that those that are simpler to estimate and interpret also perform well in predicting risk to economic activity and outperformed more sophisticated measures. The indices can be used for a wide range of analysis and are freely available to download at https://www.simone-arrigoni.com/fci-data. As a follow-up to the publication of Arrigoni, Bobasu, and Venditti (2022), we have recently updated and extended our sets of FCIs, which now reach February 2024.
The concept of financial conditions is often associated with leverage: loose (tight) financial conditions favor (limit) the build-up of leverage. While measuring leverage is relatively straightforward, financial conditions are an elusive concept, and the question of how to measure them has spurred a large literature. A widely accepted interpretation is that financial conditions reflect the price of risk and that this compensation for risk plays a key role in the fluctuation of asset prices.
Against this background, the level of sophistication in constructing financial conditions indices has increased over time. However, sophisticated models, such as for instance factor models with time varying parameters, may be prone to some flaws. First, these techniques are designed to reduce information dimensionality in datasets that are characterized by high collinearity. Yet, the series that enter popular measures of financial conditions show heterogeneous behavior. Second, they do not allow for control over the sign of individual components, which limits economic judgment of dynamics that can have different effects in different countries. For example, a depreciation of the exchange rate could signal a tightening or an easing of financial conditions according to whether the financial channel (i.e., increase of the cost of debt in domestic currency) or the standard trade channel is more relevant for a given country. In Emerging Market Economies, the financial channel is predominant, thus the exchange rate depreciations contribute to tighten the FCI. Instead, for Advanced Economies, the usual trade channel applies, meaning a depreciation of the national currency eases financial conditions. Third, the weight that the single indicators receive reflects the nature of past shocks and crises. This can reduce substantially the importance of variables that are interesting to monitor.
Can equal weights averages provide a better indicator? We argue that averaging with equal weights produces FCIs that are not inferior to, and often perform better than, those constructed with more sophisticated statistical methods, addressing the issues raised above. This method has a long tradition in the forecasting literature, preserves heterogeneity and relevance of each component, allows for the diversification of signs of components based on economic judgment (e.g., exchange rate) and eliminates parameter estimation uncertainty. Moreover, it enables an easy decomposition of the index into its drivers, and it is a convenient way to address issues like short data and series irregularities, a pressing concern when working with emerging markets data.
We base the FCIs on a common information set composed of nine variables, namely (i) nominal long-term government bond yields; (ii) a set of four spreads, i.e., sovereign (for emerging economies only), corporate (for advanced economies only), inter-bank and term spreads (for all countries); (iii) realized equity volatility; (iv) the percentage change of equity and real residential house prices; (v) the growth rate of credit to households and non-profit institutions serving households; (vi) the bilateral exchange rate with the US dollar. All variables are standardized before aggregation. We construct three sets of FCIs based on this common information set using different aggregation techniques, as follows:
(i) EW-FCI (Equal Weights-FCI), constructed by aggregating the chosen indicators as simple (unweighted) averages.
(ii) PCA-FCI (Principal Component Analysis-FCI), constructed by aggregating the indicators through principal component, extracting the first one as the FCI. This aggregation method is widely used in the construction of FCIs (Kliesen et al., 2012; IMF, 2019).
(iii) TVP-FCI (Time-Varying Parameters-FCI), which summarizes the indicators through a (single) factor model with time-varying parameters, following Koop and Korobilis (2014) and Arregui et al. (2018).
Each set of FCIs is constructed for at monthly frequency for 18 countries, covering approximately 70% of world’s GDP PPP.
Visual inspection suggests that the PCA-FCI and TVP-FCI may behave counter-intuitively at times. The question is whether these methods offer statistical properties that make them preferable to simpler alternatives like equal weights averaging. In this section we show that this is not the case. The EW-FCI delivers more accurate out-of-sample predictions of downside risks to economic activity and proves to be a better predictor of banking crises.
Quantile regressions. The quantile regression approach provides a framework for estimating the impact of a given variable X on the entire conditional distribution of a dependent variable y. Following Adrian et al. (2019), we use quantile regressions to test the ability of the three alternative financial conditions indices to signal downside risk to economic activity and we rank them accordingly. We find that the EW-FCI fails the least to detect a significant relationship. A more stringent test for the usefulness of the FCIs is their ability to detect risks out-of-sample, i.e., to signal coming recessions in real time. We compute predictive scores as the predictive distribution generated by the model and evaluated at the realized value of the time series. The higher the predictive scores, the more accurate the out-of-sample prediction. Figure 1 shows that the EW-FCI is ranked first in 10 out of 19 cases. The key finding of this analysis is that the EW-FCI performs at least as well as or better than alternative indicators in capturing in-sample downside risks and significantly outperforms them in out-of-sample predictions. In both exercises, neither the Chicago Fed NFCI for the USA nor the CISS for the euro area, widely used in macroeconomic analysis, show a superior predictive power.
Figure 1: Rank of predictive scores of out-of-sample performances
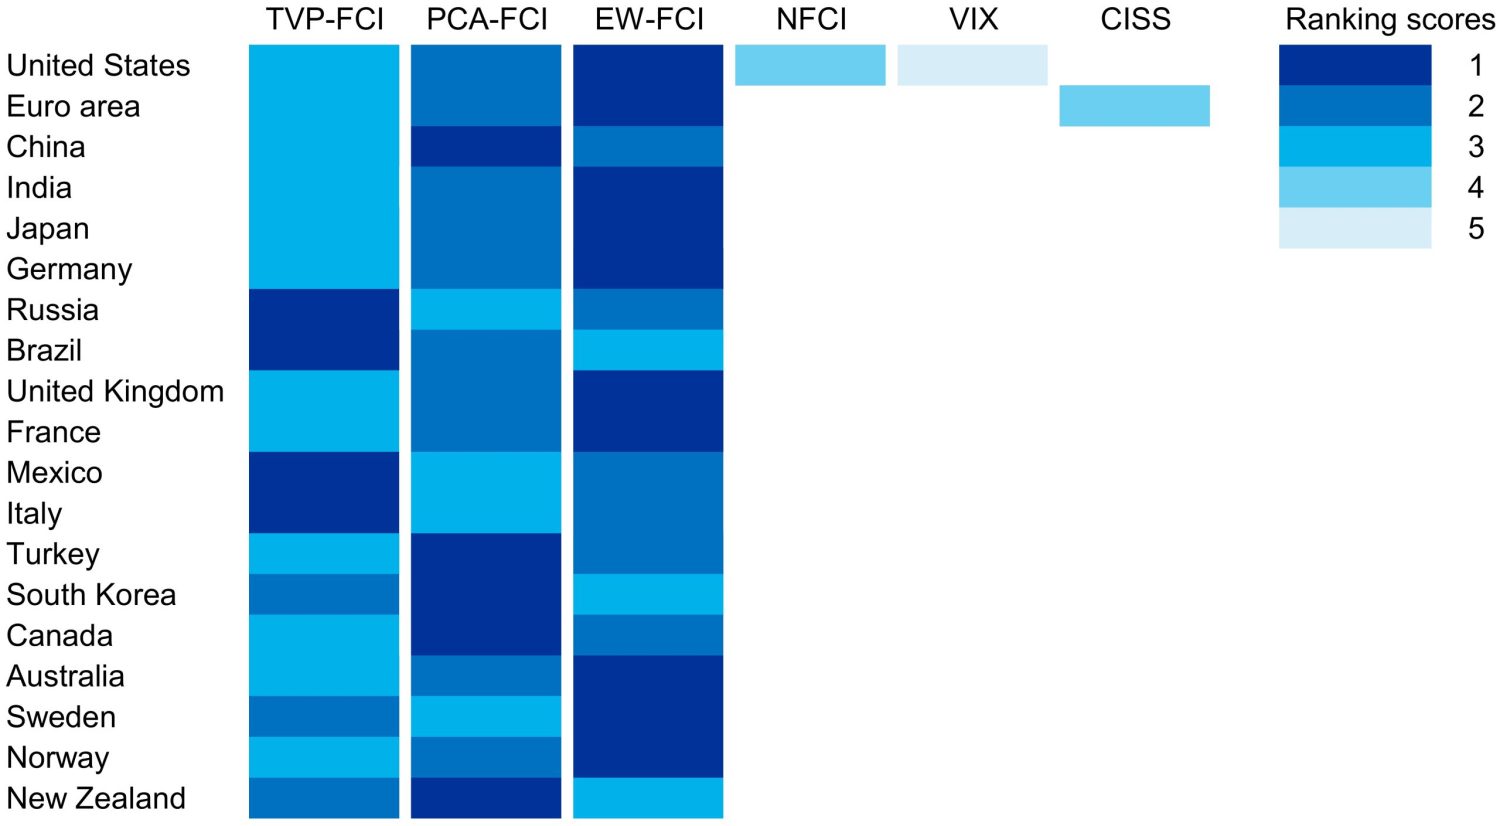
Notes: The figure reports the predictive scores of the Probability Integral Transform (PIT). The out-of-sample predictive scores of the predictive distribution for industrial production growth are conditioned on each FCI at a time, a constant, and a lag of industrial production growth. The color coding defines the score ranking by country: the index that performs best the highest number of times is colored dark blue and ranked 1, the next one lighter blue and ranked 2, and so on with the lowest number of cases being colored the lightest blue and ranked 5. Countries are ordered by GDP PPP shares, except for the USA and the euro area.
Probit. As a second criterion for assessing the informational content of the three competing indices, we consider their ability to predict systemic banking and currency crises. We estimate a panel probit model, using crisis data from Laeven and Valencia (2020), our FCIs, and a set of controls.1 With the exception of the PCA-FCI, the coefficients associated with the FCIs show a positive relationship (i.e., a tightening in financial conditions at time t−1 increases the probability of a banking crisis at time t). However, the EW-FCI is the only FCI that demonstrates both statistical and economic significance. For a graphical comparison of the models, Figure 2 plots the receiver operating characteristic (ROC) curves for each of the models. In predicting systemic banking crises, the EW-FCI significantly outperforms both the TVP-FCI and PCA-FCI models. Nevertheless, in case of currency crises, formal tests do not find statistically significant differences among the alternative models.
Figure 2: Comparison of ROC curves for each model
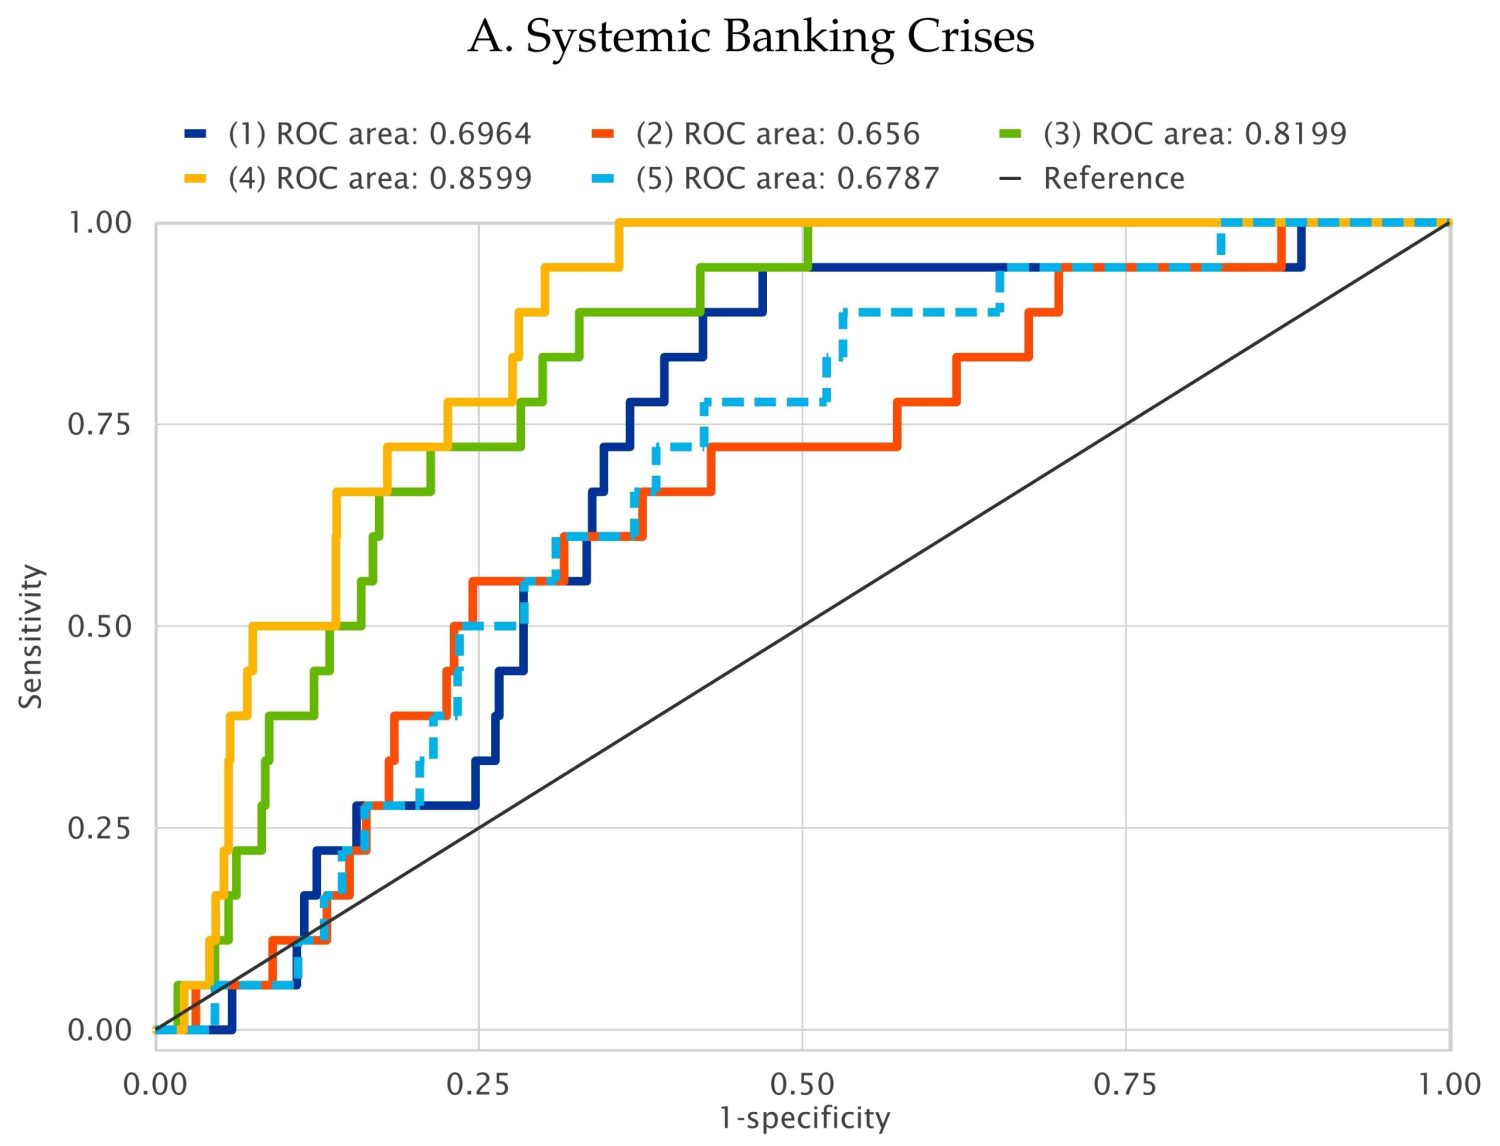
Notes: The ROC compares the true positive, i.e., the probability of a crisis according to the model when there is a crisis (sensitivity), against false positives, i.e., the estimated probability of a crisis when there is not a crisis (specificity). The ROC curve of a random choice model is the 45 degrees line. The area below the ROC curve (AUROC) can be interpreted as a measure of accuracy of a binary model. The higher the AUROC, the better the model. Lines represent the ROC curves for each of the models. The blue line refers to the model including TVP-FCI, the red line to the model including PCA-FCI, the green line to the model including EW-FCI, the yellow line to the model including all three FCIs, and the light blue line to the model including only controls and excluding any type of FCIs.
Having assessed the performances of the FCIs, we can examine the evolution at the global level focusing on the EW-FCI. We have recently updated and expanded our sets of financial conditions indices, now covering the period from January 1995 to February 2024.
Figure 3 shows the evolution of financial conditions since 1995 across Advanced (including euro area) and Emerging Market Economies. Aggregate indices generally co-move highlighting major global shocks such as the global financial crisis. However, FCIs reflect major area-specific shocks too, such as the Asian financial crisis for emerging markets or the European debt crisis for the euro area. Additionally, the figure shows heterogeneity across countries in the sample, as reflected by the min-max range (light gray area).
Since the last update (data up to May 2020 as in Arrigoni, Bobasu, and Venditti, 2022) both Advanced Economies and Emerging Market Economies experienced an easing of financial conditions following the first Covid wave until early 2021. Subsequently, FCIs tightened in the context of the surge in inflation and the Russian invasion of Ukraine. The peak was reached in mid-2022, after which financial conditions have been easing. Notably, the magnitude of the tightening has been stronger in Advanced Economies compared to Emerging Market Economies.
Figure 3: Evolution of financial conditions
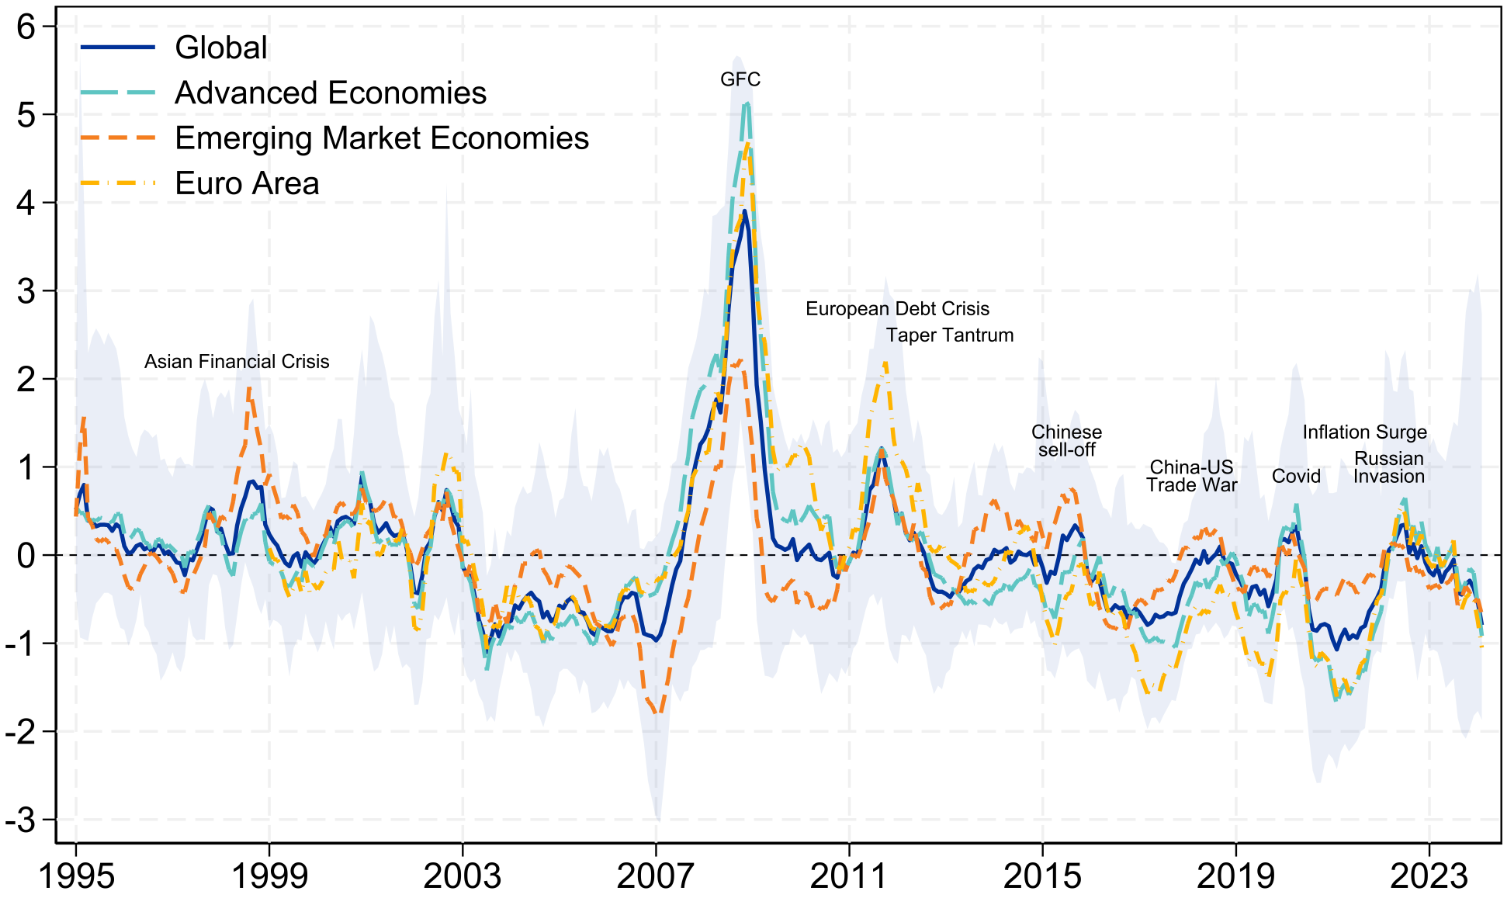
Notes: Indices in deviations from its historical mean. Higher values signal tighter financial conditions. Country level FCI are aggregated using GDP PPP shares as weights. The light gray area shows the min-max range of country FCIs. Advanced Economies include Australia, Canada, France, Germany, Italy, Japan, New Zealand, Norway, South Korea, Sweden, United Kingdom, United States. Emerging Market Economies include Brazil, China, India, Mexico, Russia, Turkey. Euro area comprises France, Germany, Italy. Latest observation: February 2024.
An econometric evaluation, based on a large sample of countries, shows that FCIs obtained via equal weights combinations of financial variables have good statistical properties. They overall outperform alternative measures based on principal component analysis or factor models with time-varying parameters. The results hold both in the context of quantile regressions, where they prove useful in signaling downside risks to economic activity, as well as in probit models, where they show a stronger correlation with future banking crises. Importantly, for the euro area and for the USA, these simple indices outperform popular alternatives based on larger information sets and on different econometric methods, namely the Composite Index of Systemic Stress (CISS) for the euro area and the National Financial Conditions Index (NFCI) published by the Chicago Fed for the USA.
We believe these results will be of particular interest for researchers and institutions interested in monitoring financial conditions in a large number of economies, including those for which data are too short or present too many irregularities to be treated through more formal econometric methods.
Adrian, T., N. Boyarchenko, and D. Giannone, (2019). “Vulnerable growth,” American Economic Review, vol.109(4), pp.1263–1289.
Arnaut, Z., and M. Bauer, (2024). “Monetary policy and financial conditions,” FRBSF Economic Letter, available here.
Arregui, M. N., S. Elekdag, M. R. Gelos, R. Lafarguette, and M. Seneviratne, (2018). “Can countries manage their financial conditions amid globalization?,” International Monetary Fund Working Paper.
Arrigoni, S., A. Bobasu, and F. Venditti, (2022). “Measuring financial conditions using equal weights combination,” IMF Economic Review, vol.70(4), pp. 668–697.
IMF (2019). “Global financial stability report: lower for longer,” International Monetary Fund, (October)
Kliesen, K. L., M. T. Owyang, and E. K. Vermann, (2012). “Disentangling diverse measures: a survey of financial stress indexes,” Federal Reserve Bank of St. Louis Review, vol.94(5), pp.369–397.
Koop, G., and D. Korobilis, (2014). “A new index of financial conditions,” European Economic Review, vol.71, pp.101–116.
Laeven, L., and F. Valencia, (2020). “Systemic banking crises database II,” IMF Economic Review, vol.68, pp. 1–55.
Growth rate of inflation and of real GDP, the level of real credit from banks to the private non-financial sector and the growth rate of real domestic and foreign credit.