menu
close

Author(s):

Philippe Goulet Coulombe | Université du Québec à Montréal

Keywords:

machine learning , inflation , neural networks , output gap , filtering

JEL Codes:

With most central banks around the world operating a fast tightening of monetary policy, increasing the risks of recession, the public and economic pundits alike wonder: should have we seen this coming, and should (a slower) tightening have begun long ago? Of course, the additional surge in inflation in 2022 is largely attributable to the war in Ukraine. On the other hand, the various factors behind the 2021 (and still ongoing) price increase are more nebulous, which has fueled the famous debate between transitory or persistent inflation – visibly won by the second camp. These crucial questions in the conduct of monetary and fiscal policy stem from the fundamental difficulty of measuring the difference between aggregate supply and demand. This brief is about a new machine learning-based method to calculate the contentious quantity.

A New Approach Based on AI

Statistical models traditionally used in macroeconomics have been unable to predict the surprising persistence of recent high inflation rates. If anything, their findings backed misguided confidence that the upward inflation trajectory would not last (Borio, 2022). In A Neural Phillips Curve and a Deep Output Gap (Goulet Coulombe, 2022), a new artificial intelligence (AI) model is introduced. It allows for both forecasting and, more importantly, understanding inflation. The opacity of AI models is notorious, which makes them difficult to use by economists and public decision-makers. This new algorithm, baptized Hemisphere Neural Network (HNN), incorporates a minimal dose of macroeconomic theory. The various sections of the network can be extracted and understood as fundamental economic quantities. In particular, they can extract the inflationary expectations of economic agents as well as economic slack – i.e., the gap between aggregate demand and supply. These are essential for the conduct of monetary policy. Among other things, they can discern whether certain upward pressures will be transitory or persistent.

In short, the new methodology explains much of the 2021 and 2022 inflation surge by a large gap between the economy’s demand and its production capacity. More concretely, in its understanding of the pressures of the real economy on the price level, HNN discards classic indicators such as the unemployment rate (UR) and the gross domestic product (GDP) in favor of others that are more sensitive to labor shortages – namely, vacancies and hours worked. By doing so, HNN does not foresee the price surge in 2021 as temporary, in contrast to most traditional econometric methods.

Past and Future Forecasts

Figure 1 reports US inflation forecasts from different models. Clearly, HNN and HNN-F (a variant of the former) are better able to capture the price level increase in 2021. The difference between the forecast for 2022Q1 inflation (January to March) and the realized value is attributable to an unpredictable upside shock due, inevitably, to the dramatic increase in the price of several commodities and other economic repercussions of the Russian invasion of Ukraine. Similarly, for overly “pessimistic” forecasts following the dip of 2020, HNN and other econometric methods like CKP (Chan, Koop, and Potter, 2016) were not communicated that the downturn is attributable to an unprecedented government-induced economic shutdown (i.e., a very different kind of recession), and a careful use of the model would have discarded the predicted downward spike.

Unlike the four quarters of 2021, the forecasts for 2022Q2 (6% and 6.7% for HNN-F and HNN respectively) were roughly aligned with the median of US professional forecasters (Survey of Professional Forecasters, SPF) and econometric methods reported in Figure 1. This is partly explained by the fact that the unemployment rate in the United States was 3.6% in April 2022, only 0.1% above the pre-pandemic level, which itself was the lowest observed value since the 1960s. Thus, the economic pressures suggested by classical econometric models are now more aligned (with approximately a 12 months lag) with those of HNN (see Figure 2).

Figure 1: Out-of-sample forecasts of quarterly inflation in the United States from 2007Q1 to 2022Q2.

 width=

Note: Target is the actual observed value. CKP (Chan, Koop, and Potter, 2016) is a standard econometric model using, among other things, a filtered version of the unemployment rate as a proxy for real activity pressures on inflation. HNN and HNN-F are AI-based models built at the Chair. PC+ is a model based on the unemployment rate, the forecasts of American professional forecasters, as well as a survey of household inflation expectations. Recessions as defined by the NBER are shaded pink.

The HNN-F forecast for 2022Q3 is 5.5%, which is 1% above the SPF median. The plain HNN forecast is much higher, which is well above the SPF prediction but in line with traditional methods that are finally catching up with recent inflation highs. It is important to remember that, unlike most publicly available economic forecasts (such as those from various banks), the models reported here formulate a forecast based solely on historical statistical associations between variables and use information available up to 2022Q2. Consequently, the upside risks for the forecast include shelter inflation, which makes up about 30% of U.S. CPI. The last time shelter inflation was at comparable rates in the early 80s, the Bureau of Labor Statistics used a different methodology. Many believe methodological issues will keep shelter inflation high, and HNN nor HNN-F have no way of knowing that. Sizeable downside risks – for CPI, not core CPI which itself appears to still be on an upward trajectory – include rapidly deflating energy costs (brought about in part because of unprecedented flooding of oil by the U.S. Strategic Petroleum Reserve) and a strengthening dollar (the USD recently broke parity with the Euro for the first time in decades and is unusually strong for a period of high inflation). Given the information already available on 2022Q3 as of early September 2022, downside risks appear more likely to materialize.

2021 and 2022Q1-Q2 Analysis

The results of the paper are here updated with quarterly data including up to the second quarter of 2022. Here are four key observations based on a model estimated on data through 2019Q4. The early truncation aims to ensure that the model does not simply mimic recent inflation readings ex-post (i.e., to avoid “overfitting” in machine learning jargon).

Figure 2: The output gap and its coefficient.

 width=

Note: CBO is the output gap estimate made public by the Congressional Budget Office. CKP (Chan, Koop, and Potter, 2016) is a standard econometric model estimating the difference between the unemployment rate and its “natural” rate using filtering methods. Recessions as defined by the NBER are shaded pink. The beginning of the out-of-sample period corresponds to the dotted line.

First, contrary to what the CBO and traditional filter-based econometric approaches suggest, the AI-modeled gap is well above zero for most of 2021, as well as 2022. The CKP approach (Chan, Koop, and Potter, 2016) only aligns with HNN starting from 2022Q1. Second, when estimated using this new approach, the Phillips curve coefficient (i.e., the relationship between real activity and inflation), does not display the typical finding that it has been extremely low over the past decades. This means that the link between economic activity and inflation was not dead, but simply in apparent hibernation – explaining the sharp rise in prices in the last 18 months in the US. Of course, it now aligns with some recent papers revising (ex-post) the natural rate of unemployment upward (Crump et al., 2022), or arguing for alternative measures of slack more aligned with the supply side of the labor market (Domash and Summers, 2022).

Third, the reasons for CKP- and CBO-based forecasts continuously underestimating inflation in 2021 are clear. If anything, their “forcing” variables were negative all along. In other words, if, in those two models, real activity was contributing at all to the forecast, it was pushing it downwards.

Finally, in (Goulet Coulombe, 2022), it is shown one can examine HNN(-F) and discover which variables underlie the best predictions. It turns out to rely, intuitively, on a non-linear transformation of a vacancy index — which remains very high as of 2022Q2. In Figure 3, it is quite clear that unemployment rate and vacancies may sometimes follow each other closely (like the 1990s and early 2000s), but other times they do not. One particularly noteworthy episode of discordance is the last two years. This partly explains why HNN picked up early on the 2021 inflation surge: it relied heavily on the red line whereas typical Phillips curve use the blue one or variants of it.

Additionally, it is found that HNN puts a significant weight on the number of hours worked. This is interesting because typical measures of economic slack rely on an indicator of how many people (like employment and unemployment) rather than how much. Hence, by incorporating information on vacancies and hours, and transforming them using the neural network, we can get an alternative measure slack which was clearly disproving the transitory inflation hypothesis in 2021.

Figure 3: Scaled and rotated vacancy index and unemployment rate.

 width=

Note: More precisely, each variable is transformed to have mean zero and variance one, then unemployment is rotated by multiplying by -1.

Concluding Remarks

More generally, this work shows economists can use deep learning to construct economically interpretable forecasts which can inform policy. While the proposed algorithms have several virtues, it is best coupled with expert judgment to provide optimal forecasts, especially in highly unusual times. The algorithms underlying this brief are all public and can be readily adjusted and used for applications to other economies.

References

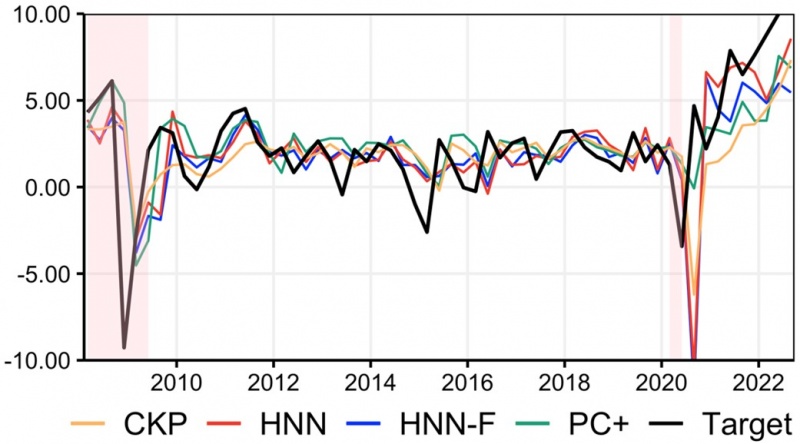
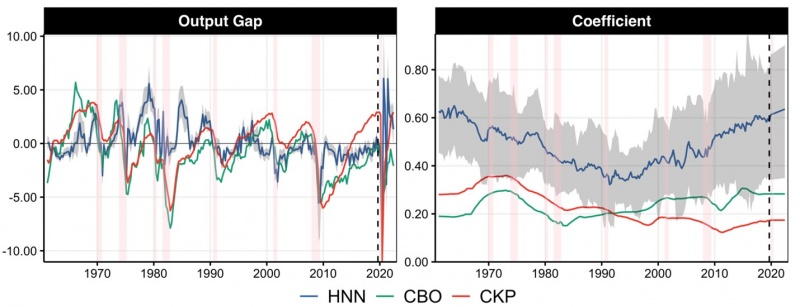
Goulet Coulombe, Philippe. “A Neural Phillips Curve and a Deep Output Gap.” Available at SSRN (2022).

Chan, Joshua CC, Gary Koop, and Simon M. Potter. “A bounded model of time variation in trend inflation, NAIRU and the Phillips curve.” Journal of Applied Econometrics 31.3 (2016): 551-565.

Borio, C. (2022). “Policy panel: Monetary policy, policy interaction and inflation in a post-pandemic world with severe geopolitical tensions”, speech at 35th SUERF Colloquium: The Return of Inflation? – Call for Papers, May 23rd 2022.

Crump, Richard K., et al. The Unemployment-Inflation Trade-off Revisited: The Phillips Curve in COVID Times. No. w29785. National Bureau of Economic Research, 2022.

About the authors

Philippe Goulet Coulombe

Philippe Goulet Coulombe is a professor of economics at the Université du Québec à Montréal (UQÀM) and is responsible for the Macroeconomic Observatory axis of the Chair in Macroeconomics and Forecasting at UQÀM. He conducts several research projects at the intersection of machine learning, econometrics, and macroeconomic analysis. In several recent works, he introduces new learning algorithms adapted to the particularities of macroeconomic and financial data, and allowing an increased interpretability in a time series context. He also conducts work on econometric climate modeling, particularly the forecasting of sea ice melt in the Arctic Ocean. He holds a Ph.D. in Economics (2021) from the University of Pennsylvania.

More on these topics

Tags: