As part of the Eurosystem’s annual banknote production planning, the national central banks draw up forecasts estimating the volumes of national-issued banknotes in circulation for the three years ahead. To date, the national central banks of France, Germany, Italy and Spain (“4 NCBs”) have been using ARIMAX models to forecast the banknotes issued nationally in circulation by denomination (“benchmark models”). This paper presents the structural time series models developed by the 4 NCBs as an additional forecasting tool. The forecast accuracy measures used in this study show that the structural time series models outperform the benchmark models currently in use at each of the 4 NCBs for most of the denominations. However, the statistical informative value of this comparison is limited by the fact that the projection period is only twelve months.
Every year the national central banks of the Eurosystem (“NCBs”) and the European Central Bank (ECB) are involved in a joint procedure to define the banknote production requirements. For each denomination, it is necessary to forecast net issuance, defined as the difference between withdrawals from and lodgements to NCBs, and the quantity of fit banknotes retrievable through sorting activity.1 Avoiding shortages or excessive surpluses of banknotes, both at country level and for the euro area as a whole, is crucial in enabling the Eurosystem to provide credit institutions and citizens with the quantity demanded, to guarantee the quality of cash in circulation, and to pursue cost efficiency.
All of the models that have been proposed since the euro cash changeover fall within the family of traditional time series econometrics techniques and make rather strong assumptions about the properties of the time series to be analysed and predicted. In order to overcome some of these weaknesses, the NCBs of France, Germany, Italy and Spain (“4 NCBs”) have estimated Structural Time Series Models (“STSMs”) to forecast the net issuance of euro banknotes by denomination for each country involved in the project. This paper presents the forecasts for each denomination of euro banknotes separately for the four countries involved in the project, and a comparison against the results obtained with the benchmark models currently in use. At first, we illustrate euro banknote circulation.
Euro banknote circulation, defined as cumulated net issuance, has been constantly rising in the euro area since the new single currency was introduced. This is due to the stronger growth of cumulated withdrawals compared to cumulated lodgements of euro banknotes at Eurosystem NCBs.2 As at the end of 2021, more than 80 per cent of euro banknotes in circulation had been issued by the 4 NCBs.
From 2002 to 2019, three main phases can be discerned (see Figures 1 and 2): i) a decade (2002-2012) of high but declining growth rates in the aftermath of the cash changeover, with two temporary recoveries following the financial and sovereign debt crises (2008 and 2011, respectively), when there was exceptional demand for high denomination notes, mostly for precautionary reasons; ii) a phase showing an upward trend in growth rates (2013-2015); iii) a period of moderate and stable positive growth (2016-2019).
Figure 1: Cumulated net issuance of euro banknotes (€ billion)
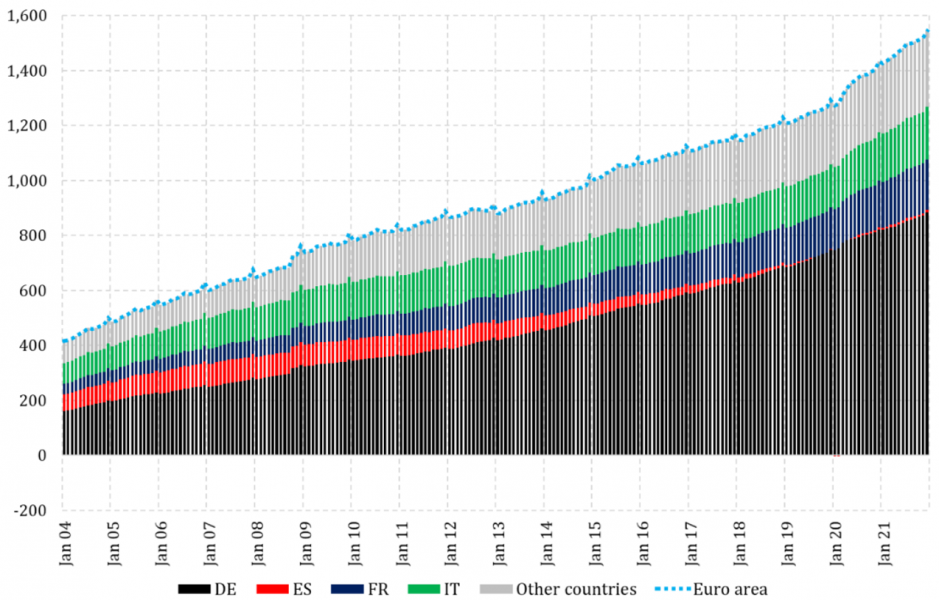
Sources: ECB’s CIS2 data base and authors’ calculations.
Figure 2: Cumulated net issuance of euro banknotes (12-month growth rates and national contributions)
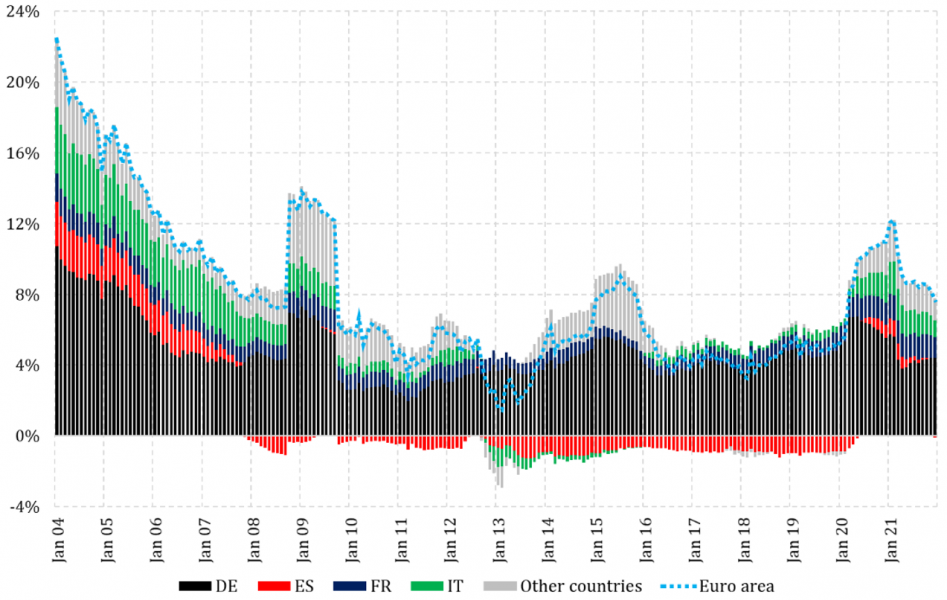
Sources: ECB’s CIS2 data base and authors’ calculations.
In terms of nominal GDP, banknotes in circulation have been steadily increasing in the last two decades from slightly lower than 5 per cent to about 11 per cent at the end of 2019.
A closer look at the dynamics reveals a degree of heterogeneity between the largest countries belonging to the monetary union. While developments of cash in circulation in Italy, France and Germany broadly followed the pattern traced by the euro area apart from temporary deviations, the evolution observed in Spain is quite different.
The outbreak of the COVID-19 pandemic in the beginning of 2020 accelerated the downward trend in the use of cash as a means of payment that had been observed for years but, at the same time, total euro banknotes in circulation increased by 9.9 per cent in the second quarter of 2020.3 This was the result of the exceptional decline in banknote lodgements at the national central banks of the euro area (-19.1 per cent, on a yearly basis) and of the smaller reduction in withdrawals (-9.5 per cent). The 12-month growth rate of total euro banknotes in circulation kept increasing strongly up to a high of 12.2 per cent in February 2021; since then it has been steadily decreasing.
The benchmark models currently used for national banknote requirement planning at the 4 NCBs essentially belong to the ARIMAX family. STSMs represent a very broad class of time series models including ARIMAX models and exponential smoothing models. They break a time series down into its unobservable components such as trend and season. As in regression models, explanatory variables and intervention variables can also be incorporated. Here the explanatory variables represent calendar effects on banknotes in circulation and intervention variables stand for special events which lead to trend breaks and outliers. In this analysis a variety of crisis-related events turned out to be significant. These include global crises like the great financial crisis and the COVID-19 pandemic as well as local crises in some countries. Moreover, intervention variables for the euro cash changeover and the halt to €500 banknote issuance also play a role.
Finally, the forecasting performance of the 4 NCBs’ STSMs was compared with their respective benchmark models currently used for national banknote requirement planning. All of the estimation samples end in September 2020 in order to include enough observations to capture the impact of the COVID-19 pandemic that started in March 2020. Each of the 4 NCBs have chosen the time period from October 2020 to September 2021 as an out-of-sample forecast horizon.4 Figure 3 contains an exemplary illustration for German-issued €50 banknotes.
Figure 3: Forecasts of German-issued €50 banknotes in circulation by STSM and by benchmark ARIMAX model (million pieces)
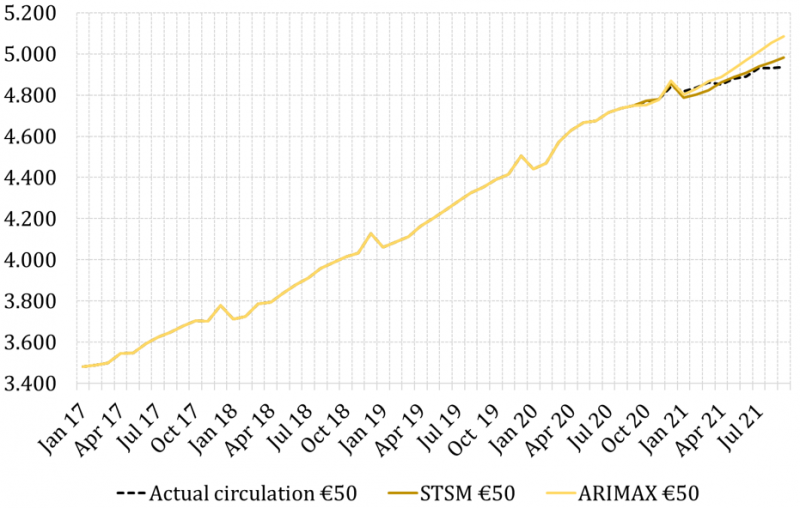
Sources: Deutsche Bundesbank and authors’ calculations
According to the forecast accuracy measures employed, the STSMs outperform the benchmark models for each denomination in Spain. In France and Italy, STSMs do a better job at forecasting banknotes in circulation for all but the €50 denomination and in Germany for four out of six denominations (€10, €20, €50 and €200). However, it should be borne in mind that the statistical informative value of this comparison is limited by the short projection period of just 12 months. In order to assess the robustness of this finding, further exercises of this kind are advisable.
Banknote sorting activity, managed at the national level, is characterised by several country-specific features, like sorting capacity, quality policies and pre-existing stocks of banknotes to be processed.
Cumulated net issuance is computed as the sum of withdrawals at a Eurosystem central bank net of the corresponding sum of lodgements since the euro’s introduction in 2002. Due to migration of notes amongst euro area countries, the aforementioned variable does not necessarily coincide with the actual amount of banknotes in circulation in a member country.
The corresponding increase in the average value of banknotes was also reflected in higher average ATM withdrawals during the lockdown.
In view of the considerable uncertainty about the future effects of the pandemic, we have refrained from extending the length of the forecast horizon.