The monitoring of inflation dynamics is a common trait among central banks worldwide, due to its relevance for monetary policy decisions. In this context, it is useful to look at measures of underlying inflation to anticipate changes or rapid reversals in the observed inflation trend. A novel instrument known as the inflation compass is proposed to gauge underlying inflationary pressures in the euro area, resorting to circular statistics. This tool leverages all the available information regarding the harmonized index of consumer prices. Importantly, it is not subject to revisions, offering policymakers timely indications of the direction of underlying inflation in a way that is comprehensible and visually appealing. Moreover, it is shown that the inflation compass outperforms in a forecasting context other commonly employed indicators of underlying inflation in the euro area, resulting in statistically significant accuracy gains, even in periods of turmoil such as the COVID-19 pandemic or the recent inflation surge. Finally, its superior performance is corroborated in a large-dimensional data environment.
A common characteristic shared by central banks across the globe is their attention paid to monitoring the behaviour of inflation. When formulating monetary policy strategies for the euro area, the European Central Bank (ECB) has traditionally centred on evaluating the future trajectory of inflation. This evaluation takes into account various factors, such as incoming economic and financial information, the dynamics in inflation, and the efficiency of transmitting monetary policy. Several techniques have been put forth in academic research to extract relevant information from detailed data, resulting in the creation of different underlying inflation indicators designed to filter out temporary price swings and capture its trend. Vigilant monitoring of these indicators allows policymakers to proactively identify shifts or sudden reversals in the overall inflation rate, whether it is during periods of rising or falling price pressures.
In this context, an instrument based on circular statistics known as the inflation compass has been developed by Lourenço, Quelhas and Rua (2023). It allows the inference of inflationary pressures in the euro area in real-time, using all the available information underlying the harmonized index of consumer prices. We present the inflation compass for the euro area, focusing on recent episodes of historically high and low inflation, as depicted in Chart 1 by the red and blue dots, respectively.
Chart 1: Recent episodes of high and low inflation in the euro area | Year-on-year percentage change.
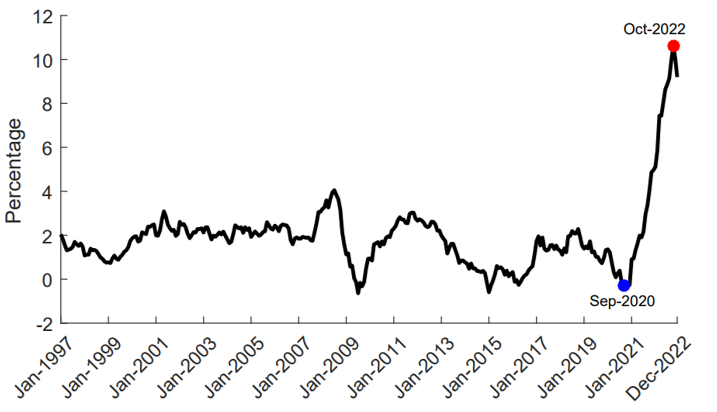
Chart 2 displays the corresponding inflation compasses for the highlighted months with high or low inflation, positioned in the center of each row, along with the adjacent months on either side. By moving counterclockwise, the inflation compass synthesises the various inflationary pressures within the consumer basket into a single direction (indicated by a red needle), with the corresponding confidence interval represented by an arc around it.
Chart 2: Inflation compasses during recent episodes of low (top) and high (bottom) inflation.
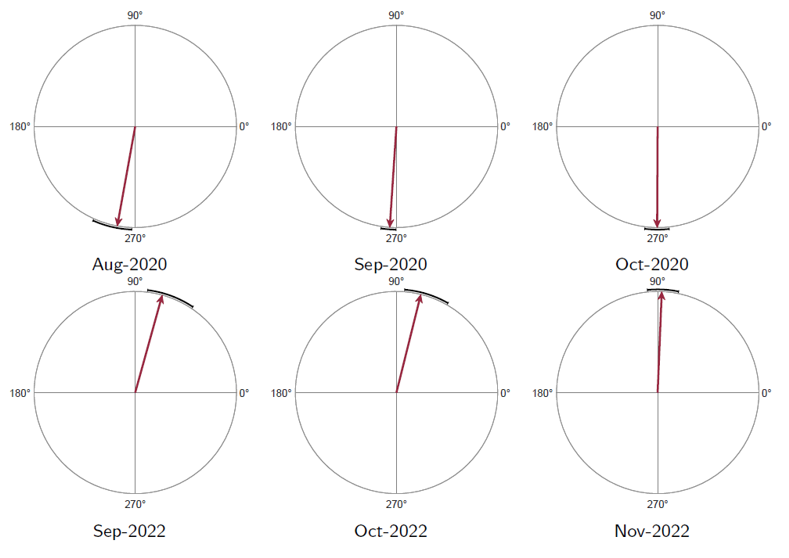
In the first quadrant, located in the upper right section of the circle where the angle ranges from 0° to 90°, inflation exceeds the ECB’s inflation target of 2%. When the needle points to the North (toward 90°), there is evidence that underlying inflation may have reached a local maximum and could be entering a declining phase. Transitioning to the second quadrant, which extends from 90° to 180°, inflation remains above the target. However, as we move along this quadrant, price pressures decelerate until inflation reaches the target point at 180°. Moving into the third quadrant, covering the range from 180° to 270°, inflation falls below the target. Here, price pressures continue to ease as we advance through this quadrant, leading to a local minimum in inflation at the 270° angle. Lastly, in the fourth quadrant, spanning from 270° to 360°, prices accelerate. As we rotate along this quadrant, inflation increases until it reaches the target level once again.
During the period of low inflation in the autumn of 2020, the compass needle pointed southward with minimal dispersion around the overall direction. Naturally, the narrower confidence interval in this period reflects lower uncertainty, mainly due to the increased synchronisation of inflation subcomponents during that time. However, since then, inflation has surged globally. In the euro area, inflation even reached double digits at the beginning of autumn 2022. By analysing the rotation of the compass needle from October 2020 to September 2022, we can observe the gradual build-up of inflationary pressures as the needle smoothly rotates from the south to the north direction. Starting from the first quadrant, price pressures steadily intensified until underlying inflation reached a local peak at 90°, particularly in November 2022. These findings underscore the reliability of the inflation compass in monitoring price pressures in the euro area.
Beyond its qualitative informational content for assessing price pressures, we also offer evidence of the ability of the inflation compass to forecast overall inflation up to 36 months ahead. In particular, we compare its performance against several underlying inflation measures, both in-sample and out-of-sample. Our findings indicate that the inflation compass consistently surpasses the typically monitored underlying inflation measures in the euro area, and that these improvements in accuracy are generally statistically significant. Moreover, our suggested procedure can handle large-dimensional data. By making use of finer levels of data disaggregation, either product-level or country-level data, we show that the inflation compass delivers higher accuracy than alternative measures, thus reinforcing its usefulness.
Central banks worldwide keep a close eye on price pressures as the inflation outlook lies at the heart of monetary policy decisions. To ensure a timely assessment of price pressures to deliver effective policy responses, various techniques for filtering incoming data have been employed, with the aim of abstracting from temporary price fluctuations and generating an underlying inflation measure. The proposed inflation compass drawing on circular statistics helps us to better understand inflation dynamics in the euro area. It leverages all available data at a granular level and it is not subject to revisions, providing policymakers a clear and easy way to assess the current stance in inflationary pressures. It turns out that the inflation compass is particularly valuable for tracking price pressures during periods of high and low inflation in the euro area and characterising the spectrum of price pressures over the years. Quantitatively, it also proves its effectiveness in forecasting inflation, outperforming other measures, besides being robust to different levels of data disaggregation.
Lourenço, N., Quelhas, J. and Rua, A. (2023), “Navigating with a compass: Charting the course of underlying inflation”, Banco de Portugal Working Paper No 17/2023.