

Abstract
Post GFC, the Basel Committee introduced two prudential liquidity rules for banks: the Liquidity Coverage Ratio (LCR) and the Net Stable Funding Ratio (NSFR). These ratios rely on a definition of what constitutes a high-quality liquid asset (HQLA). The most predominantly used class of HQLA is Level 1 which broadly consists of cash and sovereign bonds. This duopoly of central bank and government issued assets are narrow and lack diversity. A natural diversifier would have been gold. However, in 2010 when the uniform definitions for HQLA were proposed, there was insufficient gold trading data available. Additionally, the regulatory consensus was that gold was “too volatile” to be considered. In 2018, the largest cohort of gold OTC trade data became available. A recent paper by Baur et al (2025) suggests that gold augments a liquidity portfolio as a level 1 HQLA. The inclusion of gold could also address concerns regarding the availability of Level 1 HQLA in some jurisdictions that may suffer from structural shortages of sovereign paper and also where the use of these assets is in greater demand for the purposes of either a monetary policy tool or a collateral asset.
Today, there is a strong case for gold to be included in the HQLA list. Recent market events have shown that many investors already utilise gold as a liquidity buffer as it has proven to be an asset that performs well during financial stress events (World Gold Council, 2025). During 2023, the gold market saw increased gold bar and coin purchases, stable and liquid futures markets, increased central bank purchases and an increase in OTC volumes. Investors use gold as a liquidity asset because it can be easily traded and valued and is widely accessible through different market access points. The two biggest attributes for an investor are gold’s negative correlation with risky assets and the overall trust factor gold holds. Altogether, this creates a very broad investor base and a large and diversified group of asset holders which is greater than that of many HQLA assets. The evidence from the data suggests that the volatility of gold compares favourably to other level 1 HQLAs. The perception held by some regulators that gold is too volatile for inclusion as a level 1 asset are shown below to be incorrect.
Gold trades on several global exchanges and has a very large over the counter (OTC) component. Isolating the OTC-only element of gold volume, we can see that gold trades $124bln per day, on average. The combined average daily volume of futures and OTC markets in 2024 was $229bln.
Chart 1. 2024 Daily Global Gold Volume
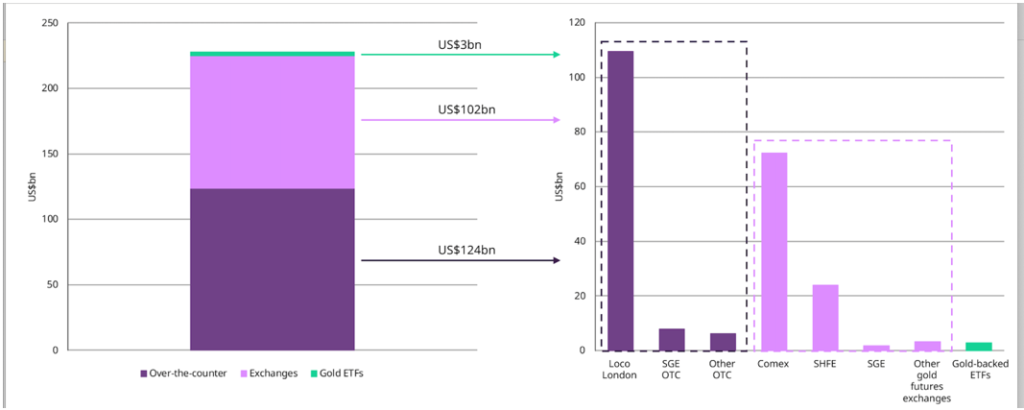
Note: Volumes represent estimated daily averages in billions of US dollars (US$bn) for 2024. Sources: Bloomberg, COMEX, Dubai Gold & Commodities Exchange, ICE Benchmark Administration, Multi Commodity Exchange of India, Nasdaq, Shanghai Gold Exchange, Shanghai Futures Exchange, Tokyo Commodities Exchange, World Gold Council.
Chart 2. Asset Sizes in USD Billions per day*
OTC daily gold trading volumes compare favourably in size to other level 1 HQLAs such as US Treasuries

Data as of 28 February 2025. Based on estimated average daily trading volumes from 1 January 2024 to 31 December 2024, except for currencies that correspond to April 2022 daily volumes due to data availability, and UK Gilts and German Bunds that correspond to 2023 data. Source: Bloomberg, Bank for International Settlements, UK Debt Management office, Bundesrepublik Deutschland Finanzagentur GmbH, World Gold Council.
We examined gold’s long-term volatility versus other level 1 HQLAs. Over the period 2011-2023, while gold is more volatile than short-term US government bonds, its volatility is comparable to that of long-term government bonds such as 30-year US Treasuries.
This holds true on average over the longer term, as shown in chart 3 and during periods of financial stress as shown in Chart 4. The volatility analysis of the March 2023 SVB banking crisis highlights that gold’s volatility is more stable than that of many US government bonds (Chart 4).
Chart 3. Average daily volatility 2011-2023
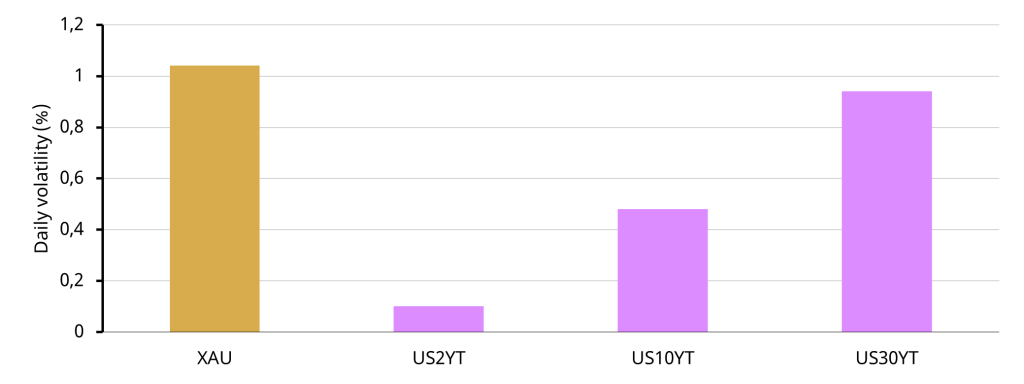
Note: Chart 3 shows average realised daily volatility of returns on 5-minute data between 31/12/2010 to 30/12/2023. Source: LSEG, Baur et al (2025).
Chart 4. March 2023 SVB banking crisis volatility
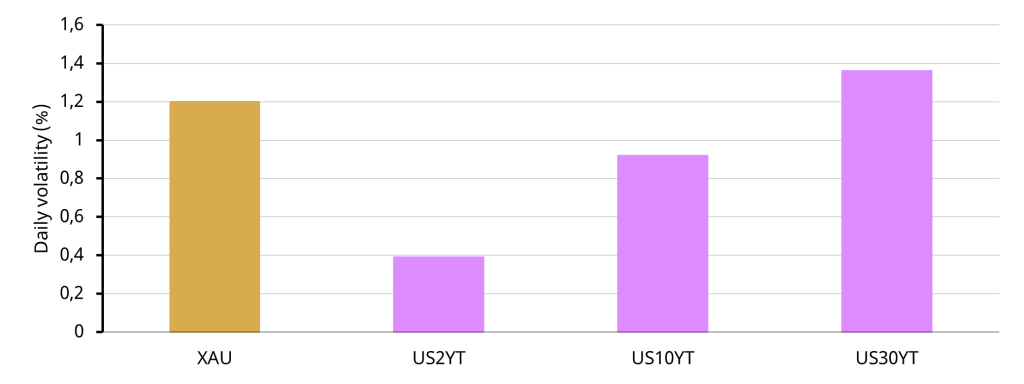
Note: Chart 4 shows the average realised daily volatility of returns on 5-minute data between 01/01/2023 to 31/03/2023. Source: LSEG, Baur et al (2025).
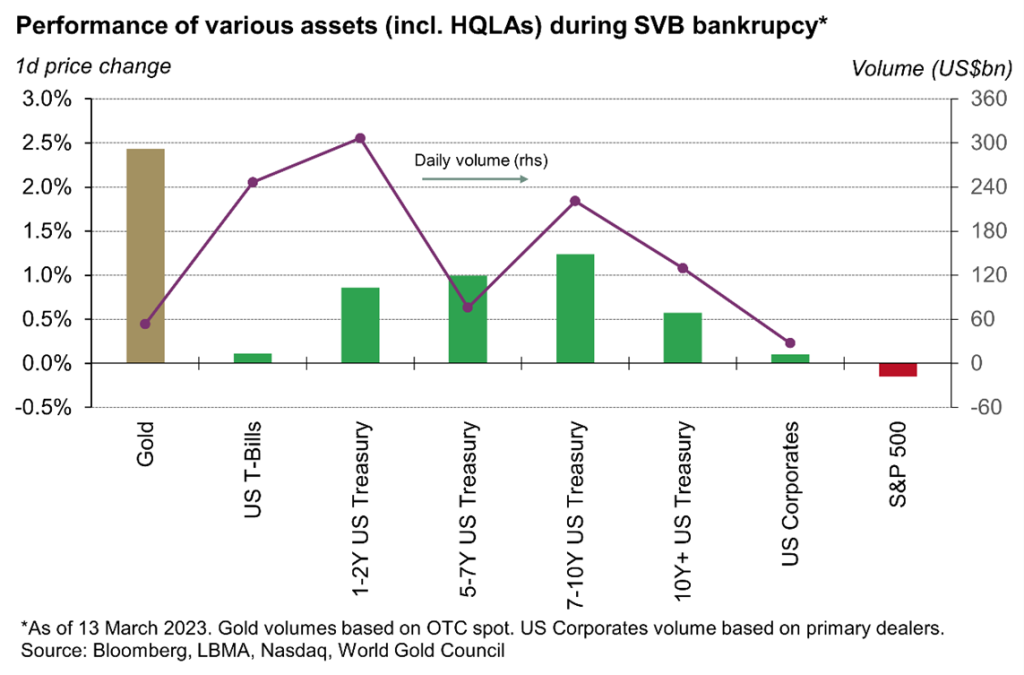
Chart 5 below represents the performance and volume traded of various assets on 13 March 2023. On this day four banks with around US$900 billion in assets were either closed or merged with another bank and, again by 1 May, another bank with a balance sheet of US$230 billion was sold to avoid a mass default. Gold performed better than many other assets during this period.
Chart 5. Performance during a stress event
The regulatory agenda following the SVB event has shown the LCR drawdown assumptions that were made in 2010 are in need of reform. LCR was never designed to prevent bank runs, it was written only to create breathing space to allow an orderly resolution of a bank to take place. If a bank can lose US$100 billion of deposits within 48 hours, would holding gold as a liquidity buffer have made more sense than holding bonds that were either held to maturity or marked to market?
Additionally, the uniform definitions of HQLAs are now over 15 years old and should be revised to reflect all current market dynamics. With the benefit of trade data that regulators did not have in 2010 we can now compare gold’s Amihud (2002) measure and compare it to other asset classes. Amihud (2002) is the standard measurement used by regulators to determine illiquidity of financial assets.
Table 1 shows that this important illiquidity measure shows that gold liquidity is akin to 2-to-3-year U.S government bonds or better than the sub-2-year tenor and every tenor from 5 years onwards. Using data from February 13, 2023, to June 26, 2024, table 1 shows gold’s Amihud (2002) illiquidity measure is comparable to other extremely High-Quality Liquid Assets. The Amihud (2002) illiquidity measure shows that gold compares very favourably against US Treasuries.
Table 1. The Amihud (2002) illiquidity measure – Gold vs US Treasuries
(N.B Smaller number is more liquid)

Daily aggregate data on US Treasury bond trading are sourced from FINRA and daily data on gold are from LBMA. The sample is from February 13, 2023, to June 26, 2024. Amihud’s (2002) illiquidity measure is then calculated as ILLIQ = 1 ∑T |Rett | where Ret is return on day t, Vol is the trading volume in trillion dollars, N t=1Volt t i and T is the number of days during the sample period. Restricted by data availability, for US Treasury bonds, we use volume-weighted average price during the day to calculate daily returns for each bond tenor and use the total traded par value as a measure of trading volume.
Demonstrating one aspect of an active and sizable market, as per the pre-defined HQLA characteristics as set by Basel, is low bid-ask spreads. Baur et al (2025 show that gold (XAU) is as liquid as established HQLAs, such as US and European government bonds.1 Looking at various assets over the 2011-2023 period, using hourly data, gold’s average bid-ask spreads fall very favourably between those of short-term and long-term US government bonds, the safest and most liquid bonds in the market.
Chart 6. Bid-Ask Spread Liquidity 2011-2023
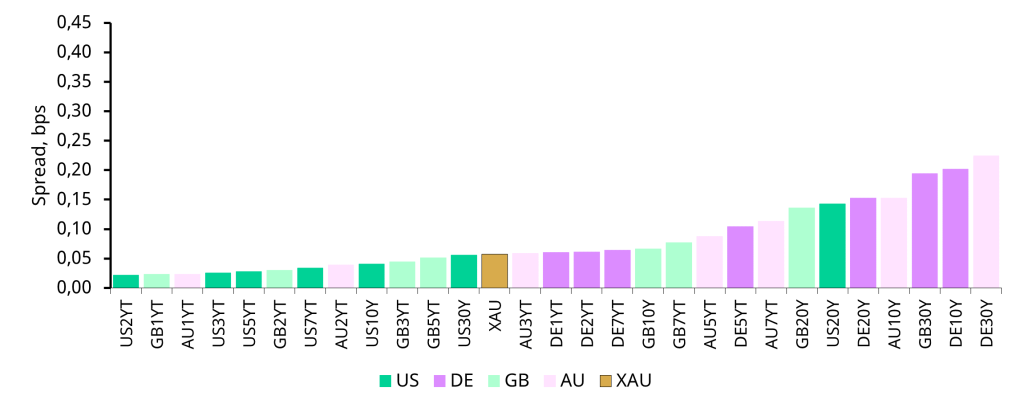
Note: Chart 6 presents the hourly bid-ask spreads for US, UK, German and Australian government bonds at different maturities ranging from 1-year to 30-years and gold over a 13-year period spanning 31/12/2010 to 30/12/2023. spreads for gold are based on a minimum 100 troy ounces. Source: LSEG, Baur et al (2025).
Importantly, Chart 7 shows that gold’s bid-ask spreads improved in comparison to bonds during the SVB crisis.
Chart 7. March 2023 SVB banking crisis bid-ask spreads
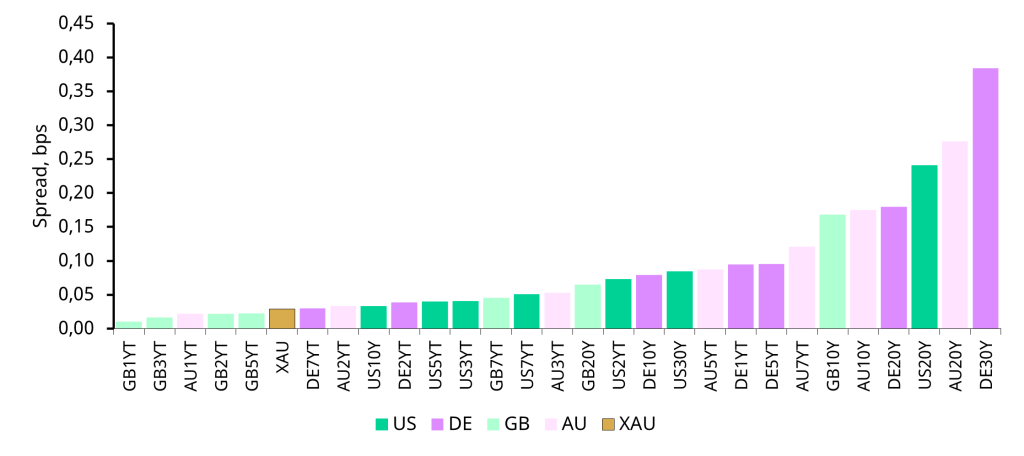
Note: This chart presents the hourly bid-ask spreads for US, UK, German and Australian government bonds at different maturities ranging from 1-year to 30-years and gold between 01/01/2023 to 31/03/2023. Source: LSEG, Baur et al (2025).
Table 2 demonstrates how the risk and return over risk ratio changes if gold is added to a portfolio of US Treasury bonds. P1 is a portfolio comprised of 100% 10-year US Treasury bonds; P2 is a portfolio comprised of 90% 10y US Treasury bonds and 10% gold; P3 is a portfolio comprised of 90% 10y US Treasury bonds and 10% 30y US Treasury bonds; P4 is a portfolio comprised of 80% 10y US T bonds, 10% gold and 10% 30y T bonds; P5 is a portfolio comprised of 80% 10y US T bonds and 20% gold and P6 is a portfolio comprised of 70% US T bonds and 30% gold. This data shows that gold can augment the return without compromising on higher volatility.
Table 2. Diversified Portfolio Analysis: SVB March 2023

Some central bankers have voiced concern about the lack of eligibility of gold at most central banks. The Basel III criteria for HQLA state that an asset should ideally be central bank eligible; however, as gold has asset holders that are more diversified than sovereign bonds and who are arguably greater in number than bond holders, gold should not have to rely on central bank eligibility to act as a HQLA. However, should central banks choose to allow gold as an eligible asset, this is possible to achieve as demonstrated by the Republic of Turkey which does allow gold to be eligible for some central bank operations. There are also some central banks who engage in gold swap activities. These central banks often lend excess central bank cash and take gold as the collateral asset in return. These trades are facilitated using commercial banks that hold physical gold accounts at central bank custodians. This is possible due to several central banks holding large stocks of gold due to their gold custodian businesses that provide storage facilities to other central and commercial banks.
The current status quo of HQLAs has created an overly correlated sovereign-bank nexus. Gold has a more diverse and geographically dispersed holding base than other HQLA assets, enhancing its stability, with no credit or default risk. Gold is without doubt an extremely High- Quality Liquid Asset.
AMIHUD, Y. (2002): “Illiquidity and stock returns: cross-section and time-series effects,” Journal of Financial Markets, 5, 31–56.
BAUR, D. G., D. GORNALL, L. HOANG, AND J. PALMBERG (2025): “Is Gold a High-Quality Liquid Asset?,” Available at SSRN: http://dx.doi.org/10.2139/ssrn.5064967
WORLD GOLD COUNCIL (2024): “Study supporting gold as a high-quality liquid asset,” World Gold Council. Unpublished.
WORLD GOLD COUNCIL (2025): “Relevance of Gold as a Strategic Asset,” World Gold Council, Available at: https://www.gold.org/goldhub/research/relevance-of-gold-as-a-strategic-asset
XAU is the spot gold price in US$/oz.