This policy brief is based on Fritzer F., D. Prammer, L. Reiss, M. Schneider, How have profits been shaping domestic price pressures in Austria?, Monetary Policy and the Economy Q3/2023, Oesterreichische Nationalbank. Opinions expressed by the authors do not necessarily reflect the official viewpoint of the OeNB or the Eurosystem. The authors would like to thank Gerhard Fenz for helpful comments and valuable suggestions.
A recent debate has arisen on the role of profits in driving inflation in Austria and the euro area. This policy brief analyses the inflation dynamics in Austria by decomposing the value-added deflator into its income components: compensation of employees, net operating surplus, consumption of fixed capital and taxes less subsidies on production. In 2022, the value-added deflator grows by 6.4%, with profits contributing 4.0 percentage points, thereby accounting for more than half of inflation. Excess profits, defined as profit growth in excess of the growth of the value-added deflator, explain more than a third of domestic inflation in 2022. These excess profits were unevenly distributed across sectors: Energy, construction, and agriculture recorded strong increases in profits, while unit profits fell in manufacturing. In 2023 and 2024, the impact of profits on inflation is expected to decline due to rising labor costs and depreciation. Therefore, we expect that the average contribution of excess profits will be small over the entire period from 2020 to 2024.
In 2022, soaring energy imports were the main driver of high consumer price inflation rates. As firms raised prices and employees demanded higher wages to maintain their real income levels, inflation has since spread to various product categories. This prompted the European Central Bank to closely monitor the cause-and-effect relationship between rising wages and rising prices and their potential to further fuel inflation (Arce et al., 2023). In Austria, a public debate has centered around the sources of domestic price pressures, particularly whether excess corporate profits1 in certain sectors have fueled rapid inflation.
Our contribution delves into this question by breaking down the value-added deflator for the whole economy and for specific sectors. Unlike the Harmonized Index of Consumer Prices (HICP), which tracks consumer prices (including imports and taxes less subsidies on products), the value-added deflator measures the price of value-added through the domestic production of goods and services. In addition to domestically produced consumer goods and services, it also captures other demand components like exports, gross capital formation, and public consumption. Due to data constraints, this analysis excludes the real estate sector, the information and communication sector and the public sector. Excluding these sectors, the value-added deflator for the Austrian economy rose by 6.4% in 2022, while the overall value-added deflator for the Austrian economy as a whole rose by 4.7%.
Value-added is made up of compensation of employees, net taxes on production (= other indirect taxes on production less other subsidies), depreciation and profits (net operating surplus). By decomposing it, one can assign to each of these components its contribution to the price development. The annual national accounts data allow this composition for all 64 NACE sectors until 2021. As detailed national accounts data for 2022 were not yet available at the time of writing, we proxy the decomposition of gross value-added for 2022 on a more aggregate sectoral level.
Our decomposition approach differs from other approaches along the following dimensions: 1) We explicitly account for depreciation and amortization, which is very often not reported separately but included in the operating surplus. 2) When considering net taxes on production, we explicitly control for subsidies provided during the Corona pandemic and the recent energy crisis. While subsidies are generally stable and insignificant in normal times (2000–2019: 1.7% of gross value-added), crisis-related subsidies account for around 7% of value-added in 2020 and 2021. Short-time work subsidies and other crisis-related subsidies (in particular net turnover compensation, fixed cost grants, compensation for losses as well as energy bill subsidies) are derived from administrative data and allocated to the eligible sectors. As these subsidies aim to prevent an increase in unemployment and/or corporate insolvencies, rather than seeking to reduce/impact selling prices, we deduct them from compensation of employees and net operating surplus respectively.
The growth of the value-added deflator for the overall economy (excluding the real estate sector, the information and communication sector and the public sector due to data constraints) accelerated from 2.0% in 2021 to 6.4% in 2022. Between 2020 and 2022, the deflator rose by 3.8% on average. The left panel of chart 1 shows the results of the decomposition.
Chart 1
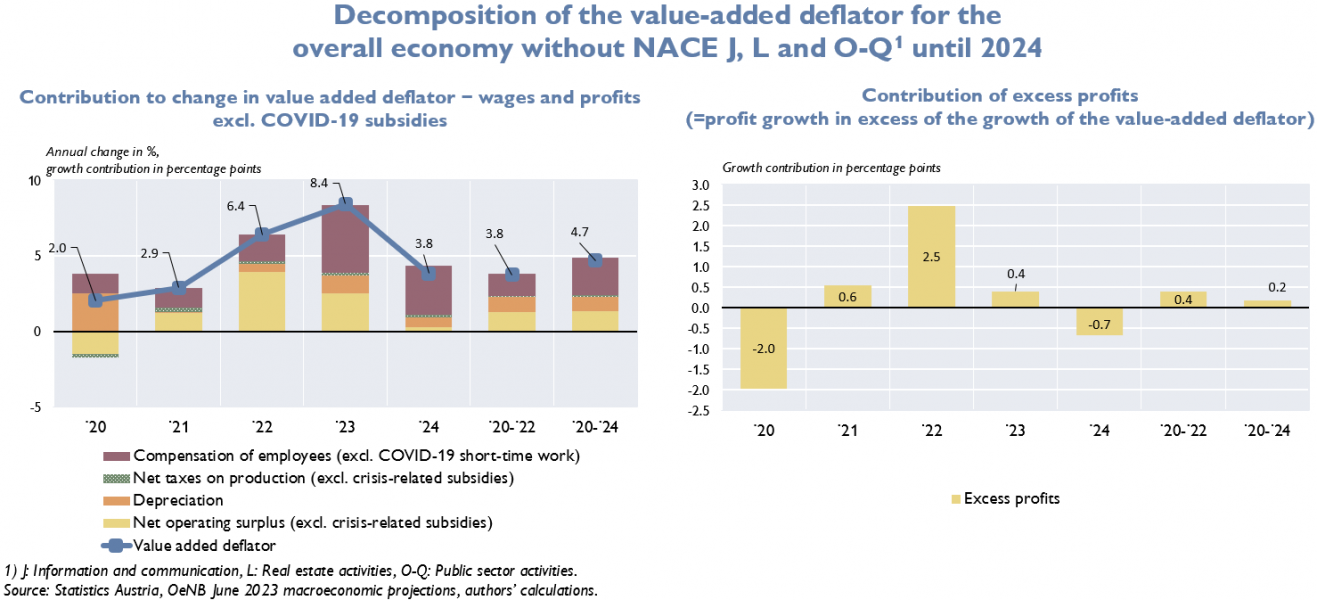
In 2020, both compensation of employees and net operating surplus fell. However, as value-added fell more sharply than compensation of employees, unit labor costs increased. Together with depreciation, they contributed positively to the increase in the deflator. In 2021, compensation of employees and net operating surplus contributed about equally to the increase in the deflator. In 2022, the net operating surplus accounted for more than half of the increase in the deflator at 4.0 percentage points.
In the right panel of chart 1, we show the contribution of excess profits. We define excess profits as profit growth in excess of the growth of the value-added deflator. To calculate excess profits, we compare the results of our decomposition with an hypothetical distribution-neutral scenario in which all value-added components grow at the same rate as the value-added deflator, so that the wage and profit shares remain unchanged. In 2022, the excess profit contribution amounted to 2.5 percentage points, thus accounting for one-third of the increase in the deflator. Yet, the period from 2019 to 2022 shows only slightly positive excess profit contributions (0.4 percentage points), given the sharp drop in net operating surplus that was observed in 2020. Our analysis of the relative importance of profits versus wages is a snapshot over a short period of time, which was moreover distorted by the pandemic conditions.
In 2023 and 2024, profits will come under pressure from several angles. First, economic growth will likely be at best moderate in both years. Second, compensation of employees is expected to rise sharply in both years, following the inherent lags in Austrian wage adjustments to inflation. Third, replacement costs of capital will continue to rise sharply due to high inflation. Under these assumptions, the excess profit contribution declines to 0.4 percentage points in 2023 and turns into negative territory in 2024 (according to the OeNB macro projections from June 2023). In contrast, the “excess contribution” from compensation of employees will increase in 2023 and 2024. Throughout the period from 2020 and 2024 both excess contributions are very close to zero.
Looking at the economy as a whole masks the high degree of heterogeneity across sectors. From a sectoral perspective, three sectors showed markedly above-average contributions from profits over 2020-2022. These sectors were energy (including mining as well as water supply and sewerage services due to data availability reasons), construction, and agriculture (including forestry).
Chart 2
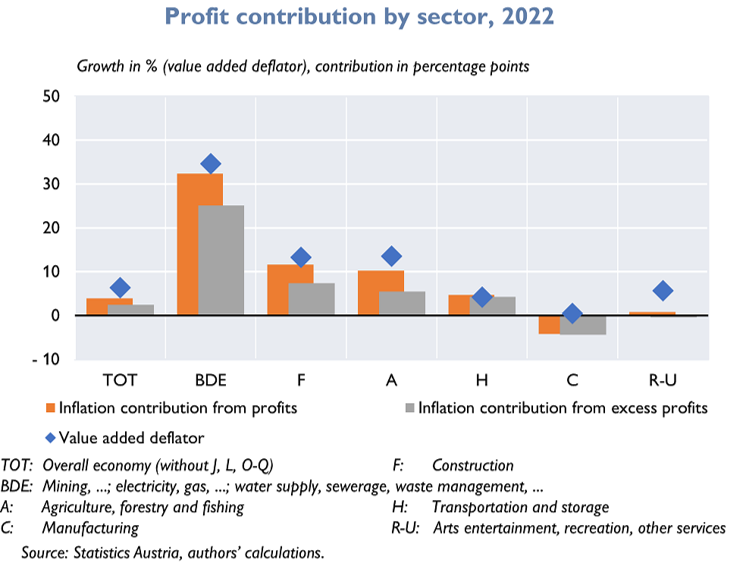
Mining, energy, water supply and wastewater services (NACE B, D and E) showed the strongest deflator rise (+35%), mostly due to the contribution of profits. Assuming that the mining and water/wastewater sectors only experienced average deflator increases, the increases in the energy sector (NACE D) are likely to have been almost twice as high in 2022. In the construction sector (NACE F), the value-added deflator has risen sharply for some time now as a result of surging property prices. The excess profit contribution accounts for almost two-thirds (7.4 percentage points of 11.7%) of the respective deflator increase in 2022. The agriculture and forestry sector (NACE A) benefited from the strong increases in global food and timber prices, which boosted profits significantly. The excess profit contribution accounted for almost half (5.5 percentage points) of the 13.6% increase in the value-added deflator in 2022. At the same time, the value-added deflator in manufacturing (NACE C) remained stable due to a significant decline in unit profits. The heterogeneous developments across sectors continued in the first half of 2023: Overall growth in net operating surplus slowed down substantially, but profits in financial and insurance activities (NACE K) soared amidst the changes in the interest rate environment.
In 2022, the excess profit contribution accounts for more than a third (2.5 percentage points) of the increase in the value-added deflator, making it a relevant inflation driver. From a sectoral point of view, three sectors had a markedly excess profit contribution. These were energy (including mining and water supply and sewerage), construction and agriculture (including forestry). Their profit contributions were to some extent offset by the inflation-dampening profit contribution of manufacturing, i.e., there was a reallocation of profits within the corporate sector in 2022. We expect profits to come under pressure in the remainder of 2023 and in 2024 due to slow economic growth, sharply rising unit labor costs and rising capital replacement costs.
Arce, O., E. Hahn and G. Koester. 2023. How tit-for-tat inflation can make everyone poorer (europa.eu). ECB blog, March 30.
Fritzer F., D. Prammer, L. Reiss, M. Schneider. 2023. How have profits been shaping domestic price pressures in Austria? Monetary Policy and the Economy Q3/2023. OeNB.
We define excess profits as the part of the profit increase that is induced by a growth of unit profits that exceeds the growth of the value-added deflator.