This analysis provides an overview of the findings presented in the most recent report on high earners published by the European Banking Authority (EBA) and complements these results with further insights gained from Bloomberg’s comprehensive Environmental, Social & Governance (ESG) dataset. We find that the number of high earners, as well as their average remuneration, increased in the period from 2010 to 2019. Most high earners worked in investment banking, accounting for 51% of the total. On average, high earners made most in Liechtenstein, followed by Malta, Spain and Ireland. Remuneration patterns were found to be rather heterogeneous across countries; as a case in point, the ratio between variable to fixed components of total remuneration came to around 60% in the UK and France in 2019. A correlation analysis for 2020 furthermore indicates that banks’ staff numbers and amount of total assets are strongly positively correlated with total remuneration, while their return on assets (ROA) and CEO’s term of office reveal a slightly negative correlation. By comparison, when conducting a more in-depth regression analysis over multiple years, we identify a positive relationship between total CEO remuneration and high staff numbers as well as increasing ROAs and price-to-book ratios.
Based on our analysis, we present an overview of high earners working in the European banking sector, relying on the following two data sources:
(1) The EBA report on high earners: In its yearly report, the EBA publishes selected data on high earners employed in the banking sector of the European Economic Area (EEA) (see European Banking Authority, 2021). High earners are persons earning remunerations of EUR 1 million or more in a given calendar year, including both fixed and variable pay as well as other salary components. The main advantage of this data source is that EBA reports data on staff members of all levels and does not exclusively focus on executive board members. This is particularly relevant in investment banking, where the remuneration of (management) staff often exceeds that of CEOs. At the same time, the EBA report comes with two disadvantages. First, data are reported with a significant time lag, with the most recent report published in 2021, for instance, quoting remuneration data from 2019. Second, data are only available at the aggregated level, i.e. for countries and banks’ business areas, and thus cannot be broken down to the level of individual banks.
(2) Bloomberg data on governance and remuneration: The second data source underlying the present analysis is Bloomberg’s comprehensive ESG dataset. This data source is advantageous in that it provides information on remuneration at the individual bank level, allowing for more granular and institution-specific analyses. Moreover, given the scope of Bloomberg’s ESG dataset, we could also extend our sample of banks to compare the related findings with those for non-European banks. Finally, we can access compensation data from the previous calendar year, which enables us to use more recent data in conducting our analyses. Yet, there are two major drawbacks when using Bloomberg data. First, only data on executive board members and CEOs are collected – not, however, data on other staff members. When assessing high earnings in areas such as investment banking, this would be crucial information, though. Second, the data gathered primarily focus on banks listed on stock exchanges. Since disclosure obligations are less strict for nonlisted banks, data on both listed and nonlisted financial institutions are only available on a less granular basis.
In sum, there is a strong case for combining both data sources, as this allows us to give a broader and more complete picture of high earners within the European banking sector.
2019 data on high earners
When evaluating EBA data on high earners in the EEA, we find that remuneration varies considerably across the 25 countries considered. Of a total of 4,963 high earners earning over EUR 1 million in 2019, 71% were established in the UK. Chart 1 shows the number of high earners per one million inhabitants. With a total of 206.5 high earners per one million inhabitants, Liechtenstein reported the highest density of people with top earnings. The UK came in second (52.5 high earners per one million inhabitants), followed by Luxembourg (35.1), Cyprus (7.9) and Ireland (6.8); the median came to 2.6 top earners per one million inhabitants.
Chart 1: Number of high earners per one million inhabitants
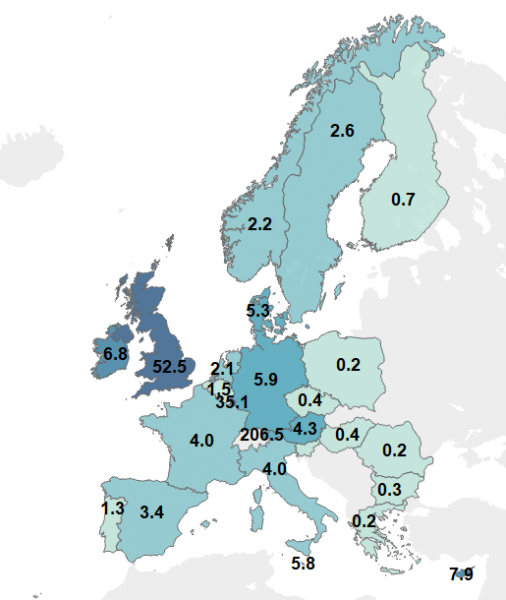
Chart 2 presents high earners’ average total remuneration (fixed and variable pay) in EUR million. Once again, Liechtenstein topped the list with an average annual high earner salary of EUR 2.61 million, which was almost 150% above the EEA average of EUR 1.75 million (median: EUR 1.69 million). Malta (EUR 2.41 million) took second place, Spain (EUR 2.30 million) third.
Chart 2: Average total remuneration in EUR million per high earner
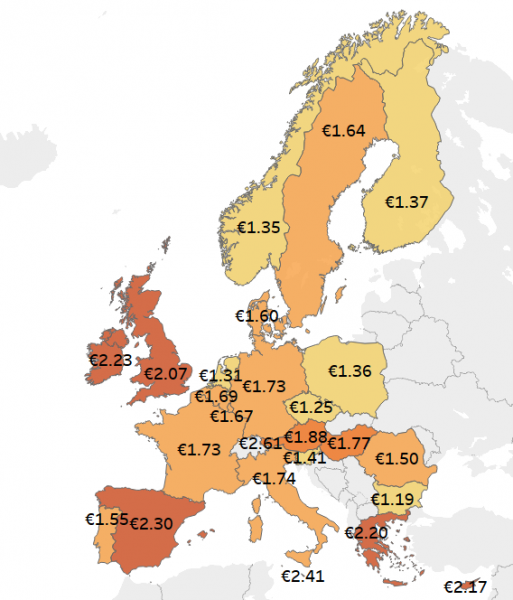
Table 1 shows selected remuneration figures for the ten countries that recorded the most high earners in 2019. At just under 60%, the share of variable pay in overall high earner compensation was highest in the UK and France, respectively.
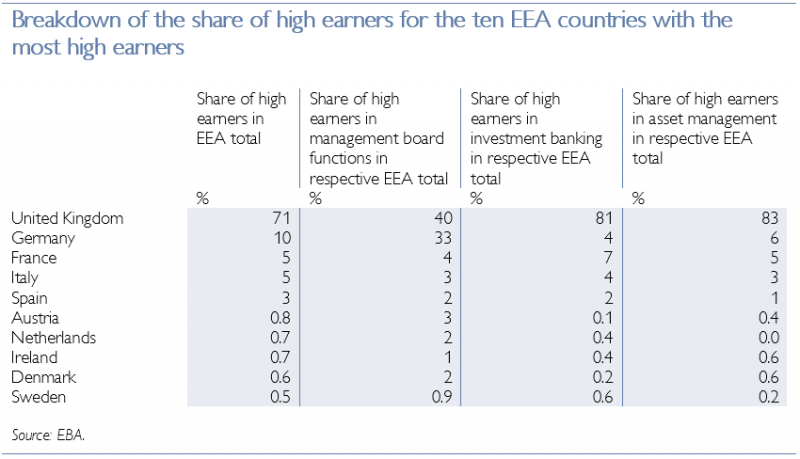
When breaking down total numbers of high earners into subgroups,2 we find that some 80% of high earners can be allocated to the following three business areas or functions: investment banking (51%), management board functions3 (18%) and asset management (10%). In the period under observation, 71% of high earners came from the UK, accounting for 81% of investment bankers and 83% of asset managers, but only for 40% of management board members. While Germany’s total tally stood at a mere 10%, the country’s high earners represented 33% of all management board members in the EEA. Further details on high earners for 2019 can be found in table 2.
Table 1
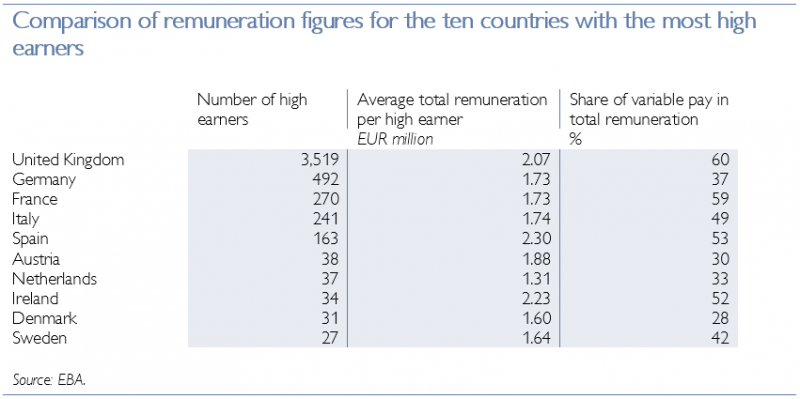
Table 2
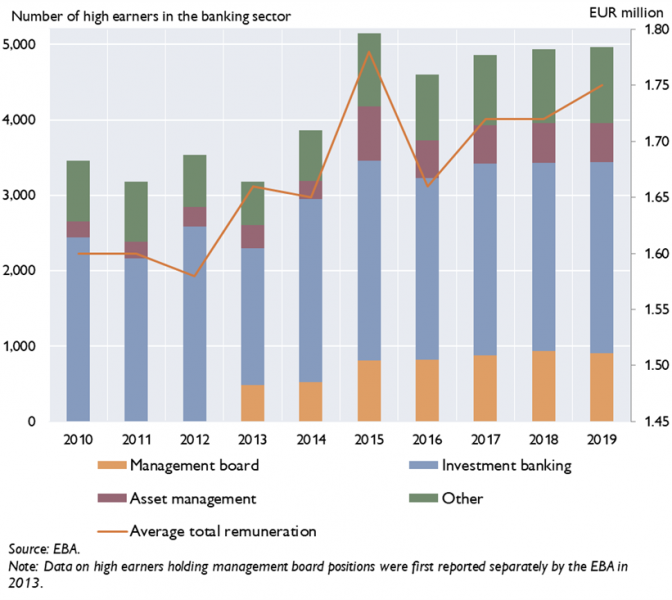
Long-term trends observed for high earners since 2010
Looking at developments over the period from 2010 to 2019, we can identify four major trends for high earners:
Chart 3: Number of high earners and average total remuneration in the EEA from 2010 to 2019
When analyzing the data on governance and compensation drawn from Bloomberg’s ESG dataset, we find that CEO remuneration varies widely across the banks covered by the STOXX Europe 600 Banks Index5. Chart 4 shows CEO remuneration (including both fixed and variable components) in EUR million across the listed banks in 2020. Among the top earners in the European banking sector are the CEO of Deutsche Bank (total pay: EUR 8.3 million), Santander (total pay: EUR 6.9 million) and BAWAG (total pay: EUR 5.3 million). On average across the sample, CEOs were paid EUR 2.7 million in 2020.
Chart 4: CEO remuneration (including both fixed and variable components) in EUR million across STOXX Europe 600 banks in 2020.
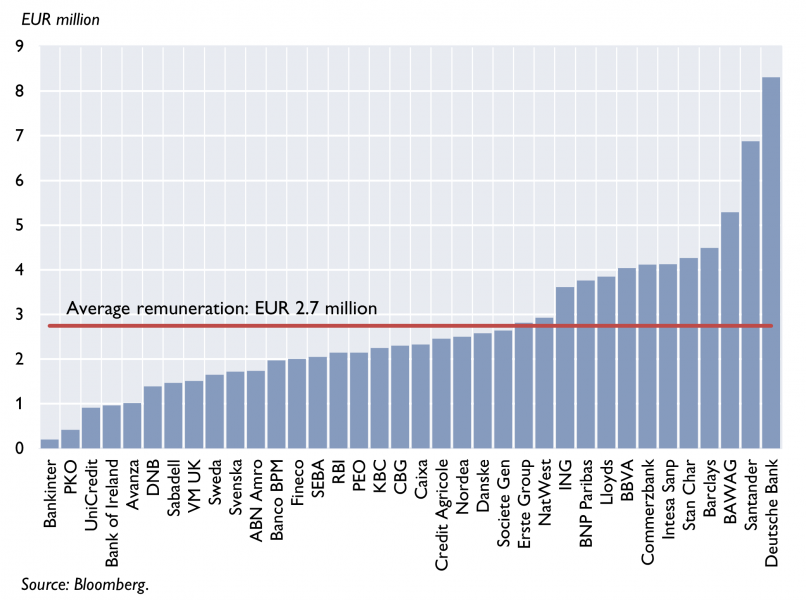
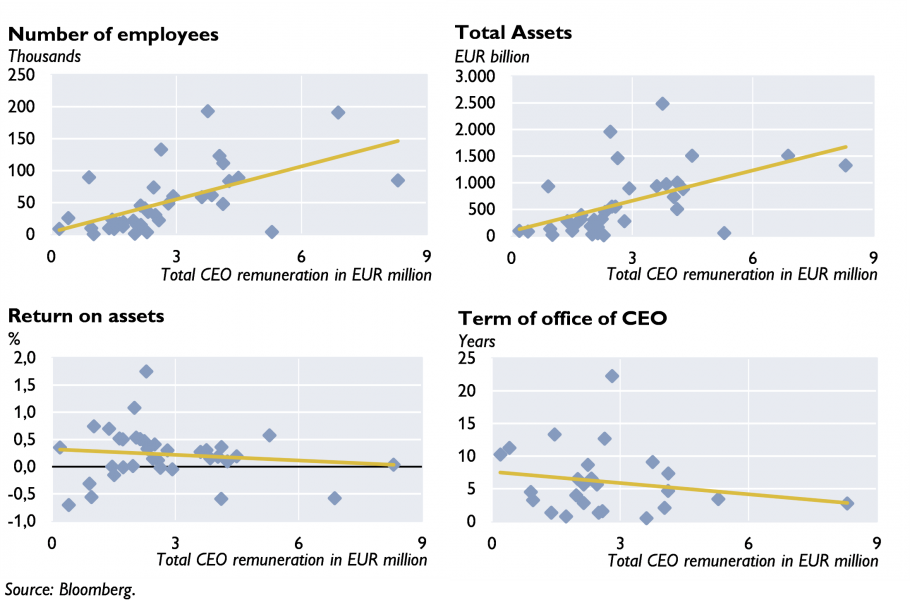
Chart 5 illustrates selected correlations observed between total CEO compensation and the STOXX Europe 600 banks sample in 2020. Our results indicate that the number of bank employees is clearly positively correlated with the level of CEO pay; the same applies to the amount of banks’ total assets. When we look at total CEO compensation and banks’ ROA, we find a slightly negative correlation. Unlike one might expect, total CEO pay is also slightly negatively correlated with CEOs’ term of office.
Chart 5: Selected correlations between CEO remuneration (including both fixed and variable components) and STOXX Europe 600 banks in 2020
Drawing on the wealth of bank sample data, we also estimated a time fixed effects regression model. More specifically, estimations were based on data gathered from the STOXX Europe 600 bank sample for the period from 2010 to 2020. Compared with correlation analyses, which allow us to calculate the relationship between two variables, the key advantage of regression analyses is that we can examine the relationship between several variables and total CEO remuneration at the same time. Moreover, relationships may be estimated over a longer period of time. Taking account of academic literature (Sigler, 2011; Zoghlami, 2021), we identified a set of relevant variables influencing CEO compensation. These include a given bank’s size, number of employees and profitability, as well as its CEO’s level of in-house experience. Our model reveals that only a few variables have a statistically significant impact on total CEO remuneration.
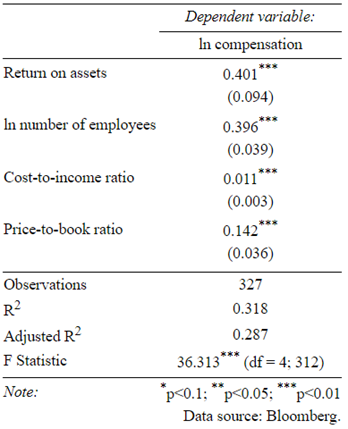
Regression results point to positive effects on total remuneration resulting from the following variables (see annex table 3): staff numbers, ROAs and price-to-book ratios. Additionally, we find a positive correlation between cost-to-income ratios and total compensation, even though we would have expected to see a negative relationship between high pay levels and low cost efficiency.
In sum, the variables identified had a rather limited impact on CEO remuneration and may only marginally explain remuneration practices.
By comparison, a regression analysis covering a period of ten years unveils that high staff numbers as well as increasing ROAs and price-to-book ratios have a positive impact on total CEO pay. While the effects observed are statistically significant, they are very small and may only serve to explain a fraction of remuneration amounts.
European Banking Authority. 2021. High Earners Reports – data from 2010 to 2019. Available at: https://www.eba.europa.eu/regulation-and-policy/remuneration.
European Banking Authority. 2021. EBA publishes its Report on management and supervision of ESG risks for credit institutions and investment firms. Available at: https://www.eba.europa.eu/eba-publishes-its-report-management-and-supervision-esg-risks-credit-institutions-and-investment.
Sigler, K. J. 2011. CEO compensation and company performance. In: Business and Economics Journal 31(1). 1–8.
Zoghlami, F. 2021. Does CEO compensation matter in boosting firm performance? Evidence from listed French firms. In: Managerial and Decision Economics 42(1). 143–155.
ANNEX
Table 3: Regression results for total CEO remuneration across STOXX Europe 600 banks for the period from 2010 to 20206
In the EBA report, high earners are divided into eight subgroups representing the following business areas or functions: management body (MB) supervisory functions, MB management functions, investment banking, retail banking, asset management, corporate functions, independent control functions, and all other.
Management board functions subsume both MB supervisory functions and MB management functions.
Data on high earners holding management board positions were first reported separately by the EBA in 2013.
This index tracks the performance of all 36 banks listed on the STOXX Europe 600 Index.
Table 3 is organized as follows: We use total CEO pay as our dependent variable (compensation), which we transform using the natural logarithm. This allows us to calculate the relationship between our dependent variable and the independent variables – i.a. expressed as elasticities –, bringing them to a more unified level. The same procedure is performed for the number of employees. Our results are obtained ceteris paribus, i.e. on condition that all other independent variables are kept constant, and should be read as follows: (1) If ROAs increase by 1 percentage point, compensation will rise by 0.4%. (2) If the number of employees increases by 1 percentage point, compensation will rise by 0.4%. (3) If the cost-to-income ratio increases by 1 percentage point, compensation will rise by 0.01%. (4) If the price-to-book ratio increases by 1 percentage point, compensation will rise by 0.14%. Below these parameter values, the corresponding standard errors are reported in parenthesis. The standard errors in relation to the parameter values indicate statistical significance. ***, **, * denote that the effect is statistically different from zero at the 1%, 5% and 10% level, respectively. R2 is a goodness-of-fit measure of regression models, ranging from 0 to 1 (an R2 of 1 means that the regression predictions perfectly fit the data). Adjusted R2 takes into account the number of variables, punishing models with many additional variables, as these do not, as a rule, enhance the explanatory power of the models.