The views expressed are those of the authors only and do not necessarily represent those of the Oesterreichische Nationalbank (OeNB) or the Eurosystem. Tobias Gerstmayr was affiliated with the OeNB at the time of writing.
This analysis offers a summary of the key findings from the latest report on High Earners published by the European Banking Authority (EBA) in 2022, and it compliments these findings with additional insights by including Bloomberg data from 2023. The EBA report shows that, Liechtenstein leads the European Economic Area (EEA) countries in terms of High Earners per million population, while Ireland tops the list for average remuneration at 2.4 million EUR in 2022. The ratio between variable vs fixed remuneration components shows significant variability across EEA countries (DNK: 44%; NL: 337%). The country with the highest share of non-male High Earners was Finland with 16.7%. Finally, we explore factors that influence the remuneration of the Highest Earners in European banks. With this goal in mind, we construct and test four hypotheses and find that: larger banks (more employees) and better market valuations (price-to-book ratio) correlate with higher remuneration, while profitability (return on equity) is not a significant explaining variable for the remuneration of the Highest Earners in European banks. We also find that the remuneration in banks with better risk management and/or higher risk aversion (lower non-performing loan ratio) is higher.
The following analysis provides an overview of the so-called “High Earners” in the European banking sector. The following two data sources were used for this analysis:
The European Banking Authorities (EBA) “Report on High Earners”: the EBA publishes an annual overview of High Earners in the banking sector in the European Economic Area (EEA). High Earners are defined as persons who receive remuneration of more than 1 Mio. EUR in the corresponding calendar year. This includes both fixed and variable remuneration as well as other salary components. The major advantage of this data source is that not only board members but also employees are included – this is particularly relevant in investment banking, where the remuneration of (senior) employees often exceeds that of the CEO. At the same time, the EBA report has two disadvantages: On the one hand, there is a considerable time lag – the current report published in 2024, for example, refers to remuneration in 2022. Furthermore, the data is only available at the country level or at the business model level, but not at the individual bank level. In the most recent report, the EBA has introduced a new dimension by including the gender of High Earners in its data collection.
Bloomberg database on governance and remuneration: The second data source for this analysis is the extensive Bloomberg database. The main advantage of this data source is that information on remuneration can be retrieved at individual bank level, which enables a more granular analysis. In addition, the bank sample can be expanded and a comparison with non-EEA countries can be made. The data can also be retrieved for the most recent calendar year. The two main disadvantages of the data from Bloomberg are as follows: Firstly, the used variable only includes the single individual with the highest remuneration per bank i.e. the Highest Earners per bank. Furthermore, the data is limited to banks traded on stock exchanges.
A combination of these two data sources therefore seems particularly useful, as it provides a comprehensive and complete overview of the High Earners in the European banking sector.
Analysis of EBA Data from 2022
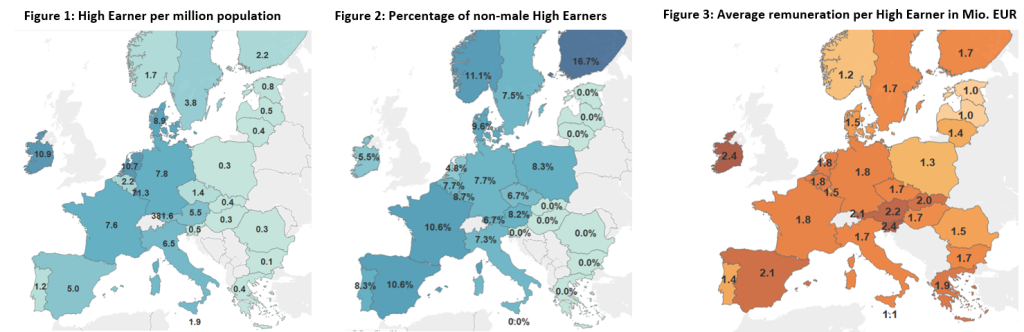
As in previous years, the EBA collected data on High Earners in the banking sector of the EEA for 2022. In total, 27 countries participated, varying widely in size and population. Across the EEA 2,342 High Earners were identified, with around half of all High Earners being employed in Germany (653) and France (519). The number of High Earners per million population1 is depicted in Figure 1. Liechtenstein tops the list with 381.6 High Earners per million population, followed by Luxemburg (71.3), Ireland (10.9) and the Netherlands (10.3). The number of High Earners per million population is notably higher in the western than in the eastern parts of the EEA.
For the first time, EBA also collected the gender of the High Earners (male, female and neither female nor male). The percentage of non-male High Earners out of all High Earners is shown in Figure2. The countries with the highest share of non-male High Earners are Finland with 16.7%, followed by France and Spain (both 10.6%). Across all countries in the EEA, out of a total of 2,342 High Earners, only 195 individuals do not identify as male, indicating a significant gender bias.
As in previous years, the EBA collected data on High Earners in the banking sector of the EEA for 2022. In total, 27 countries participated, varying widely in size and population. Across the EEA 2,342 High Earners were identified, with around half of all High Earners being employed in Germany (653) and France (519). The number of High Earners per million population1 is depicted in Figure 1. Liechtenstein tops the list with 381.6 High Earners per million population, followed by Luxemburg (71.3), Ireland (10.9) and the Netherlands (10.3). The number of High Earners per million population is notably higher in the western than in the eastern parts of the EEA.
For the first time, EBA also collected the gender of the High Earners (male, female and neither female nor male). The percentage of non-male High Earners out of all High Earners is shown in Figure 2. The countries with the highest share of non-male High Earners are Finland with 16.7%, followed by France and Spain (both 10.6%). Across all countries in the EEA, out of a total of 2,342 High Earners, only 195 individuals do not identify as male, indicating a significant gender bias.
The country with the highest average remuneration (fixed and variable components) in Mio. EUR. was Ireland which tops the list with an average remuneration of 2.4 Mio. EUR (see Figure 3), followed by Slovenia (2.4 Mio. EUR) which had only one High Earner in 2022. The country with third highest average remuneration was Austria (2.2 Mio. EUR), surpassing the EEA average of 1.8 Mio. EUR.
The remuneration structure of High Earners for Institutions and Investment Firms is depicted in Table 1. High Earners from Denmark had a variable vs. fixed ratio of 44%, which is the lowest rate among the displayed countries and significantly below the EEA average of 109%. The Netherlands had the highest variable vs. fixed ratio in the EEA (337%). Countries with a high variable vs. fixed ratio, also had a large share of High Earners employed in Investment Firms. The average variable vs. fixed ratio for High Earners in Investment Firms (489%) was higher than in Institutions (85%). Out of all 2,342 High Earners 325 were employed in Investment Firms.
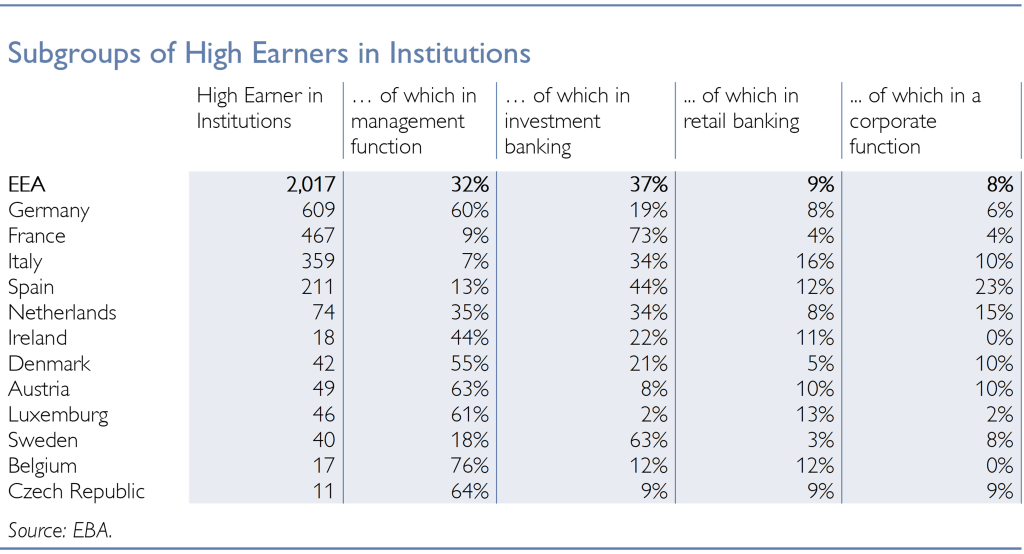
Most of the High Earners in Institutions can be categorized into four broad subgroups2: Management Board3 (32%), Investment Banking (37%), Retail Banking (9%) and Corporate Function (8%). Belgium and Germany had a particular high share of High Earners that are on the Management Board (BE: 76%, DE: 60%), while France and Sweden had a higher percentage of High Earners in Investment Banking (FR: 73%, SE: 63%). Further information on the share of High Earners in the most common subgroups can be seen in Table 2.
Table 1: Remuneration Structure of High Earners in the EEA
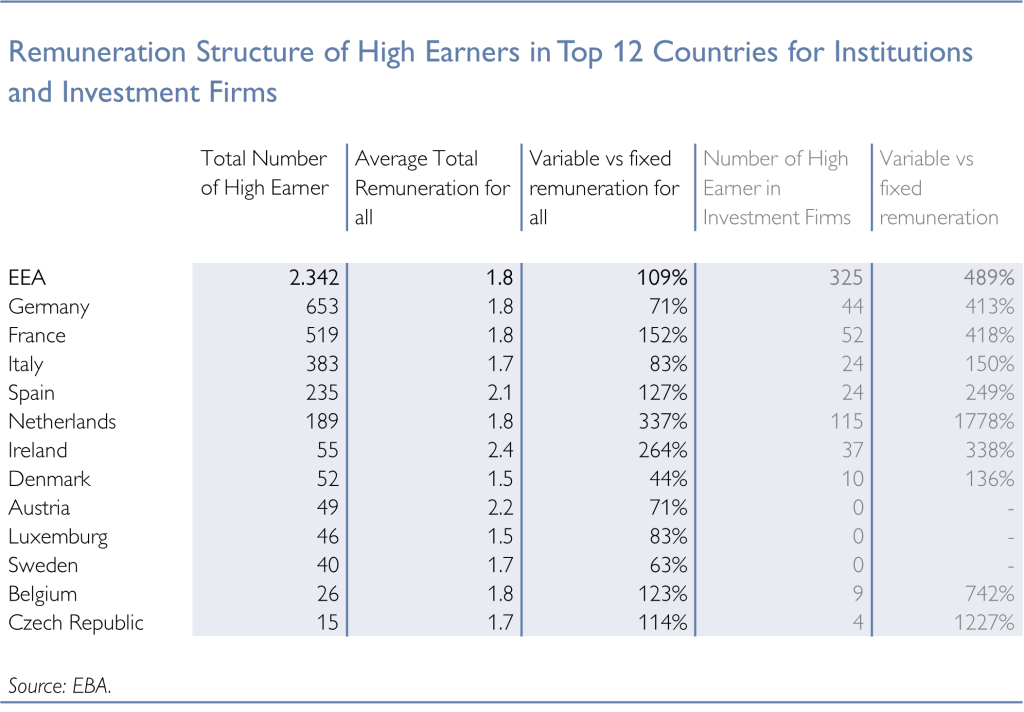
Table 2: Subgroup of High Earners in the EEA
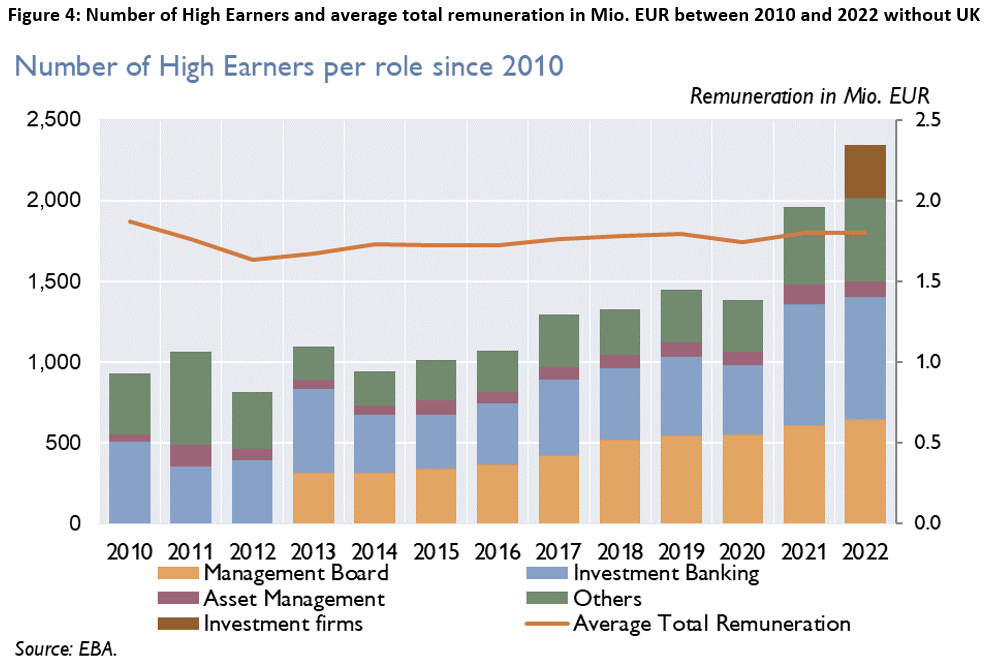
Four major trends can be observed in the development of High Earners in the EEA between 2010 and 2022. We remove all High Earners from the UK, to ensure comparability over all years.
Analysis of Bloomberg Data 2023
Bloomberg’s 2023 data on remuneration of the Highest Earner in a STOXX Europe 600 Banks5 shows significant disparities in remunerations across different European banks. Figure 5 depicts the single highest remuneration in each bank in Mio. EUR including both fixed and variable components in the year 2023. The average Highest Earner remuneration for the included European banks was 3.49 Mio EUR in 2023. The individual with the highest remuneration in 2023 was Noel Quinn the CEO of HSBC with 14 Mio. EUR. This was a higher remuneration than usual as he was paid out a significant three-year bonus in 2023. Other Highest Earners were Ana Botin (Executive Chair of Banco Santander – 12 Mio. EUR), Bill Winter (CEO of Standard Chartered – 9 Mio. EUR), Anas Abuzaakouk (CEO of BAWAG – 9 Mio. EUR) and Christian Sewing (CEO of Deutsche Bank – 8.7 Mio. EUR).

In this section, we will explore the factors that influence the remuneration of the Highest Earners in European banks. With this goal in mind, we construct and test four hypotheses. The selection of variables is guided by exist-ing literature on High Earner compensation. The variables we focus on are number of employees (reflecting bank size), price-to-book ratio (reflecting market valuation), return on equity (reflecting profitability) and non-performing loans ratio (reflecting risk management and/or risk aversion).
Most research on remuneration practices in banks, concentrates on CEO remuneration. However, our analysis focuses on the single individual with the highest remuneration in a bank. While the data for CEO remuneration was also available in Bloomberg, we opted for the highest remuneration datapoint instead due to comparability issues (multiple CEOs in some years, …). Notably, we found that, in most cases, the highest remuneration was equivalent to the CEO’s remuneration in the banks we studied. Therefore, we deem it is reasonable to compare our findings with research that focused solely on CEO remuneration.
Construction of Hypotheses
Below the hypotheses are stated in their alternative form.
Hypothesis 1 = Larger banks remunerate their Highest Earner better
According to the literature, the size of the bank is relevant when explaining the remuneration practices of a company (Tosi et al., 2000) or a bank (Shiyyab et al., 2013). Thus, we anticipate a significant positive relationship between the logarithm of the Highest Earner’s remuneration and bank size, which we measure by the logarithm of total employees.
Hypothesis 2 = Banks with higher market valuation (measured by the price-to-book Ratio) remunerate their Highest Earner better
We assume that differences in price-to-book ratio ratios indicate varying shareholder trust in individual banks. Higher price-to-book ratios should correspond with higher remuneration for the Highest Earners, as Chung & Pruitt (1996) find market valuations and executive compensation to be jointly determined.
Hypothesis 3 = The profitability of a bank is positively correlated with the remuneration of its Highest Earner
Pathan & Murphy (1990) and Tosi et al. (2000) have found a positive relationship between financial performance and CEO compensation in publicly traded firms, however other research like Davidsson & Peterzén (2019), which focused exclusively on retail banks, was unable to find any significant relationship between CEO compensation and financial parameters.
Hypothesis 4 = Banks with better risk management and/or higher risk aversion tend to provide higher remuneration for their Highest Earner
Since the great financial crisis significant attention has been placed on the remuneration structure of bank CEOs, specifically how much variable pay a CEO receives and how that affects risk levels. Cerasi et al. (2017) find that variable remuneration correlates positively with returns and negatively with risk. Similarly, Pathan et al. (2022) found that larger pay gaps between CEO and other executives are associated with reduced risk levels in a bank’s portfolio. They argue that when more power is concentrated in one individual, the pressure to achieve short-term results decreases. We test these findings by taking the non-performing loans (NPL) ratios of the included banks as a proxy for risk management.
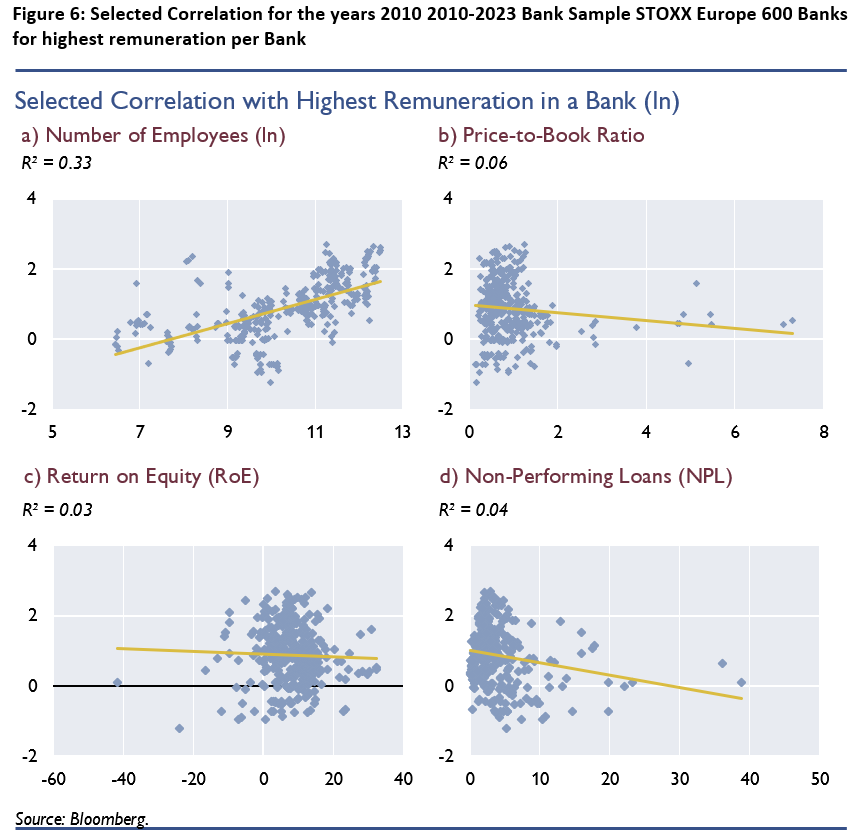
Next, we determine which variables can describe remuneration practices in a STOXX Europe 600 Bank best by constructing univariate regressions between the selected variables and the remuneration of the Highest Earner in a bank (see Figure 6). We see significant correlation between the natural logarithm of remuneration and the natural logarithm of the number of employees. Of all variables included in this analysis, the number of employees shows the highest correlation with the remuneration of the Highest Earner with an R² of 0.33. This indicates that approximately 33% of the variance in remuneration can be explained by the number of employees in a bank, suggesting a clear relationship between a bank’s workforce size and the remuneration of the Highest Earner.
A much weaker correlation exists between remuneration and the price-to-book ratio with an R² of only 0.06. The Italian online bank Fineco Bank was responsible for most of the outliers on the right-side of Figure 6b, as it had a particular high price-to-book ratio between 2010 and 2023. Similarly, to the price-to-book ratio, RoE and the NPL ratios show only minimal correlation with an R² of 0.03 and 0.04 respectively. Outliers with NPL ratios above 20% were the Banks Montei dei Paschi and BPER Banco, both banks have struggled with high NPL ratios after the eurozone crisis (see Figure 6d). As evidenced by the low correlations in Figure 6, we are unable to capture all dimensions that explain the remuneration of the Highest Earner in a bank with the selected variables.
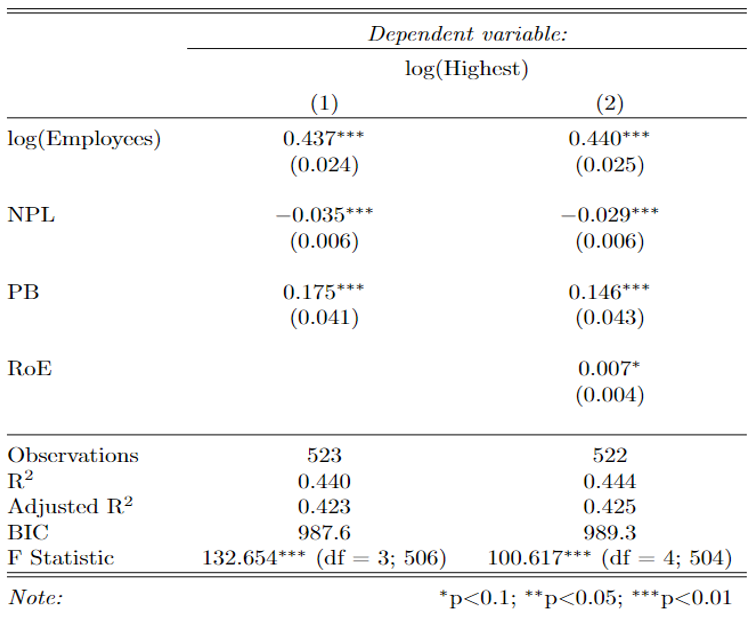
It is evident that no single variable can adequately explain the complexities of Highest Earner remuneration in the banking sector alone. The use of a multivariate time fixed effects regression model allows us to estimate the relationships between multiple variables simultaneously over a long period of time, providing a more comprehensive understanding. Also, its results help us evaluate the validity of the four hypotheses constructed above. The regression results, detailed in Table 3 of the appendix, provide several key insights:
Appendix
Table 3. Regression table for highest remuneration in a Stoxx Europe 600 Banks between 2010-20237
Cerasi, V., Deininger, S., Gambacorta, L., & Oliviero, T. (2017). “How post-crisis regulation has affected bank CEO compensation,” BIS Working Papers 630, Bank for International Settlements.
Chung, K. and Pruitt, S. (1996), “Executive ownership, corporate value, and executive compensation: A unifying framework”, Journal of Banking and Finance, Vol. 20(7): 1135-1159.
Davidsson, A., & Peterze n, D. (2019). What determines CEO compensation in retail banks? Master Thesis within Business Administration.
Jensen, M., & Murphy, K. (1990). Performance Pay and Top-Management Incentives. Journal Of Political Economy, 98(2), 225-264.
Pathan, S., Haq, M., & Morgan, J. (2022). CEO pay gaps and Bank Risk-Taking. European Accounting Review, 32(4), 935–964. https://doi.org/10.1080/09638180.2022.2043761
Shiyyab, F., Girardone, C. & Zakaria, I. (2013). Pay for no performance? Executive pay and performance in EU banks. Essex Business School, University of Essex.
Tosi, H. L., Werner, S., Katz, J. P., & Gomez-Mejia, L. R. (2000). How much does performance matter? A Meta-Analysis of CEO pay Studies. Journal of Management, 26(2), 301–339.
Here it should be noted that countries are normalized to 1 million people, thus the number of High Earners is extrapolated for small countries (Liechtenstein, Luxemburg, …).
High Earner in Institutions were originally grouped into 8 subgroups by EBA: Management Board (MB) supervisory function, MB management function, Investment Banking, Retail Banking, Asset Management, Corporate functions, Independent control functions and all other. High Earners in Investment Firms (325 out of all 2.342 High Earner in the EEA) were grouped into 8 separate subgroups, not included here.
Management Board refers to the subgroups MB supervisory function und MB management function.
Before the exclusion of the UK due to Brexit, 71% of EEA High Earners worked in the UK.
The STOXX Europe 600 Banks sample consists of a slightly changing group of European banks. We decided to not account for changes in the Index in the observed time period (2010-2023). Furthermore, we made the decision to include Raiffeisen Bank International (RBI), even though it was not included in the STOXX Europe 600 Banks index in 2023. In total we included all 46 STOXX Europe 600 Banks at YE 2023 plus RBI.
After Brexit, the UK stopped reporting data on their respective High Earners to EBA. To ensure comparability we decided to remove the UK for all years. In this analysis when referring to EEA, we are excluding UK.
The table should be understood as follows. The dependent variable is the total remuneration of Highest Earner in a Bank. The natural logarithm is applied to this variable to calculate the relationships to the independent variables, among others, in terms of elasticities and to bring them to a more consistent level with the other variables. This logarithmic transformation is also applied to the Number of Employees. The results are to be interpreted ceteris paribus (meaning under the condition that all other independent variables are held constant) and are read as follows: (1) Number of Employees: If the number of employees increases by 1%, then the Compensation increases by 0.43%. (2) Price-to-book Ratio (P/B Ratio): If the P/B ratio increases by 1 percentage point, then the Compensation increases by 0.175%. (3) non-performing loans: If the NPL Ratio increases by 1 percentage point then the Remuneration decreases by 0.035%. (4) Return on Equity (RoE): If the RoE increases by 1 percentage point, then the Compensation increases by 0.007%. The number in parentheses below each parameter value is the corresponding standard error. The ratio of the standard error to the parameter value determines the significance (marked with asterisks “*”) at the respective confidence intervals “<1%”, “<5%”, or “<10%”. R² is a measure of the explanatory power of the model (ranging from 0 to 1; 1 would mean the model explains 100% of the variation in the dependent variable). Adjusted R² takes into account the number of variables by “penalizing” a model with many variables, as adding more variables typically increases the explanatory power without necessarily providing a decisive improvement. Similarly, the Bayesian Information Criterion (BIC) also penalizes model size to avoid overfitting.