We estimate the likelihood and severity of future negative economic outcomes for Portugal by monitoring the evolution of risks to economic activity and exploring the non-linear relationship between the current financial situation and the distribution of future GDP growth. We find that financial vulnerability and risk negatively affect the left tail of the one-year-ahead GDP growth distribution: the former has the largest impact at the medium to long term horizon, while the latter is only significant at the short term horizon. Our GDP-at-risk measure signals economic recessions, whether fueled by financial stress or imbalances, reaching negative values before 2008 and stagnating at low levels before the European Sovereign Debt Crisis (ESDC). To provide policymakers with better tools to signal an increase in the likelihood of an economic crisis, we compute a set of complementary risk measures that can complement the GDP-at-risk analysis.
Exploring the relationship between the financial system and the business cycle has been one of the core topics in macroeconomics since the Great Financial Crisis (GFC) in 2008. A relevant strand of literature focuses on the non-linear nature of this relationship, stressing how financial distress can cause deep and long-lasting economic recessions, which diverge strongly from the regular business cycle behavior. For this reason, it is important to identify the accumulation of systemic risk early enough to enable timely and preemptive policy intervention, if needed. Our recent work (De Lorenzo Buratta et al. 2022) assesses the impact of the financial situation on GDP growth in Portugal at different projection horizons. We follow the Growth-at-risk methodology (Adrian et al. 2019) to study the conditional distribution of future GDP growth focusing on its lowest realizations and build risk measures to potentially support macroprudential policy decisions.
Quantile regressions (Koenker and Bassett, 1978) and local projections (Jordà, 2005) are combined to assess the link between the measures of financial risk and vulnerabilities and the distribution of future GDP growth at different projection horizons. We start by estimating the marginal effects of the explanatory variables for each percentile between 1% and 99%, and for projection horizons going from 1 to 12 quarters. The main estimation results are discussed in section 3. Taking into account these results, the projections of GDP growth at each percentile and horizon are fitted to a conditional distribution, as in Adrian et al. (2019) and De Santis and Van der Veken (2020). Several risk measures can then be computed from the conditional distribution.
In terms of estimation, two approaches can be followed: in-sample and pseudo real-time estimation. In the first exercise, the results are obtained from a model estimated using all the available observations. The sample includes data from 1991Q1 to 2019Q4. In the second exercise, the model is estimated using dynamic samples of observations starting in 2005Q1 – in which observations are added one at a time. The aim is to simulate a real-time exercise and mimic the environment faced by policymakers. In this Policy Brief, we concentrate on this last approach when commenting the risk measures in sections 4 and 5.
The specified model considers as dependent variable the year-on-year rate of change of real GDP (henceforth GDP growth) projected h quarters ahead. As explanatory variables, it includes the contemporaneous GDP growth, to avoid potential endogeneity issues, the systemic risk indicator (SRI) and the financial stress indicator (CLIFS). SRI is a composite indicator proposed by Lang et al. (2019), which contains information regarding domestic credit, residential real estate markets, external imbalances, and private sector debt burden, and can be thought as a measure of financial vulnerability. CLIFS (Duprey et al. 2017) is an index that aims at identifying, in a timely fashion, stress in equity, bond and foreign exchange markets. This indicator provides contemporaneous information about financial market turmoil and it can be considered as a measure of systemic financial stress.
For the one-year-ahead horizon, we find that adverse developments in financial vulnerabilities or risk, approximated, respectively, by SRI and CLIFS, have a larger impact on the lower percentiles of the conditional GDP growth distribution, normally associated with negative GDP growth. Both SRI and CLIFS have negative and statistically significant estimated marginal effects on all percentiles below the median. Regarding the percentiles above the median, the estimated marginal impacts are not statistically significant. Consequently, following a deterioration in the financial situation and all else equal, the one-year-ahead conditional GDP growth distribution will be characterized by a “heavier” left tail. Accordingly, extreme realizations may occur more frequently and the uncertainty linked to the projections also increases.
For the three-years-ahead horizon, the estimated marginal effects of SRI and CLIFS diverge mainly because these indicators signal developments in the financial situation at different horizons. The SRI shifts to the left the whole distributions at the three-years-ahead projection horizon, meaning that the build-up of cyclical systemic risk can cause longer recessions (since it predicts a downfall of the whole economic outlook in the medium to long term). These conclusions are in line with the aim of the SRI, i.e. signaling the potential materialization of vulnerabilities accumulated in the medium to long term. As such, its contribution to the conditional GDP growth distribution is more relevant at the medium to long term. In what concerns CLIFS, it does not impact the left tail but it has a negative marginal effect on the median to upper tail percentiles, indicating that an increase in financial stress is linked to a deterioration of the medium to long term economic outlook.
The GaR measure, defined as the 10th percentile of the conditional GDP growth distribution, proxies the risk of extreme (negative) realizations of GDP growth in the future. The use of this indicator can provide useful information on systemic risk and vulnerability build-ups, which are potentially detrimental for economic activity. It is worth stressing that predicting an event that has never happened — as in the case of the GFC — is a difficult task for any model. Nevertheless, ahead of the GFC, the GaR estimated for the one-year-ahead horizon goes into negative regions, which can be interpreted as a signal of future deterioration in economic activity (Figure 1). The warning properties of this measure make it potentially useful from a policymaker perspective, namely for macroprudential policy measures that should act when systemic risk begins to rise. However, it must be observed that one year may not be enough to fully implement preemptive policy measures to mitigate the impact of a financial crisis and its spillover effects on economic activity. The GaR measure estimated for 2009Q1 matches the magnitude of the trough of the observed GDP growth and remains low and negative within the period 2009-2013. This last result suggests that the model detects some systemic risk even if a recovery of GDP growth is observed between the two crises. The inclusion of CLIFS in the model, which accounts for bond market volatility, allows the GaR measure to capture the build-up of risk driven by financial imbalances in the public sector and signals the imminent ESDC. The GaR estimated for the three-years-ahead shows poor results in signaling risk before the GFC and the ESDC. This result stems from SRI being the only significant explanatory variable in the medium to long term. After the two crises, both GaR measures show a significant recovery accompanying the evolution of GDP growth. At the end of our sample and before the COVID-19 pandemic onset, GaR measures start decreasing slowly, mainly driven by the fall in the positive contribution of the SRI since 2015.
Figure 1: GDP-at-risk
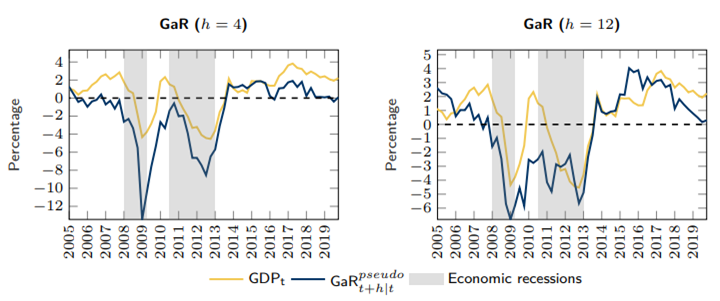
Notes: h denotes the number of quarters ahead of the estimation. ![]() denotes the pseudo real-time estimation. GaR at time t is computed using observed values of the explanatory variables at t (for example,
denotes the pseudo real-time estimation. GaR at time t is computed using observed values of the explanatory variables at t (for example, ![]() at 2009Q4 is the projection made for time 2010Q4 using information up to 2009Q4). Dates for the economic recessions as defined in Rua (2017).
at 2009Q4 is the projection made for time 2010Q4 using information up to 2009Q4). Dates for the economic recessions as defined in Rua (2017).
To provide policymakers with more efficient tools to identify systemic risk, we compute a set of complementary risk measures that may be included in monitoring frameworks, as focusing only on the 10th percentile of the estimated GDP growth distribution may be too restrictive. We argue that measures exploring other parts or even the whole conditional GDP growth distribution may be an appropriate complement to GaR. Figure 2 presents the results for the one-year-ahead horizon.
To capture the dispersion/concentration of the distribution, we define the lower tail to median distance and the lower to upper tail distance.2 The results suggest that these measures are useful tools to complement GDP-at-risk in anticipating economic recessions. The lower to upper tail distance, in particular, shows a clear downward trend before 2008. Both measures do not follow much the GDP growth recovery ahead of the ESDC: the left tail stays “heavier” relatively to the median and the right tail, meaning that the measures keep detecting systemic risk.
The distribution moments can give some insights on the evolution of the distribution. For example, the kurtosis measures the flatness of the distribution against the normal distribution. A reduction in kurtosis means that the distribution is getting flatter and the occurrence of extreme values of GDP growth becomes more likely. Our results show that kurtosis moderately declines before the GFC and remains stably low until 2014, signaling the likelihood of extreme GDP growth values. Skewness is a measure of the symmetry of the distribution. The one-year-ahead conditional GDP growth distribution is biased towards the right, meaning that the right tail is larger than the left one. As crises approach, skewness moves closer to zero, indicating that the distribution gets more symmetric and that the tails become similar. This result can be a warning signal since more extreme (lower) outcomes become more likely.
The expected shortfall (ESF) and the expected longrise (ELR) are the expected values of GDP growth conditional on being at the distribution’s lower and upper tail, respectively. The ESF can help complement the GaR, as it comprises information about all the tail behavior of the conditional distribution. The ELR can provide insights regarding whether there are shifts in the distribution versus changes in its shape. After the GFC and during the ESDC, we observe a deterioration of both the ESF and the ELR. This result indicates a shift to the left of the distribution, thus a more negative outlook for economic activity.
We also compute the probability of observing a negative GDP growth rate. In addition, we obtain the expected value of the conditional GDP growth distribution subject to observing a negative growth rate. The probability of a negative growth rate anticipates, with an upward trend, the beginning of the GFC by one year. Moreover, we estimate a probability of approximately 50% in 2008, which strongly indicates rising risks for economic activity in a moment when the GDP growth was still positive. The estimated negative growth probability rate peaks in 2009, highlighting that – six months before the beginning of the ESDC and despite a positive GDP growth rate – the likelihood of observing a negative GDP growth realization in the future was high. The conditional expected value for negative realizations of GDP growth does not exhibit overall additional early warning power compared to GaR. Nevertheless, between 2014 and 2018, despite the low probability of observing a negative GDP growth, this measure exhibits low levels. This result signals a still highly vulnerable economic environment.
Figure 2: Complementary risk measures for the one-year-ahead horizon
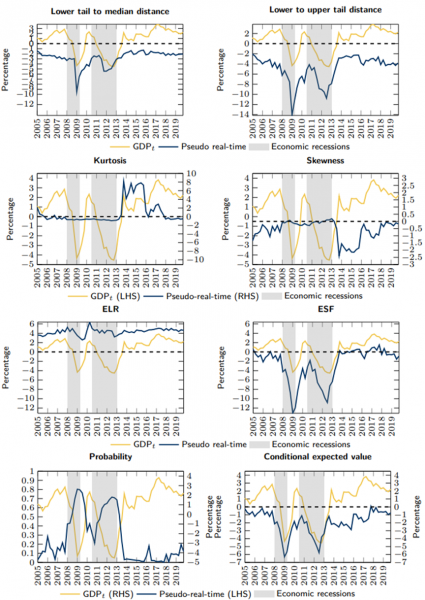
Notes: The measures at time t are computed using observed values of the explanatory variables at t (for example, a measure’s value at 2009Q4 is the projection made for time 2010Q4 using information up to 2009Q4). The expected shortfall (ESF) and the expected longrise (ELR) are the expected values of GDP growth conditional on being at the distribution’s lower and upper tail, respectively. Probability stands for probability of observing a negative GDP growth rate, while conditional expected value stands for the expected value of the conditional GDP growth distribution subject to observing a negative growth rate. Dates for the economic recessions as defined in Rua (2017).
5.1 The Great Financial Crisis: comparing the performance of different indicators
As an additional exercise, we focus on the GFC period to evaluate how GaR measures could have supported policymaker’s decisions. We estimate and project the distribution of GDP growth h quarters ahead taking into consideration the conditions that prevailed in 2007Q1, prior to the GFC onset. The projected values for GDP growth are then used to compute the measures discussed above (Figure 3).
GaR starts decreasing before 2008, attaining negative values during the crisis. Nevertheless, the fall in GaR does not seem to fully capture the dimension of risks and vulnerabilities accumulated over the years and the magnitude of the fall in GDP growth. This result suggests how important post-2007 information is for the measure performance. The expected shortfall captures the magnitude of the drop in GDP growth more precisely than GaR, mainly because this metric comprises all the information in the left tail. Even if projections only encompass 2007Q1 information – when there was no clear evidence of an upcoming crisis – the probability of observing a negative GDP growth increases from 1% in 2007Q2 to 22% in 2009Q1. Kurtosis indicates that the distribution starts to be more concentrated when GDP growth reaches its lowest realizations. Considering this result together with the decreasing ESF dynamics, we can conclude that the GDP growth distribution is concentrating on low values. Skewness shows how the estimated conditional distribution of GDP growth becomes more asymmetric and biased towards the left as we approach the trough of GDP growth.
To sum up, one year before the beginning of the crisis, our measures predict risks for economic activity and higher uncertainty surrounding future GDP growth, mainly stemming from the accumulation of higher financial vulnerabilities. However, one-year anticipation may not be enough for financial stability objectives, since macroprudential tools, such as capital-based measures, need time to be built up.
Figure 3: Estimated risk measures given information at 2007Q1
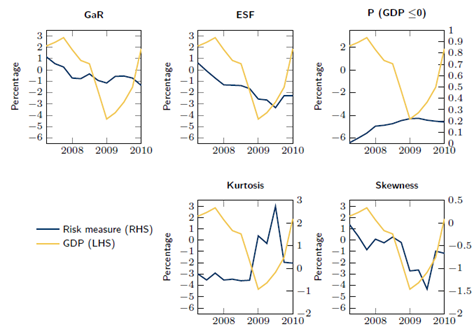
Notes: The expected shortfall (ESF) is the expected value of GDP growth conditional on being at the distribution’s lower tail. P(GDP≤0) stands for probability of observing a negative GDP growth rate.
This Policy Brief assesses the impact of financial vulnerabilities and risk on GDP growth for Portugal, with a focus on the likelihood of low GDP growth realizations. Using a quantile regression approach, we analyzed the marginal effect of vulnerability and risk indicators, and we explore risk measures to signal the increase in the likelihood of an economic crisis.
The GaR measure is a reliable risk-signaling tool for economic recessions, whether the crisis was triggered by financial stress or financial imbalances. The use of this indicator can provide useful insight on the rising of systemic risks and vulnerabilities that could harm economic activity and complement the assessment of the need to implement macroprudential measures to tackle them, if needed.
With the objective to provide policymakers with better tools to identify systemic risk, we compute a set of complementary risk measures, since focusing only on the 10th percentile of the estimated GDP growth distribution may be limiting. Overall, the risk measures show early warning properties and could potentially support macroprudential policy implementation, enhancing the effectiveness of those measures — like capital buffers — that must anticipate and help to mitigate the rise in systemic risk. Nevertheless, these measures seem to perform more poorly at a three-year projection horizon, and a one-year anticipation may not be enough to fulfill financial stability objectives.
Adrian, Tobias, Nina Boyarchenko, and Domenico Giannone (2019). “Vulnerable Growth.” American Economic Review, 109(4), 1263–1289.
De Lorenzo Buratta, Ivan, Marina Feliciano, and Duarte Maia (2022). “How Bad Can Financial Crises Be? A GDP Tail Risk Assessment for Portugal.” Working Paper Series 04, Banco de Portugal (Available at: https://www.bportugal.pt/en/paper/how-bad-can-financial-crises-be-gdp-tail-risk-assessment-portugal).
De Santis, Roberto and Wouter Van der Veken (2020). “Forecasting macroeconomic risk in real time: Great and Covid-19 Recessions.” Working Paper Series 2436, European Central Bank.
Duprey, Thibaut, Benjamin Klaus, and Tuomas Peltonen (2017). “Dating systemic financial stress episodes in the EU countries.” Journal of Financial Stability, 32(C), 30–56.
Jordà, Òscar (2005). “Estimation and Inference of Impulse Responses by Local Projections.” American Economic Review, 95(1), 161–182.
Koenker, Roger and Gilbert Bassett (1978). “Regression Quantiles.” Econometrica, 46(1), 33–50.
Lang, Jan Hannes, Cosimo Izzo, Stephan Fahr, and Josef Ruzicka (2019). “Anticipating the bust: a new cyclical systemic risk indicator to assess the likelihood and severity of financial crises.” Occasional Paper Series 219, European Central Bank.
Rua, António (2017). “Dating the Portuguese business cycle.” Economic Bulletin and Financial Stability Report Articles and Banco de Portugal Economic Studies.
|
About the authors Ivan De Lorenzo Buratta is an economist in the Macroprudential Policy Division of the Financial Stability Department of the Banco de Portugal since 2020. He holds a PhD in Economics, Law and Institutions and a Master’s degree in International and Development Economics from University of Rome “Tor Vergata”. His recent research interests include macroprudential policies and Financial Stability, Monetary Policy, Forecasting, Big Data and Machine Learning, De-Fi. Marina Feliciano is a predoctoral research assistant at the Centre for Macroeconomics, London School of Economics. She holds a Master’s degree in Economics from Nova School of Business and Economics. Marina was an intern at the Financial Stability Department at Banco de Portugal. Duarte Maia is an economist in the Macroprudential Policy Division, in the Financial Stability Department at Banco de Portugal and a PhD candidate in Economics at University of Minho. His education includes a Master’s degree in Mathematical Economics and Finance at University of Minho. His current research interest includes financial frictions, DSGE modelling and macroprudential policy. |
These measures correspond to the difference between the 10th percentile and the 50th percentile and the difference between the 10th percentile and the 90th percentile of the estimated conditional distribution of future GDP growth.