This Policy Brief is based on authors article “Why Did Bank Stocks Crash during COVID-19?” in the Review of Financial Studies, Volume 37, Issue 9, September 2024, Pages 2627–268, published by Oxford University Press on behalf of The Society for Financial Studies.
The significant drop and partial recovery of bank stock prices during the COVID-19 pandemic can be explained by a “credit-line channel” that involves both drawdowns and repayments. Banks with higher exposure to undrawn credit lines experienced more significant stock price declines during the crisis but tended to perform better during non-crisis periods. Although banks saw an influx of deposits, the high level of drawdowns resulted in reduced lending, indicating that drawdowns encumbered capital. The subsequent repayments of these credit lines freed up capital, which contributed to the recovery in stock prices starting in Q2 2020. The provision of credit lines by banks is akin to writing put options on aggregate risk, and we suggest incorporating this aspect into bank stress tests.
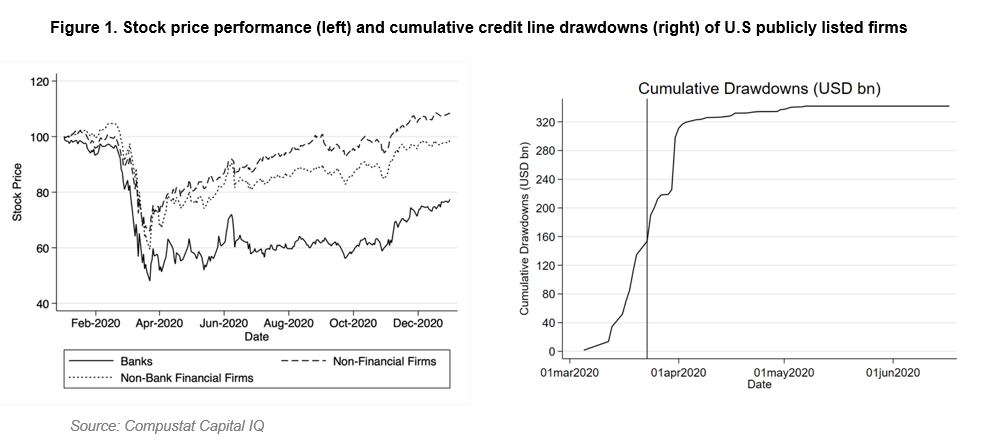
At the onset of the COVID-19 pandemic in March 2020, stock prices of U.S. publicly-listed financial and non-financial firms plummeted. However, while stocks of non-financial firms fell about 30%, on average, over the March 1 to March 23, 2020 period, bank stock prices dropped almost 50% (Figure 1, left). At the same time, non-financial corporates drew down more than USD 300 billion from their pre-arranged credit lines as Figure 1 (right) suggests. On March 23, the Federal Reserve intervened providing liquidity also to non-financial firms. Interestingly, while stock prices of non-financial firms recovered quickly after the intervention, bank stock prices remain depressed and consistently underperform those of non-financial firms.
In Acharya et al. (2024), we investigate causes and consequences of this crash of bank stocks during the COVID-19 pandemic and focus on the role of bank liquidity provision via credit lines as a source of (aggregate) risk for banks and financial stability.
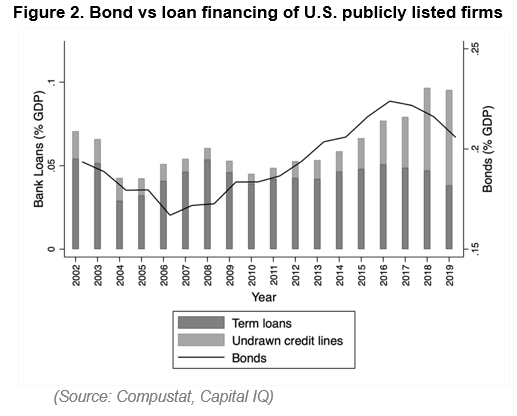
Over the last two decades, total debt financing of U.S. publicly listed firms has increased significantly, growing faster than the U.S. Gross Domestic Product (GDP)1. Bond financing, for example, increased by 1.2 percentage points (pp) relative to GDP over the 2002 to 2019 period. Altman (2021) shows that particularly corporate bonds issued by BBB-rated firms quadrupled over this period and that about 40% of BBB-rated firms should have a non-investment-grade rating based on an assessment of their respective credit quality. Since the global financial crisis (GFC) of 2008–09, banks have also greatly expanded lending to the U.S. non-financial sector by providing contingent liquidity through (off-balance sheet) credit lines. Figure 1 shows that bank credit lines increased from 0.7% of GDP in 2009 to 5.7% of GDP in 2019 leading to a substantial build-up of aggregate drawdown risk on bank balance-sheets.
Consistently, our investigation into the growth of credit lines compared to commercial and industrial (C&I) loans shows that credit lines have grown from 11% of bank assets in 2010 to 19% by 2019, while C&I loans have remained relatively stable, hovering around 10% of bank assets. This indicates that the credit line business has become increasingly significant for banks compared to term loan funding.
A credit line is a commitment made by a bank to a firm to provide liquidity upon demand. The contract specifies that the firms can draw down the credit line (and repay) as often as the firm requests, up to the specified amount and at agreed terms (spread, fees and covenants) until maturity. This “drawdown option” becomes more valuable for firms when credit line and spot market terms deviate, i.e., when either the firm’s credit quality or overall market conditions deteriorate relative to the time when the credit line was arranged.
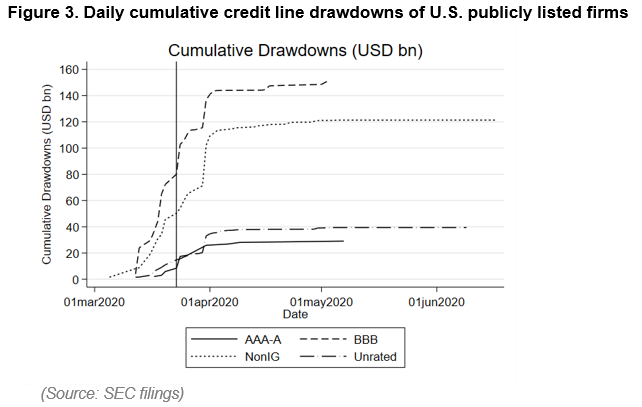
The drawdown risk on bank credit lines materialized in March 2020 amid the outbreak of the COVID-19 pandemic. The global shutdown as a response to the COVID-19 outbreak and uncertainty associated with its consequences caused bond markets to freeze as firms’ cash flows dropped, while operating and financial leverage remained sticky. Firms, even some of the best-rated ones, responded and drew down pre-arranged credit lines at a far greater intensity than in the past recessions (Acharya and Steffen, 2020 a,b). Figure 3 shows that particularly the prospective fallen angels or BBB-rated and junk-rated firms utilized their credit lines relative to other firms.
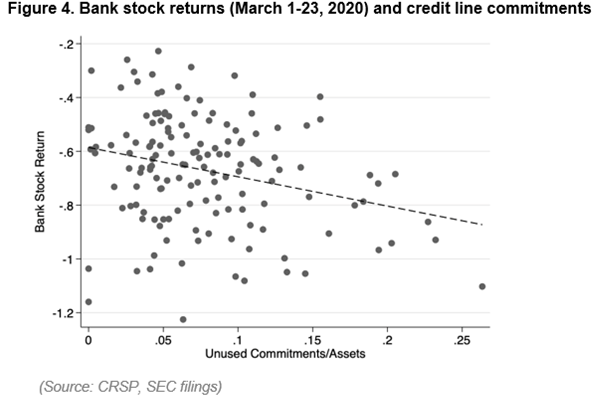
Firms benefited from having access to liquidity via credit lines (Acharya and Steffen, 2020; Chodorow-Reich et al., 2022; Greenwald et al., 2023), including in stock market valuations. On the flip side, however, banks faced unprecedented aggregate risk in the form of a correlated demand for credit-line drawdowns; an important but not well-appreciated consequence is that banks’ share prices crashed and persistently underperformed those of non-financial firms as well as non-bank financial firms (compare Figure 1 above). In Figure 4, we plot bank realized stock returns over the March 1-23, 2020 period against banks’ unused credit line commitments (scaled by total assets) as of Q4 2019. We observe a significant negative correlation, that is, banks with higher ex-ante credit line commitments to firms experienced a larger decline in their share prices at the beginning of the COVID-19 pandemic.
In Acharya et al. (2024), we show that this effect is unrelated to other bank balance sheet risk measures, and also independent of the effect on bank stock returns of bank portfolio exposures to COVID-affected industries. Importantly, we show that this effect is highly episodic in nature. That is, it was economically meaningful during the March 1-23, 2020 period, when credit line drawdowns were highly correlated among firms, but not before, when drawdowns were rather idiosyncratic in nature. This is consistent with the interpretation that banks were effectively writing put options on aggregate risk which materialized during the COVID-19 pandemic when capital markets froze.
What explains the drop in bank stock prices? There are two natural explanations for this effect, either a “liquidity channel” (as banks need a large amount of funding liquidity to pay out during drawdowns) and a “capital channel” (as the loan that enters bank balance sheets upon drawdowns needs to be capitalized at a higher level than the undrawn credit line).
The data does not support the liquidity-based explanations during the COVID-19 outbreak. First, an earlier intervention through central bank swap lines by the Federal Reserve on 15 March, 2020 stabilized the OIS-spread (a measure for liquidity conditions in financial markets). This did not stop the drop in bank stop prices. Second, while drawdowns were large, firms deposited the drawn amounts back with banks. In fact, the aggregate banking deposits were larger than the drawdowns.
Holding bank liquidity constant, we show quantitatively in Acharya et al. (2024) that banks with larger drawdowns experienced more negative stock returns. Moreover, these effects were larger when banks had smaller capital buffers. Overall, banks’ credit line commitments seem to represent an aggregate risk influencing stock returns, as credit line drawdowns encumber bank capital away from more lucrative intermediation opportunities such as term lending to non-financial firms. Using a Khwaja and Mian (2008) estimator (to control for loan demand), we investigate the change in lending of banks to the same borrower before and after the outbreak of the pandemic. We find that banks that incur a greater negative impact on equity capital through large credit line drawdowns reduce lending more than other banks.
Importantly, bank stock prices lagged non-financial firms also after the significant fiscal and monetary interventions of March and April 2020. We explain this with a “two-sided credit-line channel,” highlighting firms’ dual options with credit lines: drawing funds and repaying (or conversely, withholding repayment). The significance of the repayment option is key to understanding banks’ stock performance after the pandemic outbreak. As capital markets revived in Q2 and Q3 2020, top-rated firms began repaying bank credit lines. We measure credit-line repayments using data from the FDIC, Refinitiv Dealscan, and Capital IQ. Two variables—liquidity returned to banks and “revenue differences”—reveal that both options embedded in bank credit lines influenced the partial recovery of bank stocks in 2020Q2. Revenue differences are measured as the difference in the revenue earned by banks from fees and interest rates between the drawn credit line and potential alternative investments of similar risk profiles. Repayments improved liquidity, but banks preferred repayments from lines with lower (opportunity cost-adjusted) adjusted fees, i.e., from riskier borrowers. However, as bond market conditions eased, it was the safer firms that repaid banks more, leaving a persistent impact of credit line drawdowns of March 2020 in the form of bank capital encumbrance. This finding underscores the importance of the capital channel in understanding the impact of credit lines on stock returns.
How can policymakers proactively manage this aggregate drawdown risk? We suggest incorporating these commitments into stress tests to better assess capital requirements during aggregate stress periods. We extend the SRISK concept of NYU Stern VLAB (vlab.stern.nyu.edu/srisk), proposed first in Acharya, Engle and Richardson (2012), which estimates expected capital shortfalls during stress. Specifically, we extend SRISK to account for contingent credit line drawdowns. Our proposal involves two adjustments: (1) accounting for the required equity when contingent liabilities are drawn down to become on-balance-sheet liabilities during stress, and (2) reflecting the negative impact of liquidity risk on a bank’s stock market value during stress (e.g., due to capital encumbrance and the repayment channels explained above).
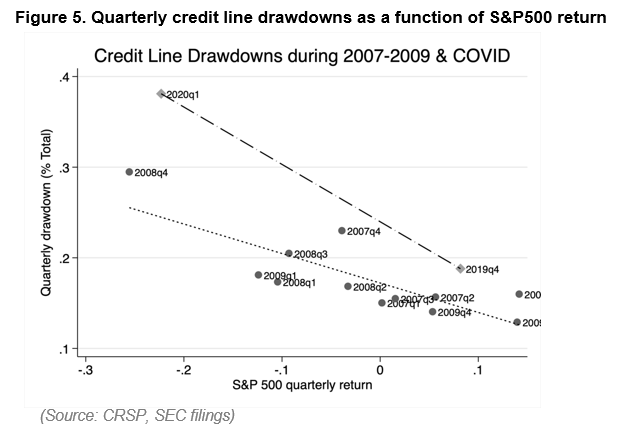
In Figure 5, we plot the cumulative quarterly drawdown rates during the COVID-19 pandemic (i.e., Q4 2019 and Q1 2020) and the GFC (i.e., Q1 2007 to Q4 2009) as a function of the respective quarterly S&P 500 returns. We also show the linear regression fits for both periods. We find that credit-line drawdowns were more sensitive to market return changes during the COVID-19 pandemic (β = -0.57) than during the Global Financial Crisis (β = -0.27). In a 40% market downturn, the projected drawdown rate was significantly higher during the pandemic (39.97% vs. 25.79%). This difference may be due to the COVID-19 pandemic’s direct impact on corporate balance sheets, increasing firms’ demand for liquidity from credit lines, unlike the Global Financial Crisis, which primarily affected the banking and household sectors.
These drawdown rates imply in our calculations an additional capital deficit of over $366 billion for the U.S. banking sector by the end of 2019, with the top 10 banks facing a shortfall 1.7 times greater in a severe stress scenario.
In summary, our research highlights the critical role of contingent liquidity commitments via credit lines in the decline of bank stock prices during the early phase of the COVID-19 pandemic. We identified credit line drawdowns as a key factor influencing bank stock returns, independent of banks’ exposure to COVID-affected sectors. Our analysis separated two channels for this influence, viz., the “funding channel” and the “capital channel,” and found evidence consistent with a capital channel in which drawdowns encumber bank capital with significant opportunity costs. In particular, effects of credit line drawdowns on bank stock returns were attenuated for banks that had more capital and strong capital buffers.
Conversely, the recovery of bank stock prices in Q2 2020 was significantly influenced by credit-line repayments. Again, we identified two crucial factors: the liquidity returned to banks and the revenue difference between drawn credit lines and alternative investments, finding strong support for the latter. This finding also underscores the importance of opportunity costs of bank capital from drawdown risks.
Going forward, our findings suggest that the increased corporate leverage since the pandemic has likely heightened the potential impact on bank stock returns from the credit-line drawdown channel in future economic shocks. This makes it important for regulatory stress tests to consider aggregate drawdown risk and its effects on bank equity capital. Our estimates suggest that the incremental bank capital requirement from such aggregate drawdown risk could be substantial.
Acharya, V., R. Engle, M. Jager and S. Steffen, 2024, Why Did Bank Stocks Crash During COVID-19? Review of Financial Studies, forthcoming.
Acharya, V., Engle, R., and Richardson, M, 2012, Capital shortfall: A new approach to ranking and regulating systemic risks. American Economic Review 102(3), 59-64.
Acharya, V. and S. Steffen, 2020a, The Risk of Being a Fallen Angel and the Corporate Dash for Cash in the Midst of COVID. Review of Corporate Finance Studies 9 (3), 430-71.
Acharya, V. and S. Steffen, 2020b, ‘Stress Tests’ for Banks as Liquidity Insurers in a Time of COVID. CEPR VoxEU.org.
Chodorow-Reich, G., O. Darmouni, S. Luck, and M. Plosser, 2022, Bank Liquidity Provision across the Firm Size Distribution. Journal of Financial Economics 144 (3), 908-32.
Li, L., P. Strahan, and S. Zhang, 2020, Banks as Lenders of First Resort: Evidence from the COVID-19 Crisis. Review of Corporate Finance Studies 9 (3), 472-500.
Khwaja, A. and A. Mian, 2008, Tracing the Impact of Bank Liquidity Shocks: Evidence from an Emerging Market. American Economic Review 98 (4), 1413–42.
Berg et al. (2021) provide an overview of salient trends in corporate borrowing of U.S. publicly listed firms.