This policy brief discusses the potential global spillovers of carbon prices introduced in different jurisdictions. It presents results from the multi-sector, multi-region production network model derived in Frankovic (2022). The model uses the World Input-Output Database (WIOD) to calibrate intersectoral trade between seven regions and 56 economic sectors per region as well as EXIOBASE’s sectoral accounts of greenhouse gas emissions to calibrate emission costs. The simulated sectoral impacts of carbon taxes are highly heterogeneous, with the mining, fossil fuel processing and transport sector exhibiting the largest impacts. For several sectors in Germany and Europe international spillovers from foreign carbon pricing can be substantial and increase value added losses by up to 100% relative to losses from local carbon prices.
In order to stay within the remaining carbon budget consistent with the Paris Agreement climate goal, a worldwide transition to a low-carbon economy is necessary (IPCC, 2018). Even though climate policies aimed at inducing such a transition are strongly cost-effective in the long run, they are likely to lead to short and medium-term economic costs (IMF, 2020). For example, the pricing of greenhouse gas emissions can result in increased energy prices and render existing business models unsustainable. In academia and at central banks, many have expressed concerns about these transition costs posing a potential risk to financial systems. To measure and assess such transition risks, central banks and supervisors have adopted the use of climate scenarios. However, these do usually not disaggregate economic effects on a sector level, preventing a more granular analysis of the exposure of financial intermediaries to transition risks. To address this lack of sectoral heterogeneity in climate scenarios, a multi-sector and multi-region production network model with carbon pricing was developed in Frankovic (2022).2
As I will argue in this policy brief and shown in Frankovic (2022), the effect of carbon pricing is not restricted to the jurisdiction where policymakers introduce it. Instead, carbon prices propagate through global supply chains and affect economic sectors in other regions despite them not being emission-intensive themselves. To which degree sectors are subject to spillovers across regions is a function of their position in supply chains.
The model belongs to the class of production network models and builds directly upon the contribution of Devulder and Lisack (2020). In the model, economic sectors not only produce goods for final consumption but also inputs to be used in the production of other economic sectors. Each sector decides on the amount of inputs bought from other sectors, depending on their price and substitutability with other inputs. Substitution elasticities across energy and non-energy sectors are separately calibrated according to empirical evidence. The model is set up to reflect seven regions (Germany, rest of euro area, rest of Europe, US, China and two rest of the world blocks) and 56 sectors for each region, classified in NACE 2-digit codes. The solution of the model without carbon taxes reflects the intersectoral trade within and across country borders as reported in the World Input-Output Database (WIOD), see Timmer et al. (2015).
I then analyze the impact of carbon prices on the production network. Carbon pricing is implemented in three ways to account for the different sources of greenhouse gas emissions in the economy: a) a tax on production inputs purchased from the fossil fuel sector, which introduces an incentive to substitute away from them, b) a production tax levied on emissions not accruing through the combustion of fossil fuels, which are thus inherent to production, and finally, c) a household tax on the final consumption of fossil fuels, which again prompts a substitution away to less carbon-intensive final goods. The level of carbon taxes on the sectoral level is calibrated according to sectoral emission data in the EXIOBASE database, see Stadler (2018).
The taxes make fossil fuel inputs more expensive, triggering a substitution towards other inputs and consumption goods. Some of the emission costs are passed on through price increases, which trigger a cascade of substitution and repricing effects, at the levels both of input choice and final demand. The model thus captures the entire propagation of carbon taxes through the global production network. Due to the large size of the model, I abstract from modeling the transition and only solve for the initial zero carbon tax steady state as well as the steady-state solution for carbon pricing in place. While the model thus lacks a temporal dimension, the differences in levels across these two states should be interpreted as the medium- to long-run effect of carbon pricing.
Table 1 shows the GDP impact of a 100 euro carbon price introduced in different jurisdictions. A unilateral introduction of carbon prices in Germany (first row) reduces GDP by 0.45% while leaving other jurisdictions relatively unaffected, reflecting the limited weight of German goods and services in their economy and the ability to substitute away to output from regions without any carbon pricing.
Table 1: GDP impact of a 100 euro carbon price
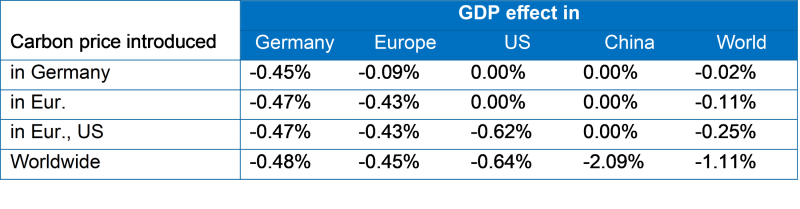
As carbon pricing is in place in more jurisdictions (moving down the rows of table 1), not only domestic taxes shape the effect on Germany but also spillovers from international policy, the latter consisting of two opposing effects.
First, the introduction of carbon pricing elsewhere removes the competitive disadvantage of unilateral climate policy. If Germany alone introduces carbon pricing, its price level increases by 1.5 percentage points more than in the rest of the world. As global carbon prices are introduced, Germany in fact experiences lower price increases as compared to China and about the same as observed in Europe, the US and other developed countries.
Second, carbon prices outside of Germany also reduce economic activity among its trading partners and thus lower demand for German exports. The two opposing effects seem to roughly cancel each other out since the effect on Germany GDP does not increase by much as more regions face carbon pricing. Similarly, the effect of European-only and global carbon prices on Europe is roughly equal with a GDP loss of just under 0.5%. Hence, aggregate spillovers from international carbon pricing seem to be small. However, this hides a lot of heterogeneity across sectors, as one of the two channels can be dominating on the sectoral level.
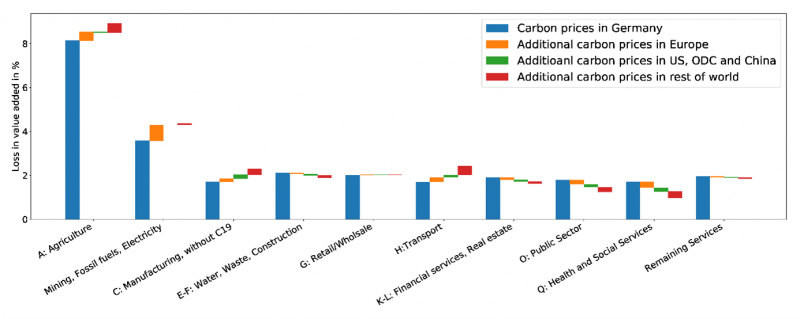
Figure 1 shows the sectoral losses in gross value added in Germany associated with the carbon price introduction in different regions. To gain a better overview, I have grouped the 56 sectors of the model into 10 sector groups. The figure reveals that carbon prices introduced in Germany drive most of the sectoral gross value added losses. Carbon pricing outside of Germany nevertheless has a sizable impact. Interestingly, while in some sectors international spillovers tend to increase losses, they actually reduce them in others. For example, manufacturing sector (C) gross value added losses increase by 8% when shifting from German-only to European carbon prices and by a further 26% when moving to global carbon prices. German manufacturing sectors are well embedded in global supply chains. For that reason, they suffer a negative impact from global carbon prices because they not only export to the world, including to transition-sensitive sectors worldwide, that reduce input demand in response to carbon pricing, but also because they themselves receive inputs globally, a significant share of which come from transition-sensitive sectors. Similar patterns arise for agriculture, fossil fuel processing, mining and electricity as well as the transport sector.
The opposite picture arises for the service industries, which see their losses induced by German-only or European-only carbon prices fall considerably in response to more global carbon pricing. Hence, for these sectors, the removal of competitive disadvantages when moving to global carbon prices seems to be the dominating force.
Figure 1: Sectoral losses in GVA in Germany associated with carbon pricing in different regions
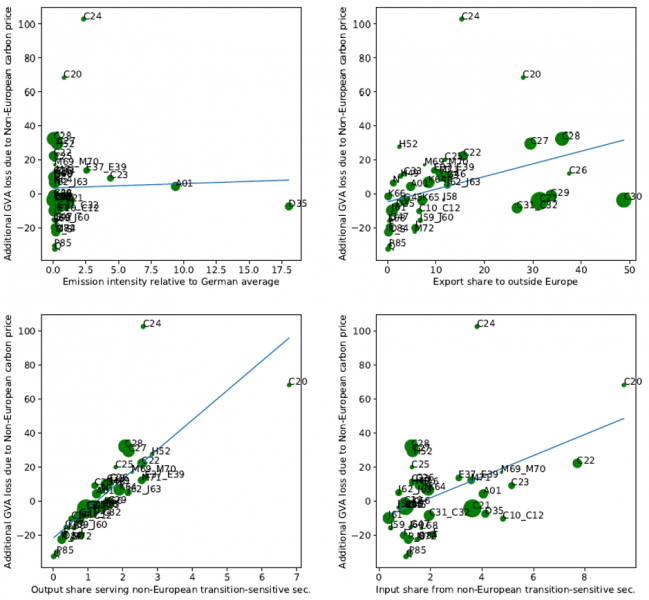
To make sense of this highly heterogeneous picture with respect to the exposure of different sectors to spillovers from global carbon pricing, I display in figure 2 different properties of all 56 sectors against the measure of additional gross value added losses from figure 1. I focus on German sectors, but the results for European sectors do not differ greatly. As the plots reveal, both the emission intensity of the sectors and their export share to outside of Europe are bad predictors of how much international spillovers aggravate losses. For example, the electricity sector (D35) is very emission-intensive but exhibits a very low degree of international spillovers, while many of the most export-oriented manufacturing sectors (C26-C30) exhibit modest degrees of spillovers.
We define sectors as transition-sensitive that, on a global level, lose more gross value added in response to a global carbon price than the average sector does. The output share going to non-European transition-sensitive sectors, a narrower measure than the overall export share, as well as the input share from these sectors are much better predictors for how much sectors are exposed to adverse international spillovers. For example, the manufacture of chemicals sector (C20) depends on non-European transition-sensitive sectors, both as providers of a substantial amount of inputs to production in C20 and as buyers of C20 output. Since those transition-sensitive sectors are hit strongly by carbon prices, they charge higher prices on their output and decrease the amount of inputs, hurting the German C20 sector twofold.
Figure 2: Determining factors for additional GVA losses due to non-European carbon prices
Hence, international spillovers from global carbon prices are highly heterogeneous and to a large degree determined by the position of these sectors in global supply chains. Sectors that depend on global transition-sensitive sectors are likely to be subject to substantial spillovers. Other sectors may not see their losses increase in response to global carbon prices, even though they themselves might be emission-intensive or highly exposed to world demand. A final note is warranted on a second transmission channel for carbon price spillovers. As financial systems of one region often also directly hold assets in sectors in other regions, transition stress can be transmitted through financial networks as well. This model presents a starting point for the analysis of such cross-border financial exposure as well.
Bundesbank (2021), Financial Stability Review 2021, Deutsche Bundesbank.
Devulder A and N Lisack (2020), Carbon Tax in a Production Network: Propagation and Sectoral Incidence, Banque de France Working Paper Series, 760.
Frankovic I (2022), The impact of carbon pricing in a multi-region production network model and an application to climate scenarios, Deutsche Bundesbank Discussion Paper, 07/2022.
IMF (2020), World Economic Outlook, October 2020: A Long and Difficult Ascent, Chapter 3: Mitigating Climate Change, available at https://www.imf.org/en/Publications/WEO/.
IPCC (2018), Summary for Policymakers. In: Global Warming of 1.5C. An IPCC Special Report on the impacts of global warming of 1.5C above pre-industrial levels and related global greenhouse gas emission pathways, World Meteorological Organization, Geneva, Switzerland.
Stadler K, R. Wood, T. Bulavskaya, C.J. Sodersten, M. Simas, S. Schmidt, A. Usubiaga, J. Acosta-Fernandez, J. Kuenen, M. Bruckner, S. Giljum, S. Lutter, S. Merciai, J.H. Schmidt, M.C.
Theurl, C. Plutzar, T. Kastner, M. Eisenmenger, K. Erb, A. de Koning, and A. Tukker (2018), EXIOBASE 3: Developing a Time Series of Detailed Environmentally Extended Multi-Regional Input-Output Tables, Journal of Industrial Ecology, 22(3), 502-515.
Timmer M. P., E. Dietzenbacher, B. Los, R. Stehrer and G. J. de Vries (2015), An Illustrated User Guide to the World Input-Output Database: the Case of Global Automotive Production, Review of International Economics, 23: 575-605.
The views expressed in this Policy Brief are those of the author and do not necessarily represent those of the Deutsche Bundesbank or the Eurosystem.
The methodology in Frankovic (2022) was applied in the chapter on climate-related financial stability risk in the Bundesbank’s Financial Stability Review 2021, see Bundesbank (2021).