Understanding the nature of the global inflationary linkages is important for policy makers to implement appropriate policies coordinated with international developments. In this note, we examine how real and monetary integrations link domestic inflation dynamics across countries. Using Turkish data, we find that fall in inflation gap between the partners is mainly related with the real integration, while co-movement of inflation is prominently driven by the monetary integration. The product-type analysis shows that inflation gap in tradable items shrinks and becomes more associated with the convergence and co-movement of real variables.
As economies become more interrelated due to both real and monetary integrations, policy makers seek to understand the nature of inflationary linkages between countries to implement appropriate policies coordinated with international developments. How different is the effect of real and monetary integrations on domestic inflation? Do these links differ by product type?
Within the context of international production linkages, components move across borders multiple times, resulting in a complex flow of value-added across countries. Any shock to domestic production is likely to be transferred to partner countries through input-output linkages and initiate a co-movement of domestic inflations.2 At the same time, while relocating production efficiently towards countries with lower costs (Acemoglu, et al. 2012), integration is likely to lead a gradual reduction in the production cost gap, and inflation gap between the partner countries (Grossman and Rossi-Hansberg 2008, Baldwin and Robert-Nicoud 2014).
The literature provides evidence of the effects of input-output linkages on the co-movement of inflation, but there is a lack of research on the inflation gap issue. We contribute to this literature by focusing on the differing impact of value-added trade, along with the ongoing monetary integration on both inflation gap and co-movement of inflation. To deepen our understanding of inflation dynamics, we work with disaggregated data to group items in the consumer basket according to their tradability (tradable/non-tradable). This is an important detail in our analysis as each of these items may be subject to different levels of international demand and supply shocks and display dissimilar responses. In fact, due to these heterogeneities, monetary authorities often monitor developments in the components of CPI individually.
Analysis covers 12 2-digit sub-items of CPI. Trade in value-added data is available at annual basis for the period of 2005-2015 in OECD-WHO TIVA database. We study Turkish case. One of the main reasons for this is that, as an emerging country, Turkey’s GVC participation index increased by 8.4 % from 2005 to 2015.3 This increase was higher than the average for both developed (4.1 %) and developing (6.5 %) countries. At the same time, as of 2005, Turkey switched to the explicit inflation-targeting regime, the common monetary policy implemented in the partner countries.
We built a panel data analysis to estimate separate equations for the inflation gap and the co-movement of inflation between Turkey and each of its 27 trade partners. Following the literature, co-movement is represented by the correlation coefficient between the relevant variables of Turkey and the partner country. The interquartile range indicator is used to proxy the gap between the variables. The interquartile range is one of the commonly used indicator and computed as a difference between the middle values of the upper and lower quartile ranked-ordered data set. Thus, increase in the interquartile range implies increase in gap in related variable.
We adopted 3-year moving windows approach to form a panel data involving home-partner pairs and time dimension. For instance, we compute inflation correlation between home and partner for the periods 2005-2007, 2006-2008, etc. By doing this, we able to capture medium to long-term trends in our core variables, and at the same time include both cross sectional and time dynamics into our models. The 3-year moving window approach not only allows us to capture rapidly changing patterns but also smooth out year-on-year unexpected changes.
The main explanatory variables in both estimated equations are bilateral trade in values-added to examine the impact of bilateral production integration on domestic price dynamics and bilateral developments in monetary policy to capture the monetary nature of inflation. We also add bilateral output gap to reflect business cycle effects and bilateral productivity growth to account for productivity shocks. Output gap and productivity growth related indicators are computed for the overall economy as well as for the sub-sectors (agriculture, manufacturing and services).
The bilateral value-added trade is attained by dividing the sum of “value added embodied in domestic final demand” and “domestic value added in foreign domestic final demand” to the sum of total value added in home and partner countries. Inflation targeting is the common monetary regime implemented by all countries used in this study during the analysis period. Accordingly, monetary policy rates are used to compute gap and correlation aspects of the monetary policies implemented in home and partners. Output gap is attained using Prescott-Hodrick filtering methodology. Productivity is measured as a ratio of output to labor cost.
Chart 1: Correlation and Convergence Trends in Core Variables
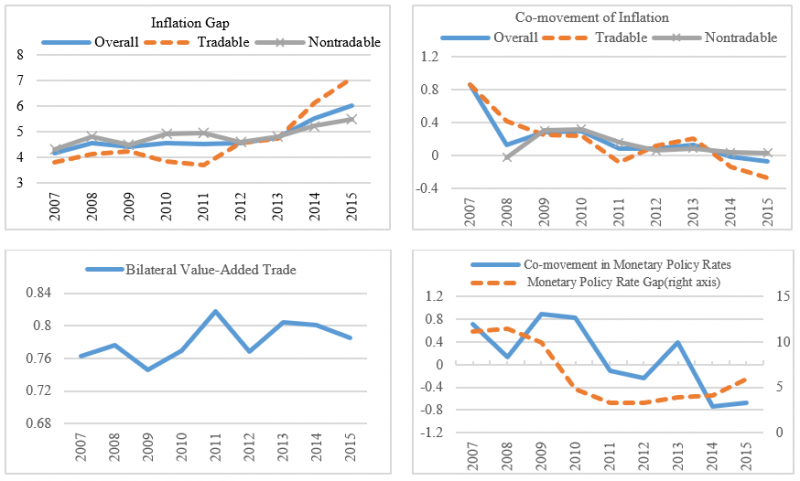
Table 1 (see Saygılı 2021) reports some basic descriptive statistics about overall inflation, 2-digit sub-items, and tradable/non-tradable items. The average gap in inflation vary within the range of 2.9-6.9 with the mean 4.8. The correlation coefficient between the inflation gap and co-movement indicators is about 0.3, and implies that as the inflation gap increases, the co-movement of inflation slightly weakens. On the average, inflation gap and correlation for tradable items are lower than those for non-tradable. Chart 1 visualizes the relationship between inflation dynamics and our core explanatory variables.
The findings suggest that the inflation gap is significantly related with the bilateral value-added trade in manufacturing, changes in output gap range in services and productivity growth range in agriculture, while the co-movement of inflation is mainly associated with the correlated monetary policy rates. Value-added trade is likely to have expected impacts once the global production integration reaches a certain level.
The estimated coefficient for output gap range is positive but insignificant for agriculture and manufacturing, while it is significant and negative for services. EU members and the US entered a disinflationary period together with a negative output gap after 2009-2010 financial crises. At the meantime in Turkey, prices were in an upward trend with a slightly positive output gap. Results indicate that this effect is prominent in services industry.
The widening in the range of productivity growth implies that production technologies between partners are becoming dissimilar. All coefficients estimated for sectoral productivity growth range are negative, but the impact is significant only when productivity growth range in agriculture is concerned. Examination of productivity growth in Turkey and partner countries reveals that after the 2009-2010 financial crisis, productivity gained an upward trend in partner countries but downward trend in Turkey.
CPI is composed of 12 2-digit sub-items, each with different trade structure. After, classifying items into two broad groups as tradables/non-tradables, following Johnson (2017) and Dixon et al (2005), this section investigates if there are systematic similarities in the model estimates.
Starting with the inflation gap analysis, Table 5 (Saygılı, 2021) shows that, although the difference is not statistically significant, value-added trade in manufacturing has higher impact on tradable items. The monetary policy rate range has no significant impact in any of the estimated equation. The estimated coefficients of the output gap range are negative and significant in the equations estimated for both product groups. While the increase in productivity growth gap in agriculture has a significantly negative impact on the inflation gap of both groups, the increase in productivity growth range in manufacturing has a significantly negative impact only on the tradable inflation gap.
Turning to the co-movement of CPI analysis, there are two additional conclusions driven from the results in Table 5. First, Table 4 suggests that correlated monetary policies has no statistically significant effect on the co-movement of overall inflation, while Table 5 shows that it is effective on the co-movement of non-tradable inflation. Second, tradable inflation is related to those in partners through co-movements of output gap in agriculture and productivity growth in manufacturing.
Findings of this study are consistent with those reported in Auer and Mehrotra (2014) for Asia-Pacific region and Baldwin and López-González (2013) for Asia. They show that real integration through the supply chain matters for domestic price dynamics in emerging countries of the Asia-Pacific region. However, present analysis has deepen our understanding of the linkage of real and nominal integration with the domestic price dynamics for emerging countries. These results are concern for policymakers. Our results suggest that correlated monetary policies may lead inflation rates to move together, while having no significant effect on decreasing inflation gap. The inflation gap between the partners is significantly related with the real integration. We provide evidence on the significant link between inflation gap and value-added trade in manufacturing, output gap (especially in services) and productivity growth gap (particularly in agriculture). These facts do not change with respect to the tradability of products. Product type analysis further shows that tradable inflation gap goes down at a higher rate and has stronger association with the convergence and co-movement of real variables.
Acemoglu, D., Gancia, G. and Zilibotti, F. 2012. “Offshoring and directed technical change,” NBER Working Paper 18595.
Auer, R. A., Borio, C., Filardo, A. 2017a. “The globalization of inflation: the growing importance of global value chains,” BIS Working paper 602.
Auer, R. A., Levchenko, A. A., Saure, P. 2017b. “International inflation spillovers through input linkages,” NBER Working paper 23246.
Auer, R. A., Mehrotra, A. 2014. “Trade linkage and the globalization of inflation in Asia and the Pacific,” Journal of International Money and Finance 49, 129-151.
Baldwin, R., Lopez-Gonzalez, J. 2013. “Supply-chain trade: A portrait of global patterns and several testable hypotheses,” CEPR discussion papers no: 9421.
Baldwin, R., Robert-Nicoud, F. 2014. “Trade-in-goods and trade-in-tasks: An integrating framework,” Journal of International Economics 22(1), 51–62.
Bowdler, C., Malik, A. 2017. “Openness and inflation volatility: Panel data evidence,” North American Journal of Economics and Finance 41, 57-69.
Dixon, H., Griffiths, D., Lawson, L. 2004. “Exploring tradable and non-tradable inflation in consumer prices,” New Zealand Discussion Paper.
Johnson, N. 2017. “Tradable and non-tradable inflation indexes: replicating New Zealand’s tradable indexes with BLS CPI data,” Monthly Labor Review (14), May. U.S. Bureau of Labor Statistics.
Saygılı, H. 2019. “Sectoral inflationary dynamics: cross-country evidence on the open-economy New Keynesian Phillips Curve,” Review of World Economics 156(1), 75-101.
Saygılı, H. 2021. “How do real and monetary integrations affect inflation dynamics in Turkey?” TCMB WP 21/21, August.
See for instance Auer and Mehrotra (2014), Auer, et al. (2017a), Auer, et al. (2017b) and Saygılı (2019).
https://www.wto.org/english/res_e/statis_e/miwi_e/all_Profiles_e.pdf