menu
close

Author(s):

Christian Beer | Oesterreichische Nationalbank
Robert Ferstl | Oesterreichische Nationalbank
Bernhard Graf | Oesterreichische Nationalbank
Fabio Rumler | Oesterreichische Nationalbank

Keywords:

price setting , price rigidity , webscraping , online prices , inflation

JEL Codes:

E31 , C82 , D22

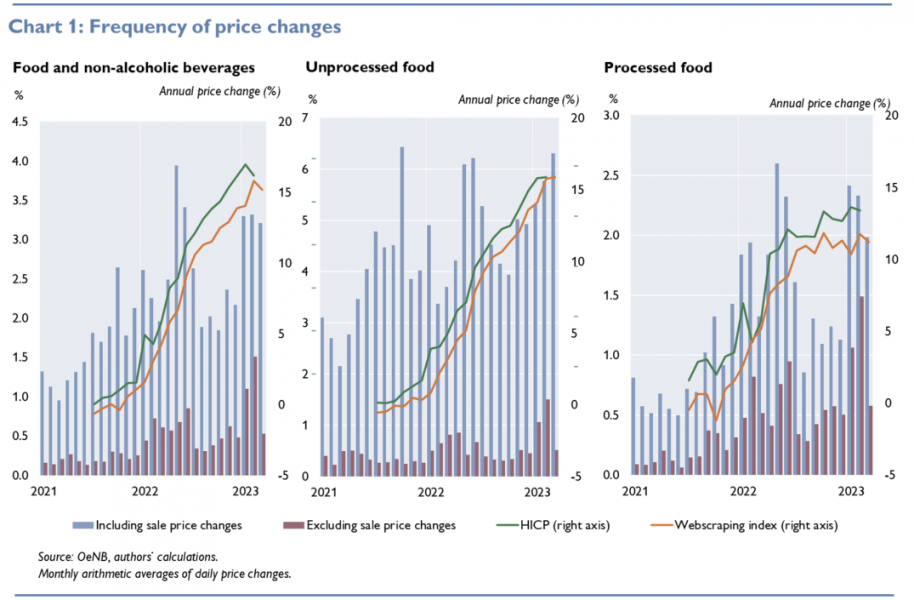
Price rigidities in an economy are crucial for the speed and extent of the transmission of monetary policy impulses and other macroeconomic shocks to the real economy. Current inflation developments also raise the question of whether the price-setting behavior of firms has changed fundamentally during periods of high inflation. An analysis based on Austrian online retail price data suggests that price changes were more frequent in the food sector during the period of high inflation (starting in January 2022) than before, but the average size of price changes remained broadly constant. The prices of food and non-alcoholic beverages were changed up to three times more often during the period of high inflation. By contrast, the average size of price changes remained constant at around 10 %. The current high food inflation is therefore less due to stronger price increases than to more frequent price increases. This suggests that the frequency of price changes is no longer broadly constant, as in previous periods of comparatively moderate and stable inflation, but is more influenced by current economic developments in the presence of a large shock.

The speed and extent with which monetary policy impulses and other macroeconomic shocks affect the real economy crucially depend on the degree of price rigidity in an economy. The faster and the more direct cost increases are passed on in the face of macroeconomic shocks, the less quantities will adjust in response to them. The current inflation surge also raises the question of whether firms’ price-setting behaviour has changed during periods of high inflation. This policy brief therefore presents the frequency and magnitude of price changes as important indicators of food price-setting behaviour over time.
The database is based on prices and other product information downloaded by the Oesterreichische Nationalbank (OeNB) from the online shop websites of Austrian supermarkets (webscraping data). Depending on the availability of reliable price data from online shops, we limit our analysis to the prices of food and beverages and consider the period from 1 January 2021 to 11 March 2023. In the first year of this period, inflation rates were still relatively low. In the second part of this period, by contrast, high inflation rates were recorded, which permits a comparison of the high inflation period with a period of moderate inflation. Below, we show results for total food (food and non-alcoholic beverages), and separately for unprocessed food (meat, fish, fruit, vegetables) and processed food excluding alcohol and tobacco (e.g. bread and cereals, milk, cheese, oils and fats, sugar, honey, coffee, tea, non-alcoholic beverages).1 In total, we have around 6 million time series observations, with a total of 12,297 different products (unprocessed food: 1,631 Products, processed food: 8,667 products).
Supermarkets are usually very flexible in their pricing and often introduce temporary promotions and sales at reduced prices. Depending on the point of view, the reduced prices due to temporary promotions and sales can be interpreted as an important element of price flexibility or as only short-term price movements without any further relevance for the transmission of price shocks in the medium to long term. In our analysis of price changes, we focus on changes in regular prices and exclude price changes due to temporary promotions and sales, except when presenting the frequency of price changes.2

Frequency of price changes in the current period of high inflation three times higher than at the beginning of 2021

Chart 1 shows the monthly averages of the daily frequency of price changes for the groups of products considered3 on the left-hand axis and corresponding inflation rates calculated from the online data and the respective HICP inflation rates on the right-hand axis. The webscraping data are representative of the HICP and show a high correlation with the HICP inflation rates of the respective product groups. The chart also clearly shows that the frequency of price changes in the period of high inflation was significantly higher than in period of low inflation. Thus, higher inflation was generally associated with an increase in the frequency of price changes, although we also find varying levels of the frequency of price changes within the period of high inflation. Particularly in the second quarter of 2022 and then again in the first three months of the current year, a relatively large share of prices was changed. At the current juncture (early 2023), the frequency of prices changes of food and non-alcoholic beverages was about three times higher than at the beginning of the investigation period (early 2021). Food price inflation rose from 0.5 % in the first quarter of 2021 to over 16 % in February 2023.4 Comparing the frequency of all price changes with the frequency of regular price changes, we find a very similar pattern over time. However, for unprocessed food the frequency of price changes without temporary promotions and sales is significantly higher than for processed food, resulting in a correspondingly larger difference between the frequency of price changes with and without temporarily reduced prices.
 width=

Price increases dominate overall price changes during the period of high inflation

Not only the frequency of overall price changes, but also the ratio of price increases to decreases is important for the determination of inflation. As shown in Chart 2, during the period of low inflation, the share of price reductions (of regular prices) was higher than the share of price increases in some of the months under review. In the period of high inflation, by contrast, price increases clearly dominated. Especially during this period, the share of processed food price increases is higher than for unprocessed food in most months. The slightly higher share of price reductions in March 2023 compared with previous months is consistent with the observed slowdown in inflation in Chart 1.5
 width=

Average size of price changes relatively constant

In addition to the frequency and direction of price changes, inflation is determined by the magnitude of price changes. Chart 3 shows the average size of daily price changes for each product group when there has been a price change (separately for price increases and price decreases). The average price reductions in most months were 10 % or more, with no clear trend over time, in contrast to the frequency of price changes. For unprocessed food, this also applies to price increases; for total food and processed food, the majority of the monthly averages of price increases ranges between 6 % and 10 %.
Summing up, retail food prices (excluding reduced prices due to temporary sales and promotions) are adjusted relatively infrequently. On average, for total food and non-alcoholic beverages, prices changed every 85 days when inflation was high, and every 190 days when it was low. However, when prices change, the changes are relatively large. This is in line with the predictions made by theoretical models that include the cost of price adjustment (“menu costs”). Comparing processed and unprocessed food, the data suggest that both price increases and decreases in unprocessed food prices are, on average, somewhat stronger than those of processed food.
 width=

Indication of faster transmission of monetary policy shocks

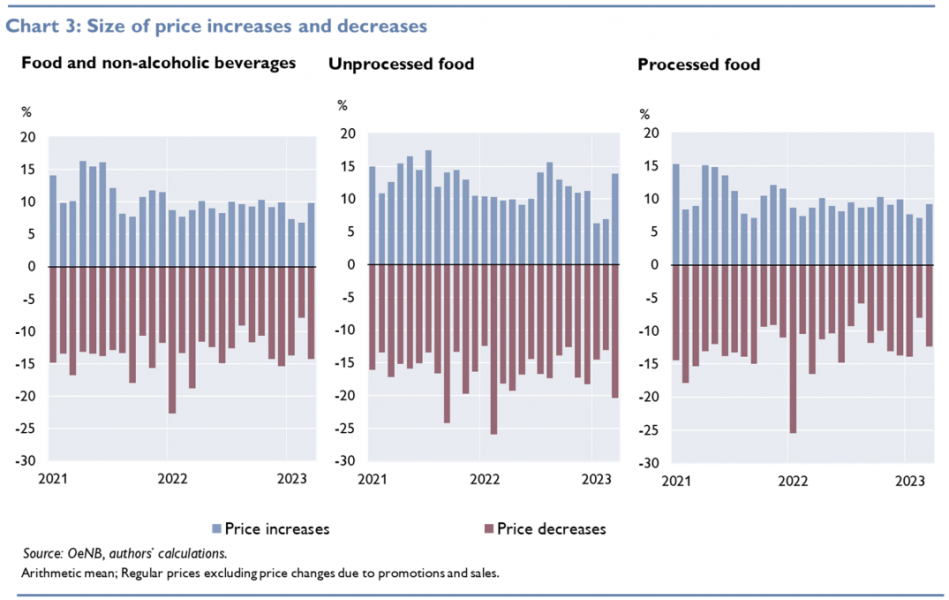
Overall, our data show that price changes were more frequent during the period of high inflation, but that the average size of price changes remained broadly stable over time. The current high food price inflation is therefore mainly the result of an increase in the frequency of price changes rather than of changes in the size of price changes. This suggests that, given the large inflation shock, the frequency of price changes is no longer constant, as in previous periods, but varies with the state of the economy. In other words, state-dependent price setting is likely to have replaced time-dependent price setting. For the transmission of monetary policy and other shocks, this means that prices are now reacting more quickly to changes in the economic environment than in the past, thereby transmitting the shocks to the real economy more quickly, but by a smaller amount due to the stronger reaction of prices.

  • 1.

    For detailed definitions, see the following link

  • 2.

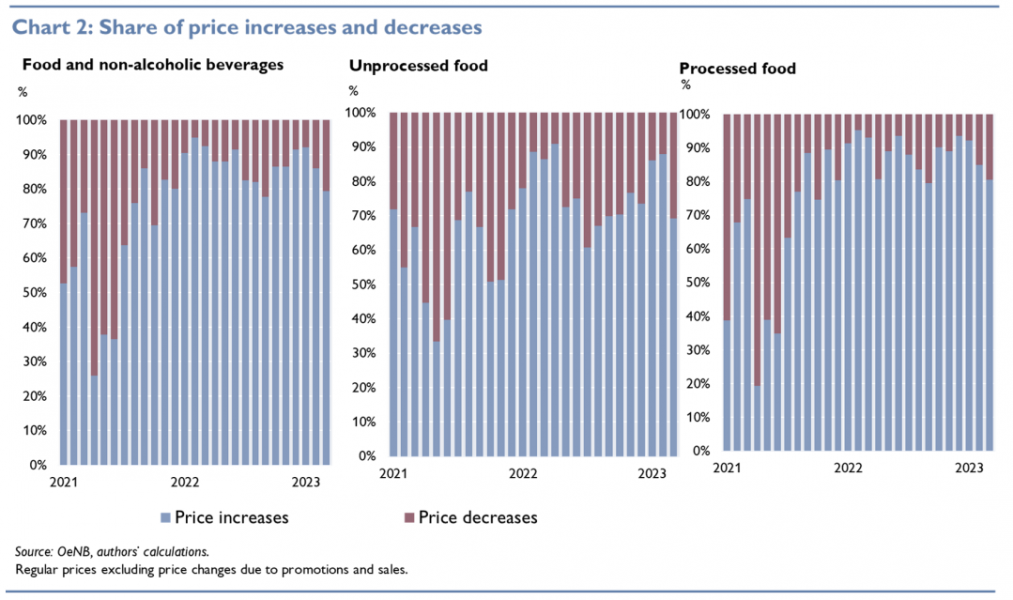
    Temporary promotions and sales are identified with information provided by the companies. Where this information is not available, a separate filter was applied to identify sales and promotions using their typical pricing pattern.

  • 3.

    The frequency of price changes is calculated as the ratio of the sum of observed price changes to the sum of the potential daily price changes. A potential price change can occur when the product price was observed on both, the given and the previous day.

  • 4.

    By and large, the figures with temporarily reduced prices show the same pattern as those without temporarily reduced prices, albeit to varying degrees. During the period of low inflation, the frequency with temporarily reduced prices was on average eight times as high as the frequency without temporarily lower prices, while it was on average four times higher during the period of high inflation.

  • 5.

    However, the figures for March 2023 are based on observations up to March 11th and are therefore only comparable with the other months to a limited extent. 

About the authors

Christian Beer

Christian Beer is an economist in the Business Cycle Analysis Section of Oesterreichische Nationalbank. His recent publications are among other things on price setting in e-commerce, the effects of the low interest rate environment, structural policy in Austria as well as on financial markets. He studied at the Vienna University of Economics and Business, from where he received his doctorate, the University of Vienna, and at the Institute of Advanced Studies (IHS, Vienna) where he completed a postgraduate program in economics.

Robert Ferstl

Robert Ferstl is a Senior Expert in the Monetary Policy Section of Oesterreichische Nationalbank, with over a decade of experience in banking supervision, focusing on liquidity risk and stress testing. His current research focuses on monetary policy transmission and inflation. Robert received both his Master’s and Doctoral degrees in Economics from Vienna University of Economics and Business. In addition to his work at the central bank, he shares his knowledge as an associate lecturer at the University of Regensburg.

Bernhard Graf

Bernhard Graf works as Research Assistant in the Monetary Policy Section of the Oesterreichische Nationalbank. He is pursuing a Doctoral degree in Economics and Social Sciences and holds a Master’s degree in Economics from Vienna University of Economics and Business.

Fabio Rumler

Fabio Rumler works as Senior Principal in the Monetary Policy Section of the Oesterreichische Nationalbank. He is specialized in the fields of inflation and monetary policy where he has published extensively. Additionally, he gives presentations at scientific seminars and conferences and holds a position as lecturer at the Vienna University of Economics and Business. Fabio has graduated from the Institute for Advanced Studies in Vienna and the Vienna University of Economics and Business.

More on these topics

Tags: