This article provides an overview of the general mechanics and relevant policies for the calculation of minimum capital requirements for credit risk. In the following the article focuses on the assessment of capital requirements based on internal models (IRB) as mandated in Article 78 the CRD. This assessment includes a benchmarking exercise and entails tasks for EBA as well as for competent authorities. The methods and key results contained in EBAs report on the results from the 2017 Low defaults portfolios (LDP) exercise are summarised and some, more recently published results of the EBA Report on the results from the 2018 low and high default portfolios exercise are referred to. Lastly a possible amendment of the focus of EBAs benchmarking exercise as regards credit risk is discussed.
The EU has implemented the minimum capital requirements for credit risk set out in the international standard agreed upon by the Basel Committee on Banking Supervision and commonly referred to as Basel II2 in two legal documents:
The objective of the internationally agreed standard is to set out capital requirements, which adequately cover for the risk in a risk–sensitive manner, thus providing a level playing field for banks. For credit risk the Basel II standard and thus the EU-Implementation allows for two basic approaches for the calculation of minimum capital requirements, the so-called standardised approach (SA) and the so-called internal-ratings based approach (IRB). The mechanics for the calculation of capital requirements are however comparable between the two approaches:
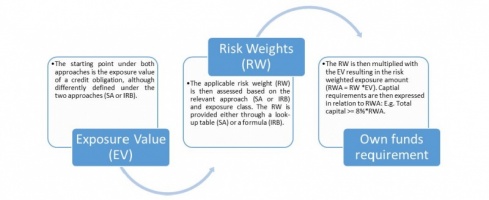
Figure 1. Illustration of mechanics of capital requirements calculation
As an example for the RWA according to the SA, Article 122 of the CRR requires the following risk weights to be taken into account for exposures of corporates:
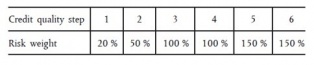
These risk weights depend on the rating provided by a nominated eligible External Credit Agency (ECAI)5. EBA provides for each eligible ECAI a mapping of their relevant rating scales to the credit quality steps set out in the relevant look-up tables for the SA in the CRR.
Under the IRB approach the risk weight for a comparable exposure to a corporate is calculated taking into account the estimation of certain risk parameters (PD, LGD, CF) based on internal models and using the formula set out in Article 153 (resp. 154) of the CRR:
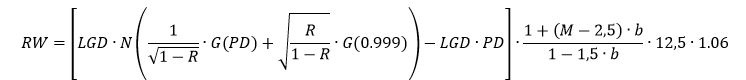
Where PD refers to the own-estimate of probability of default for the according corporate and LGD refers to the own-estimate of loss given default for the exposure under consideration to the according corporate. Additionally
N(x) = the cumulative distribution function for a standard normal random variable (i.e. the probability that a normal random variable with mean zero and variance of one is less than or equal to x)
G(Z) = the inverse cumulative distribution function for a standard normal random variable (i.e. the value x such that N(x) = z)
R = the coefficient of correlation: ![]()
b = the maturity adjustment factor: ![]()
The regulation allows two versions of the IRB. The first approach is commonly referred to as the advanced IRB approach (A-IRB), where banks have received permission by their supervisor to use (in addition to own-estimates of PD) own-estimates of LGD and own-estimates of conversion factors (CF). The latter is a risk parameter that estimates the amount drawn at the time of default for facilities, which involve credit lines.
The second approach is commonly referred to as foundation IRB approach (F-IRB), where own-estimates of PD are used, but LGD and CF are assigned based on according lookup tables set out in EU legislation. For retail exposures, i.e. exposures to natural persons, however, only A-IRB is allowed and own-estimates of LGD and CCF have to be provided in any case if the banks uses the IRB for this exposure class. The use of the IRB approach for the calculation of own funds requirements is subject to a use test phase and a supervisory approval. For these aspects regulation can be found in the CRR and the RTS on assessment methodology6 – the latter is developed by EBA and sets out the requirements in more detail.
In particular, the IRB approach allows the introduction of a more risk sensitive way of measuring capital requirements, which as well encourages institutions to implement sound and sophisticated internal risk management practices. However the downside of this approach is its high degree of flexibility which has paved the ground to concerns on the reliability of minimum capital requirements quantified based on internal models.
These concerns have been expressed in particular with respect to two aspects: The variability of capital requirements and the adequacy of capital requirements stemming from the use of internal models. In particular the first aspect gained public attention as the reduction of “excessive variability in the capital requirements for credit risk” was set out as one of the aims of the reform of the IRB approach finalised in December 20177 and commonly referred to as Basel III finalisation.
The current EU Regulation provides, in Article 78 of the CRD, a requirement for supervisors to monitor the range of RWAs or own funds requirements resulting from the use of the IRB approach. In detail, Article 78 (3) requires competent authorities (CAs) to at least annually assess the quality of internal approaches “paying particular attention to:
(a) those approaches that exhibit significant differences in own fund requirements for the same exposure;
(b) approaches where there is particularly high or low diversity, and also where there is a significant and systematic under- estimation of own funds requirements.
The annual data collection and analysis resulting from the application of Article 78 is referred to as EBA Benchmarking. EBAs role in this context is
The requirement to analyse the results of different internal approaches on the same exposure is however a non-trivial task in practice. In fact EBA is mandated in the same article to develop draft implementing technical standards to specify the benchmarking metrics and portfolios (ITS on Benchmarking) for the above mentioned annual data collection and analysis. The current version of the ITS as well as older versions and the draft version under consultation for the 2020 Benchmarking exercise are published on the EBA website.8
In order to compare different IRB models for the same exposure, as required in the above mentioned Article 78, the IRB portfolios of the relevant institutions are broken down along certain characteristics, thus providing benchmarking portfolios, which are increasing in homogeneity.
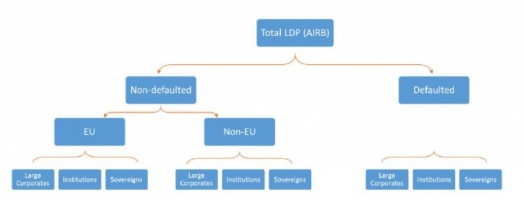
Figure 2. Illustration of breakdown of IRB exposure into benchmarking portfolios
The results presented in [EBAs report on the results from the 2017 Low defaults portfolios (LDP) exercise]9 are based on data reported with respect to the 31.12.2016. Two main metrics are used: the EAD-weighted average RW and global charge (GC). The global charge (GC) provides the information for both, expected loss (EL) and unexpected loss (UL). This is relevant due to the fact that the IRB RWA covers the UL, and the EL is taken into account via adjustment to own funds ultimately resulting in different own funds requirement as well. For IRB exposures the GC is computed as
GC = (12.5 × EL + RWA) ÷ EAD.
To quantify the variability of own funds requirements, next to other metrics, the standard deviation of the indicators (RW and GC) observed at bank level (constrained to the IRB Portfolio) is computed. However as pointed out in the executive summary of the report “given the limitations and assumptions of the different indicators, and data quality issues, the main findings and conclusions should be interpreted with caution.“
The report on the 2017 LDP exercise confirmed that average RW and GC had slightly increased compared to the first LDP exercise conducted by EBA in 2015.10 The graph below shows the EAD-weighted average RW at 28% and weighted average GC at 36%.
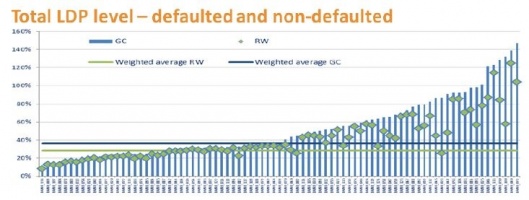
Figure 3. 2017 LDP Report Page 17
The dispersion of average RW and GC among banks however remained high, with RW ranging from 8% to 125% and GC ranging from 8% to 147%. A major share of this dispersion can already be explained by differences in key characteristics among the IRB portfolios of those banks, reflecting ultimately the different economic substance of the compared portfolios. The following graph illustrates that, based on the data collected in the Benchmarking exercise, 61% of GC variability can be explained mainly by the different share of the defaulted assets, and by the geographical and portfolio mix effect.11
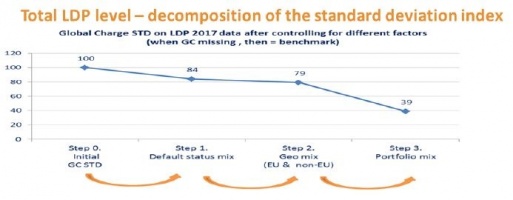
Figure 4. Illustration of breakdown of GC variability
Another major analysis of the report is the common counterparty analysis, where for a set of counterparties that are obligors of several participating banks and that fall within their IRB portfolio, the IRB risk parameters as well as the resulting RWs were compared. However even though the counterparties are the same, the real exposures might differ as a result of different credit risk mitigation (CRM) techniques and/or collateralisation schemes.
For this analysis the deviation from a benchmark is computed for each bank and each of its obligors and the findings for each participating bank are summarised computing the median of the deviations for all obligors reported by a given institution. As pointed out in the report, the benchmarks used for this purpose referred the groups of participating banks that apply the same regulatory approach to a specific common counterparty.
To isolate the impact of each IRB parameter, the RWs are recalculated at obligor level, using various combinations of actual and benchmark parameters. By replacing a given institution’s risk parameter with a benchmark parameter (median risk parameter), it is possible to disentangle the different effects of each parameter with respect to the RW variability. The following graph illustrates the deviations from the benchmark in terms of RW (Dev 1) or with respect to a certain parameter (e.g. PD) by comparing the originally assigned RW to the RW that would be assigned if the risk parameter under consideration would be replaced with the benchmark.
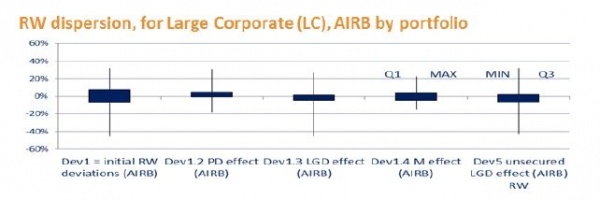
Figure 5. Illustration of RW dispersion, 2017 LDP Report page 28
As an example this analysis for the large corporates portfolios indicates that the negative deviations (i.e. those lower than the benchmark) are driven by the LGD, whereas the positive deviations appear to be driven by the PD. The report provides this analysis in section 6 and covers as well institutions IRB portfolios on institutions and sovereigns.
It should be noted that the 2017 LDP report goes into further detail, should the reader be interested in a more compressive analysis. Moreover, recently the results of the 2018 HDP and LDP report have been published and can be found on the EBAs website.
It may however be time for EBA to review the objective of and the metrics used in the Benchmarking exercise. As set out in the 2017 LDP report the objective of the report are
In the light of the recent reforms at the Basel table as well as with respect to EBAs regulatory review of the IRB approach the exercise might gain more attention by shifting its focus to the assessment of the implementation and impact of these reforms – in addition to maintaining its existing purpose of providing a supervisory tools to national authorities, which are tasked with assessing the IRB implementation across banks. However, it is to be explored whether such analysis could be done on the same data collected as necessary to serve the assessment of internal approaches currently set out in Article 78 and which should, as said before, remain an objective of the Benchmarking Exercise as well.
It remains an open question to what extent the observed variability stems from non-risk-based differences, and in particular from different implementation of the IRB Approach across institutions and jurisdictions. Although the previous reports explored this issue by explaining a certain share of the observed variability though risk based differences, it remains unclear to what extent e.g. collateralization or unfunded credit protection contribute to the risk based differences. On the other hand limited analysis explores whether commonly known different practices in implementing the IRB approach lead to different RW or risk parameters. One example for such analysis can be found in section 3.3 of the 2018 report on LDP and HDP portfolios12, where different practices as regards the recognition of guarantees and derivatives have been analyzed and no evidence was found that these different practices drive variability of own funds requirements.
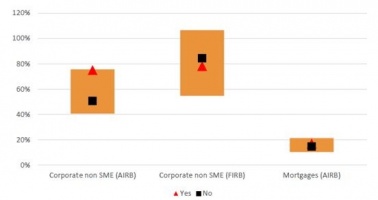
Figure 6. Impact of different use of guarantees on the benchmarks, Section 3.3. of
the 2018 Report on LDP and HDP portfolios
As described above the EBA Benchmarking has for the 2017 LDP and 2018 (HDP and LDP) exercise relied on the several benchmarking metrics which mostly compared a risk parameter under consideration of an individual bank to the median of the according risk parameter (estimated by a peer group of banks) on a comparable portfolio of exposures.
The advantage of this approach is clearly that it allows a comparison across banks. One drawback of this approach is that it reveals over-and underestimation only with respect to a peer group using the IRB-approach equally and as such the analysis provides limited insight on the adequacy of capital requirements stemming from the use of the IRB approach in general.
Thus to explore these aspects and in particular to prove or disproof whether excessive variability in capital requirements based on the IRB approach is limited by the revised Basel III standard, benchmarking metrics independent of the use of the IRB approach are needed. One benchmarking metric that could be explored in this context could be capital requirements based on the SA for a homogenous group of exposures for which the IRB is applied. Although less risk sensitive some variability can be expected e.g. due to different usage of the ECAI-ratings and credit risk mitigation (CRM).
Any views expressed are solely those of the author and so cannot be taken to represent those of the European Banking Authority (EBA) or to state EBA policy. Neither the EBA nor any person acting on its behalf may be held responsible for the use which may be made of the information contained in this publication, or for any errors which, despite careful preparation and checking, may appear.
The article was first published in Bank en Financiewezen Digitaal – Revue bancaire et financière numérique – 2019/1.
Originally published in 2004, revised version published in 2011 referred to as Basel III which however only provided minor changes to the minimum capital requirements for credit risk.
https://eur-lex.europa.eu/legal-content/EN/TXT/?uri=celex%3A32013L0036
https://eur-lex.europa.eu/legal-content/EN/TXT/?uri=celex%3A32013R0575
Article 4(98) of the CRR: “External credit assessment institution’ or ‘ECAI’ means a credit rating agency that is registered or certified in accordance with Regulation (EC) No 1060/2009 of the European Parliament and of the Council of 16 September 2009 on credit rating agencies (1) or a central bank issuing credit ratings which are exempt from the application of Regulation (EC) No 1060/2009.”
“The EAD-weighted average RW was 28% (versus 26% in the last LDP exercise), ranging from 8% to 125%. The weighted average GC was 36% (33% in the last LDP exercise) ranging from 8% to 147%.“
The underlying methodology and results can be found p. 18-22 of the 2017 LDP Report.