
The views here expressed are those of the authors and do not necessarily reflect those of Banca d’Italia. This policy brief is based on “In the thick of it: an interim assessment of monetary policy transmission to credit conditions”, Occasional Paper (Questioni di economia e finanza) No. 810, Banca d’Italia.
Assessing the transmission of monetary policy during a tightening phase crucially requires accurately modelling the underlying forces driving the economy, which may vary from cycle to cycle. The Granger and Yeon thick modelling approach (2004) effectively minimizes the risk of model misspecification by estimating a range of reasonable forecasting models. When predicting the cost of credit to euro-area non-financial corporations during the unprecedented 2022-23 ECB’s monetary policy tightening, this method yields three policy-relevant findings. The wide range of the resulting forecasts highlights the uncertainty surrounding the evolution of lending rates. Including borrower riskiness significantly improves the accuracy of the forecasts and emerges as a key factor in explaining the dynamics of lending rates during the current tightening of the ECB’s monetary policy. A significant degree of credit supply restriction is still in the pipeline.
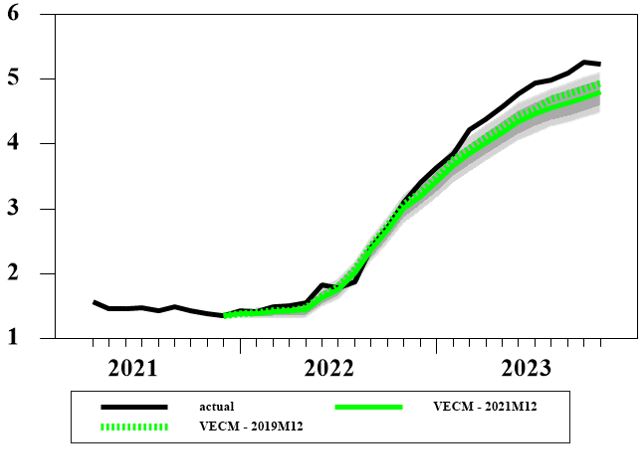
Accurately forecasting the evolution of financing conditions during a tightening cycle is of paramount importance to monitor the transmission of monetary policy impulses to the real economy and to promptly adjust their intensity over time, if needed. In order to have a baseline forecast for the cost of credit to non-financial corporations (NFCs), central banks often use simple but sensible workhorse models that posit a co-integration relation between reference rates (e.g., the 3-month Euribor) and loan rates, that is a simple two-variable Vector Error Correction Model (VECM). Notwithstanding the overall orderly transmission from reference rates, such baseline models have underperformed during the current ECB’s monetary tightening. First, a simple counterfactual in which we estimate the VECM until December 2021 and then we feed it with the realized path of the 3-month Euribor until November 2023 shows a significant under-prediction of the evolution of the composite cost of borrowing to NFCs in the euro area (EA; Figure 1).1
Figure 1: Counterfactual Path of Lending Rates To NFCs According To Baseline Models

Source: authors’ computations over ECB and Refinitiv data at monthly frequency.
Notes: The black line is the actual evolution of the composite cost of borrowing to NFCs. The green solid (dotted) line is the forecast obtained from the VECM estimated until 2021M12 (2019M12) by conditioning on the actual path of the 3-month Euribor over the period 2022M1-2023M11 (which is the last available observation at the time of writing). The dark (light) grey area represents the 68% (90%) credibility interval of the VECM conditional forecast.
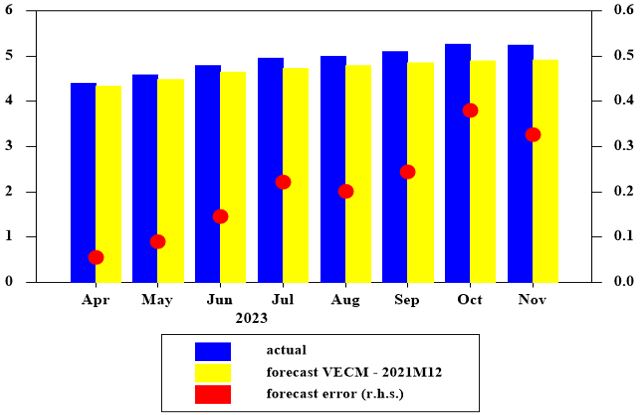
Second, when relying on this baseline model to perform an actual out of sample forecasting exercise – using the last available figure of March 2023 released on May 5 and the 3-month Euribor at May 23, the same information set available for the Eurosystem Staff June Macroeconomic Projections– one would observe large forecast errors from April to November 2023 (Figure 2). In particular, with the June release the composite indicator was already over 15 basis points higher than what foreseen by the VECM, with this figure rising to around 35 basis points in November.
So why workhorse models did not work this time? Taken together, the results above suggest that further variables beyond reference rates need to be considered to correctly predict the evolution of cost of credit to NFCs, especially in a period of steep increases in policy rates.
In a recent paper (Bottero and Conti, 2023) we provide empirical evidence on the role played by borrower riskiness in the transmission of the ECB’s monetary policy to bank interest rates during the current tightening cycle. In order to do so, we narrow the focus on the short-term projected path of lending rates to non-financial corporations (NFCs) in the EA and rely on a thick modelling approach (Granger and Yeon, 2004), which is based on ample set of potential drivers.
Figure 2: Forecast Errors on Lending Rates To NFCs According To Baseline Models

Source: authors’ computations over ECB and Refinitiv data at monthly frequency.
Notes: Blue bars denote the actual evolution of the composite cost of borrowing to NFCs from April to November 2023. Yellow bars denote the forecast of the composite cost of borrowing to NFCs from April to November 2023, based on the VECM estimated until March 2023 (2023M3) and conditioning on the 3-month Euribor available on May 23, before the actual April release on the composite cost of borrowing.2 Red dots on the right hand side represent the forecast errors defined as actual minus forecast.
The thick modelling approach by Granger and Yeon (2004) considers an ample set of drivers for a variable of interest, allowing to tackle the uncertainty about the proper specification of macroeconomic equations. Furthermore, it has already proven useful, for example, in addressing the appropriateness of the Phillips curve as a tool to predict core inflation dynamics (Ciccarelli and Osbat, 2017; Conti, 2021). Here we conjecture that the cost of credit to euro-area NFCs is mainly driven by (current and lagged) short and long-term reference market rates and economic activity (as in Albertazzi et al. 2014).3 However, we also include a fourth driver – risk proxies – such as financial stress or supply factors taken from the Euro Area Bank Lending Survey (BLS; see below). For each of these four drivers, we consider at least three possible sensible indicators, for a total of 81 models.4
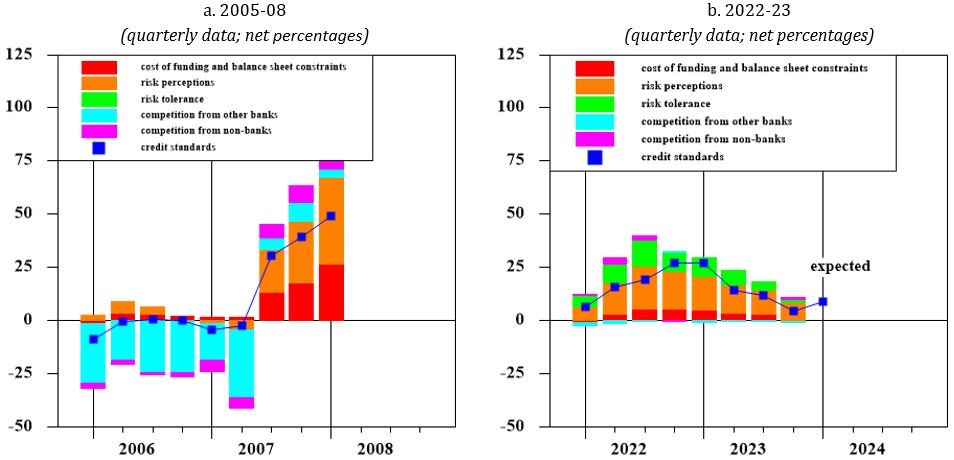
The reason behind the inclusion of risk proxies is the remarkable difference emerging from the comparison of BLS credit standards during the 2005-08 and 2022-23 tightening cycles. While in 2005-08 credit standards were basically flat in the first six quarters after the first policy hike, in 2022Q1 they rose immediately and continued to surge steadily. Importantly, in the current cycle the tightening is driven predominantly by risk considerations (Figure 3b; orange and green bars) while risk perception exerted only a minor role in 2005-08 (Figure 3a; orange bars), starting to increase only in 2007Q3, at the onset of the Global Financial Crisis.
Figure 3: BLS Credit Standards To NFCs and Contributing Factors In Different Tightening Cycles

Source: ECB data at quarterly frequency.
Notes: The two panels plot credit standards applied to NFCs and contributing factors since 2006Q1 (panel a) and since 2022Q1 (panel b). Credit standards are defined as the difference between the share of banks reporting a tightening minus the share of banks reporting an easing. Thus, positive values denote a tightening, while negative values denote an easing. In panel b, “expected” refers to banks expectations for 2024Q1 (i.e., their expected value of overall credit standards). The net percentages for responses to questions related to contributing factors are defined as the difference between the percentage of banks reporting that the given factor contributed to a tightening and the percentage reporting that it contributed to an easing. Notice that the “risk tolerance” factor was included in the survey only at a later stage (since 2015Q1).
For further details, see https://www.ecb.europa.eu/stats/ecb_surveys/bank_lending_survey/html/index.en.html.
Information from the latest BLS at the time of writing, conducted between December 2023 and January 2024, confirms a further tightening also in 2023Q4, and, importantly, expectations of an additional one for 2024Q1 as well. Supply factors from BLS are known to lead lending dynamics to NFCs by several quarters, as it takes time for intermediaries’ updated lending policies to affect the actual credit dynamics (see, for example, Huennekes and Köhler-Ulbrich, 2022). The leading content of the BLS with respect to lending rates is less explored, but in principle equally valid. Indeed, BLS data are not subject to revisions, an important advantage compared to alternative risk proxies such as, for example, default rates and loan-loss provisions. Moreover, BLS data are more promptly available with respect to banks’ income statement indicators. We therefore put special attention to the performance of the “risk perception” indicator in our analysis.
Equipped with the thick modelling framework, we run two pure out-of-sample exercises. In the first one, we estimate our equations from 2003Q1 to 2023Q1, which is the last available observation for lending rates before the Eurosystem staff June Macroeconomic Projections and coincides with the beginning of the debate on the residual degree of tightening still in the pipeline (Lane, 2023). In the second one, we extend the estimation until 2023Q3 – the last available quarter for most of the data before the Eurosystem Staff December Macroeconomic Projections – to gain some perspective on lending rates dynamics after the peak of policy rates.5
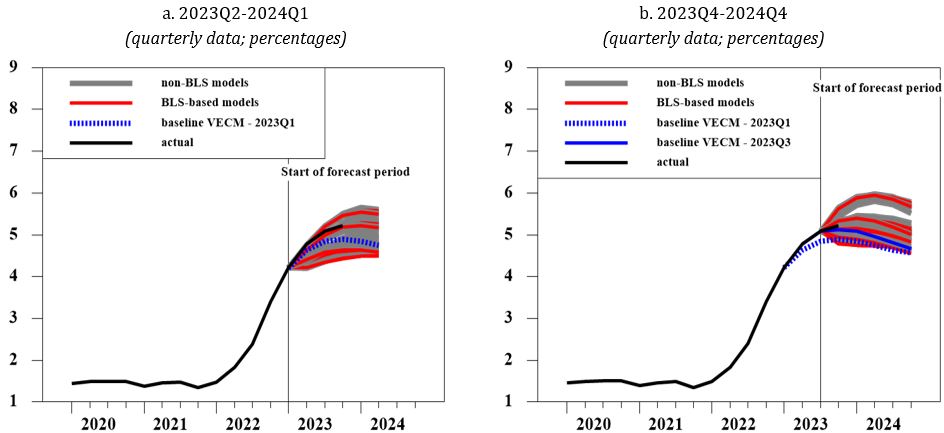
The results of the first exercise are shown in Figure 4a. First, the range of forecasts (grey and red lines) is wide, pointing to a high degree of model uncertainty. Second, the baseline VECM projection (blue dashed line) lies in the lower part of this range, suggesting that models based solely on a common trend between market rates and lending rates provide a benign view of the short-term evolution of the cost of credit in the EA. Third, models including risk proxies taken from the BLS skew the projected loan rate path significantly upwards. In the current circumstances, this finding is particularly relevant, as borrower risk may remain high in the incoming months as economic activity reacts to the unprecedented rapid pace of policy rates hikes as well as to other global and geopolitical shocks (De Vette et al., 2023). In fact, the thick-modelling projections of the composite cost of borrowing to NFCs based on BLS risk perception (red lines) confirm that the balance of risks surrounding the baseline was strongly tilted to the upside already in 2023Q1. With respect to the baseline, the average of the BLS forecast models shows a further rise of EA NFCs lending rates by about 20 bps by 2024Q1, while according to the upper bound of the forecast range this additional increase would amount to 80 bps.
Finally, the actual evolution of lending rates to NFCs validates our approach, as it is significantly higher than the baseline VECM-based projection, and closely tracks a couple of models which include risk perception.6
Figure 4: Thick-modelling forecasts of lending rates to NFCs

Source: authors’ computations over ECB and Refinitiv data at quarterly frequency.
Notes: Composite cost of borrowing to NFCs. Panel a: last observation included in the estimation sample is 2023Q1 (thin vertical line). Panel b: last observation included in the estimation sample is 2023Q3 (thin vertical line). Actual data for 2023Q4 refer to November. The blue straight (dashed) line plots the baseline forecast obtained using the VECM estimated until 2023Q3 (2023Q1). The grey lines plot the forecasts obtained from models including indicators of economic activity, short-term and long-term market rates and tightening in financing conditions other than BLS. The red lines plot the range of forecast computed replacing the “alternative indicators” with the BLS risk-perception indicator as measure of tightening in financing conditions.
The results of our second exercise are shown in Figure 4b. Overall, they convey the same message of Figure 4a but they add two insights. First, the inclusion of further data to the VECM estimation does not solve the issue of under prediction, as the baseline forecast (blue straight line) continues to lie below actual data. Second, exploiting the findings of the first exercise we select the best performing models, i.e. those which deliver a low RMSE of the forecast. According to this metrics, lending rates to NFCs would lie in a range between 5.2 and 5.8% in 2024Q1 and between 4.8 and 5.4% in 2024Q4, pointing to significant effects of the monetary tightening still in the pipeline via credit supply. The latter could exert a delayed and sizable impact on economic activity and prices (Altavilla et al., 2019; Conti et al., 2023), especially in a context of diminishing firm liquidity.
The wide range of loan rates to NFCs’ forecasts obtained using the thick modelling approach (Granger and Yeon, 2004) points to high model uncertainty, therefore disciplining a formal way of quantifying the balance of risks.
In the current tightening cycle, borrowers’ riskiness is a key factor shaping the evolution of lending rates to euro-area NFCs, possibly reflecting the unprecedented intensity of the hikes.
As risk builds up slowly and may dissipate also sluggishly, the findings highlight a significant degree of credit supply tightening that is the pipeline. This may potentially delay the impact of a future monetary policy easing.
Albertazzi, U., T. Ropele, G. Sene and F. M. Signoretti, (2014). “The impact of the sovereign debt crisis on the activity of Italian banks,” Journal of Banking & Finance, vol. 46(C), pp. 387-402.
Altavilla, C., M. Darracq Pariès and G. Nicoletti, (2019). “Loan supply, credit markets and the euro area financial crisis”, Journal of Banking & Finance, vol. 109(C).
Bottero, M. and A. M. Conti, (2023). “In the thick of it: an interim assessment of monetary policy transmission to credit conditions”, Banca d’Italia, Occasional Paper 810.
Ciccarelli, M. and C. Osbat, (2017). “Low inflation in the euro area: Causes and consequences”, Occasional Paper Series 181, European Central Bank.
Conti, A. M., (2021). “Resurrecting the Phillips Curve in Low-Inflation Times”, Economic Modelling, 96(C), pp. 172-195.
Conti, A.M., A. Nobili and F. M. Signoretti (2023). “Bank capital requirement shocks: A narrative perspective”, European Economic Review, vol. 151(C).
De Vette, N., S. Fahr, S., P. Serrano Ascandoni and P. Welz, (2023). “Corporate vulnerabilities and the risks of lower growth and higher rates”, in European Central Bank Financial Stability Report, May.
Granger, C. W. J. and Y. Jeon, (2004), “Thick modeling”, Economic Modelling (21), 2, pp. 323-343.
Huennekes, F. and P. Köhler-Ulbrich, (2022). “What information does the euro area bank lending survey provide on future loan developments?”, in European Central Bank Economic Bulletin 8/2022.
Lane, P., (2023). “The euro area hiking cycle: an interim assessment”, Dow Lecture at the National Institute of Economic and Social Research, London, 16 February.
Estimating the VECM until December 2019 in order to drop the observations most affected by the Covid-19 pandemic results in an almost identical under prediction of lending rates to NFCs. Moreover, similar findings are delivered by a 3-variable VECM which also includes the 10-year IRS to capture the increase in long-term market rates driven by the ECB’s announcement about discontinuing net asset purchases under the Pandemic Emergency Purchase Programme (PEPP) at the end of March 2022.
Using the 3-month Euribor available at the end of September, after the unexpected hike by the ECB would not significantly alter the picture neither qualitatively neither quantitatively. Moreover, feeding the model with data until September 2023 would also result in underestimating lending rates in October and November, although to a lesser extent (around 15 basis points).
We also include some intervention dummies which take into account the Global Financial Crisis, the Sovereign Debt Crisis and the Covid-19 pandemics as well.
For more details on the list of indicators and the description of the empirical framework see Bottero and Conti (2023).
Notice that the first exercise hinges upon the same forecasting setting considered for the VECM and resulting in the forecast errors shown in Figure 2. For each exercise, we use the correspondent information set available for financial and macroeconomic variables, that is assumptions and scenarios available in the third week of May 2023 and in the third week of November 2023, respectively. We then compute 81 conditional forecasts of loan rates to NFCs until 2024Q1, which is the terminal rate horizon, and 2024Q4.
Other exercises on the reliability of BLS-based models in correctly anticipating lending rates to NFCs are available in Bottero and Conti (2023).