
Disclaimer: This policy brief should not be reported as representing the views of European Commission, the European Central Bank (ECB) or the Eurosystem. The views expressed are those of the authors. This policy brief is based on ECB OCCASIONAL PAPER No. 330.
Acknowledgments: We would like to thank the ESCB Working Group on Public Finance and its Chairperson, John Caruana, for comments and support. We are also deeply indebted to Salvador Barrios (European Commission, Joint Research Centre) for an extensive review of this work, his advice and guidance. Comments from Philipp Rother and Diego Rodriguez Palenzuela are also gratefully acknowledged. Special thanks go to Jan Kuckuck (Deutsche Bundesbank) and Niamh Dunne (Banque de France) for providing their expertise on the German and French fiscal measures, and to Silvia Navarro Berdeal (European Commission Joint Research Centre) for her help with the French updates of the EUROMOD tax and benefit systems for 2022.
Following the post-pandemic inflation surge, governments in the euro area adopted a large array of fiscal measures to cushion its impact on households and firms, amounting to 2% of GDP in 2022. To guide effective policy interventions, it is crucial to understand how the sudden and strong increase in prices, as well as the fiscal measures implemented in response to it, affected families differently depending on their income. Using a comprehensive microsimulation approach, this policy brief uncovers both the distributional impact of high inflation and the impact of the government measures aimed at supporting households and containing prices. Our analysis confirms that lower-income households were more severely affected by the 2022 inflation surge than high-income households, although fiscal measures significantly reduced the inflation gap. However, most fiscal measures were untargeted, implying a high fiscal cost.
In the aftermath of the pandemic crisis, a sudden and unexpected acceleration of prices, in particular of food and energy goods, hit the world economy. In the euro area, inflation rose from 2.6% in 2021 to 8.4% in 2022. It is well known that high inflation has a detrimental impact on the purchasing power and welfare with lower-income households being disproportionately affected. That is because they spend a higher share of their income on energy-intensive and other essential goods. Besides, poorer households are often credit-constrained, and higher inflation immediately threatens their current consumption (Charalampakis et al., 2022).
As a response to this surge in prices since 2021, governments adopted a large array of fiscal measures to cushion the impact of the inflationary shock on households and firms. Often, these measures explicitly aimed to limit an increase in income inequality. In the euro area, discretionary fiscal measures are estimated to have been close to 2% of gross domestic product (GDP) in 2022 alone.1 Around half of the government measures were aimed at supporting incomes (“income measures”), while the other half were aimed at containing the increase of prices (“price measures”).
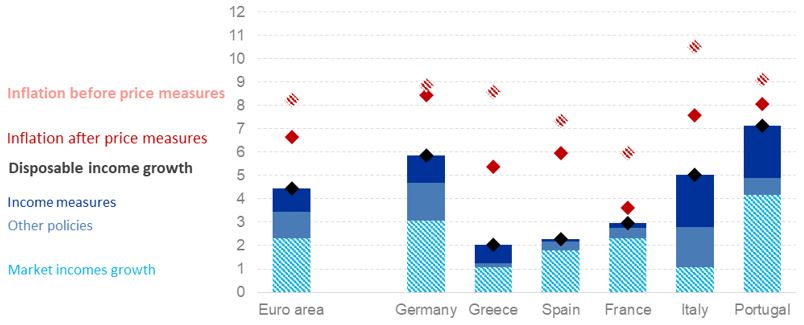
We present an analysis of the impact of the inflationary shock and the fiscal policy response on the distribution of income and welfare for households in the euro area. The analysis considers the four largest euro area countries – Germany, Spain, France, and Italy – as well as Portugal and Greece. These six countries covered about 80% of the population of the euro area and more than three-quarters of the euro area GDP in 2022. Using EUROMOD and its Indirect Tax Tool (ITT)2 extension, we can simulate the impact of inflation across the household income distribution and analyse the counteracting effect of inflation compensation measures (ICMs) introduced by governments on household income and welfare in a ceteris paribus context (i.e. in the absence of behaviour effects). Our simulations show that average consumer inflation in the euro area in 2022 would have been 1.6 percentage points higher without the government price measures. At the same time, government income support measures to compensate for high consumer price inflation contributed 1 percentage point to this household income growth. Taken together, fiscal measures on the income and price side compensated households for about one-third of their welfare loss on average. After considering all inflation compensation measures, other income measures unrelated to the inflation surge, and changes in market incomes, a difference of two percent between consumer inflation and the increase in disposable income remains.
Figure 1: Impacts on equivalised disposable income and consumer inflation in the euro area and euro area countries (in percentage, 2021-2022)

Source: Own calculations based on EUROMOD and ITT simulations, using EU-SILC and HBS data.
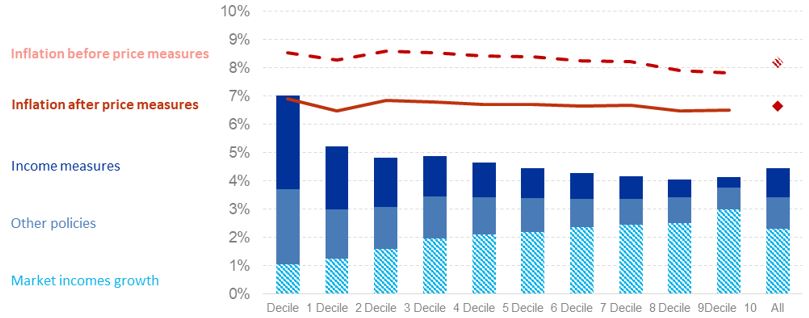
We find that inflation and government measures had a differential impact across the income distribution (Figure 2). First, a comparison with the estimated counterfactual inflation rates (i.e. inflation rates in the absence of price measures) reveals that the inflation rate differential between the richest and poorest households would have amounted to 0.7 percentage points, due to differences in consumption composition. The government measures implemented on the price side reduced this inflation gap by half.
Figure 2: Impacts on equivalised disposable income and consumer inflation in the euro area by income (in percentage, 2021-2022)

Source: Own calculations based on EUROMOD and ITT simulations, using EU-SILC and HBS data.
Notes: This chart shows the simulation results for the euro area aggregate, separately depicting the growth in nominal disposable income and prices by income decile. Changes in prices and incomes are presented as a proportion of their own bases. Accordingly, the change in price is related to the price level and can be interpreted as “consumer inflation”. The bars in the chart show the various components driving the change in nominal disposable income by decile, with the top part of the bar, dark blue showing the impact of income measures.
Second, looking at the nominal income growth distribution in 2022, income measures had a strong inequality-reducing effect, raising incomes by 3.3% for the lowest decile compared to only 0.4% in the richest decile. Other income measures unrelated to inflation also benefited lower-income households more. Richer households, on the other hand, benefited mainly from growth in salaries, wages, and pensions. Summing up these effects, the variation in real disposable income is progressive, with the richest households suffering the largest erosion of the purchasing power of their income.
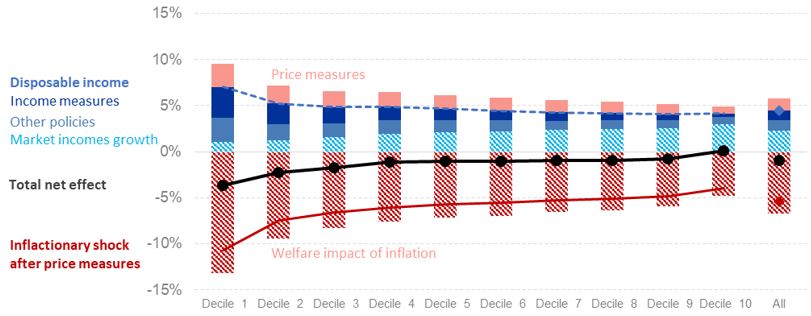
However, as we turn to the effect on welfare, the picture is somewhat different. The welfare perspective takes into account differences in the propensity to consume, as changes in expenditures due to the rise in prices are now measured in terms of the household’s disposable income. Lower-income households must spend much larger shares of their income to maintain their consumption when an inflation shock hits. This can be observed in Figure 3, showing the effects of inflation, income growth, and government policies on households’ welfare across income deciles. Negative bars show the increase in household expenditure as a share of household disposable income before considering compensating government policies on the price side. Positive bars in blue show changes in income as in Figure 2. Positive red bars reflect the price measures. The total net effect (sum of all bars) is negative for all deciles except for the richest 10%.
Figure 3: Price and income effects on households’ welfare, euro area average, by decile (in percentage, 2021-2022)

Source: Own calculations based on EUROMOD and ITT extension simulations, using EU-SILC and HBS data.
Notes: Market outcomes (before any government policies) are shaded. Government policies are shown in solid colours. Contributions to changes in disposable income pertaining to the price (income) side are shown in red (blue) tones. The coloured lines show the total effect on the income (price) side in blue (red). Individuals are ordered across deciles according to their equivalised disposable income in 2021.
Welfare losses are highest at the bottom of the income distribution, resulting in a much larger welfare gap of 8.4 percentage points between the lowest and highest income deciles. This is driven by the large effect of the inflationary shock on low incomes. The welfare gains from price and income measures differ between the richest and poorest deciles by 1.7 and 2.9 percentage points, respectively. In relative terms, the first decile’s gains from income measures are 8.7 times those of the 10th decile, while they are only 3.2 times higher for price measures. Overall, the combination of price and income measures closes about half of the welfare gap.
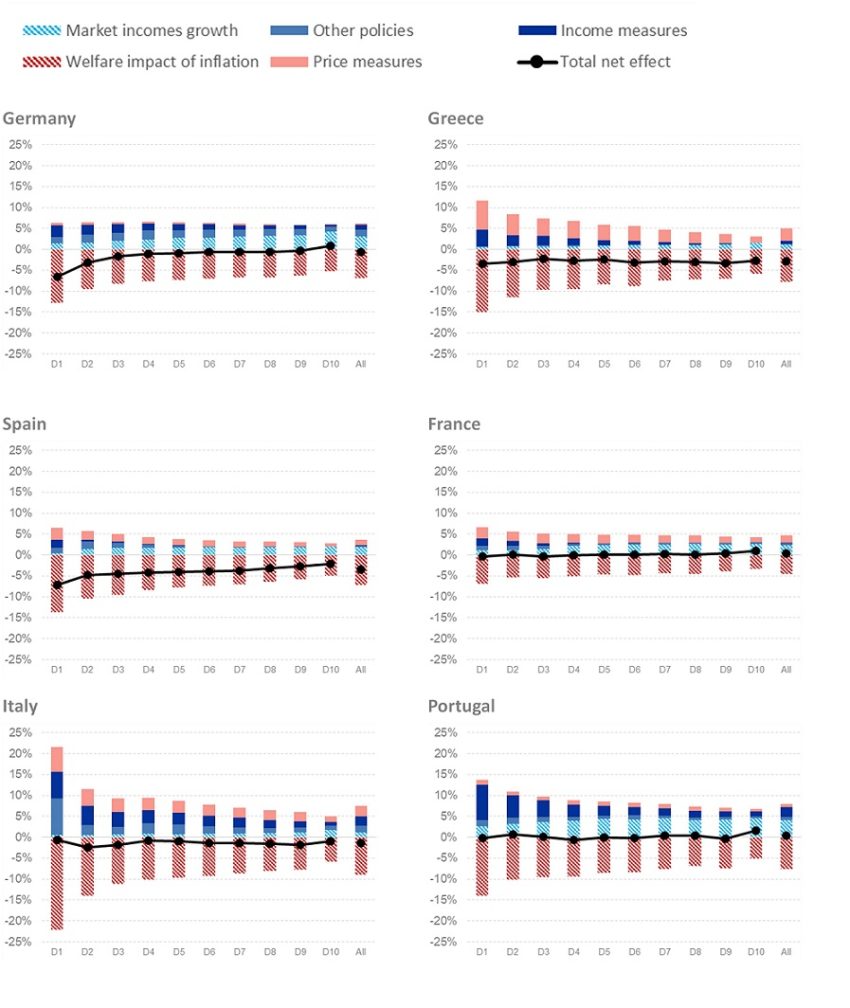
The inflationary shock played out quite differently across countries (Figure 4). Consumer inflation differed significantly across euro area countries in 2022. Model simulations suggest that it was more than twice as high in Germany as in France, for example. Similarly, the distributional impact of the inflation surge in 2022 varied across countries. The welfare loss prior to government measures was four times higher among the poorest than among the richest households in Italy, while it was only two times higher in France. Also, government responses to the inflation surge varied widely across countries. While some countries placed a strong focus on containing price increases (e.g., Greece), others took more measures to support households via transfer payments (e.g., Portugal). Notably, the adverse effect of the inflationary shock on inequality was broadly offset in all countries, with the exceptions of Germany and Spain.
Figure 4: Price and income effects based on households’ welfare in the euro area countries (in percentage, 2021-2022)

Source: Own calculations based on EUROMOD and ITT extension simulations, using EU-SILC and HBS data
Notes: Market outcomes (before any government policies) are shaded. Government policies are shown in solid colours. Contributions to changes in disposable income pertaining to the price (income) side are shown in red (blue) tones. Individuals are ordered across deciles according to their equivalised disposable income in the baseline scenario (2021).
In principle, the aim of inflation-compensating fiscal measures should have been to address the adverse impact of inflation to shield the least well-off, as supported by our finding that high inflation affects this group more severely. After all, the cost of higher consumer prices can only be redistributed and not completely eliminated. Fiscal measures, together with increases in market incomes, were successful in counterbalancing most of the inflationary shock of 2022 by protecting real incomes across the income distribution. However, the fiscal cost of about 2% of GDP was substantial. As already alluded to, income measures are much more targeted and therefore more effective at protecting the incomes of the poorest. We estimate that for the same level of government expenditure, income measures raise the welfare of the first decile by more than 3 times the amount price measures do. Stronger reliance on targeted income measures could have similarly safeguarded the lowest incomes while also resulting in smaller government deficits.
Akoğuz, E.C., Capéau, B., Decoster, A., De Sadeleer, L., Güner, D., Manios, K., Paulus, A. & Vanheukelom, T. (2020). A new indirect tax tool for EUROMOD: Final Report. JRC Project no. JRC/SVQ/2018/B.2/0021/OC.
Bankowski, K., Bouabdallah, O, Checherita-Westphal, C., Freier, M., Jacquinot, P. and Muggenthaler, P. (2023a), “Fiscal policy and high inflation”, European Central Bank Economic Bulletin, Issue 2/2023.
Bańkowski, K., C. Checherita-Westphal, J. Jesionek and P. Muggenthaler (Eds.) (2023b), “The effects of high inflation on public finances in the euro area”, Occasional Paper Series, No 332, ECB.
Charalampakis, E., Fagandini, B., Henkel, F. and Osbat, C. (2022), “The impact of the recent rise in inflation on lower-income households”, European Central Bank Economic Bulletin, Issue 7/2022.
Sutherland, H. & Figari, F. (2013), EUROMOD: the European Union tax-benefit microsimulation model. International Journal of Microsimulation, 6(1), 4-26.
See Bańkowski et al. (2023a) and Bańkowski et al. (2023b) for details on the government response to high inflation and its effect on public finances.
See https://euromod-web.jrc.ec.europa.eu/ and Sutherland and Figari (2013) for information on EUROMOD, as well as Akoğuz et al. (2020) specifically for the ITT.