The views expressed in this Policy Brief are those of the authors and do not necessarily represent the views of the the National Bank of Belgium, Bank of Italy, the Bank of Slovenia, the Bank of Spain, the European Central Bank, or the Eurosystem.
Abstract
We study how disruptions to the supply of foreign critical inputs (FCIs) — that is, inputs sourced mainly from extra-EU countries with highly concentrated supply, advanced technology products, or which are key to the green transition — might affect value added. Using firm-level customs and balance sheet data for Belgium, France, Italy, Slovenia and Spain, our framework allows us to assess how much geoeconomic fragmentation might affect European economies differently. Our baseline calibration suggests that a 50% reduction in imports of FCIs from China and other countries with similar geopolitical orientations would lead to value-added losses of about 2-3% with significant heterogeneity across firms, sectors, regions and countries, driven by the heterogeneous exposure of firms.
Global disruptions, such as the COVID-19 pandemic and the Russian war in Ukraine and, more recently, threats to global integration and multilateralism, have highlighted the euro area’s reliance on foreign input sourcing. The mapping of strategic vulnerabilities and quantification of the impact of supply disruptions to key inputs are central to building resilience.
China is the EU’s top provider of “Foreign Critical Inputs” (FCIs), defined as inputs sourced mostly from outside the EU and which are difficult to substitute (European Commission, 2023; Arjona et al., 2023), high-tech products, and/or items that are vital for the green transition. FCIs represent 17% of extra-EU imports. According to country-level trade data, in 2022 a third of FCIs imported by the EU from extra-EU countries came from China (Figure 1). For the EU, other relevant geopolitically distant suppliers of FCIs are Russia and Hong Kong.
Figure 1. Extra-EU Import Share of FCIs by Country and Partner Alignment
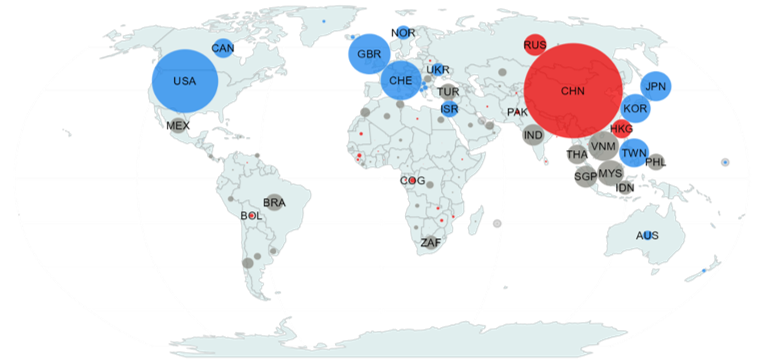
Notes: The size of the circles represents the share of each extra-EU country’s exports of FCIs in EU imports of FCIs from all extra-EU countries. Blue circles signal US-aligned countries, red circles China-aligned countries and grey circles neutral countries. International trade data are from the CEPII BACI dataset.
In Panon et al. (2024), we employ firm-level trade and balance sheet data for five European countries − Belgium, France, Italy, Slovenia and Spain − to shed quantitative light on the exposure to foreign supply risks. A firm-level partial equilibrium model, based on a production function approach, is used to assess the short-term effect of disruptions to the supply of FCIs from China and other countries with a similar geopolitical orientation (hereafter, China-aligned countries) on manufacturing value added. In the model, firms combine labour, capital, and intermediates, which are in turn produced using FCI and non-FCIs. Our baseline scenario consists of a sudden drop that halves the supply of FCIs from China-aligned countries. In line with business survey evidence (Attinasi et al., 2023; Bottone et al., 2023) and the economic literature (Barrot and Sauvagnat, 2016; Atalay, 2017; Boehm et al.,2019), it is assumed that, in the short run, firms cannot substitute these inputs. Such FCI supply disruptions would generate a drop in manufacturing value added of 2.0% for Belgium, 2.5% for France, 2.9% for Spain and 3.1% for Italy and Slovenia in the short term (Figure 2). Large firms are driving the overall change, accounting for about 75% of the value-added decline in all countries. This finding confirms Gabaix (2011)’s message: the behaviour of large firms explains a large share of aggregate fluctuations. The results for the top 1% of firms display more heterogeneity, explaining about 15% of the decline in Italy and Spain, a third in France and Belgium, and more than 50% in Slovenia.
Figure 2. Decomposition of Value-added Change (in %) by Exposed Firm Size
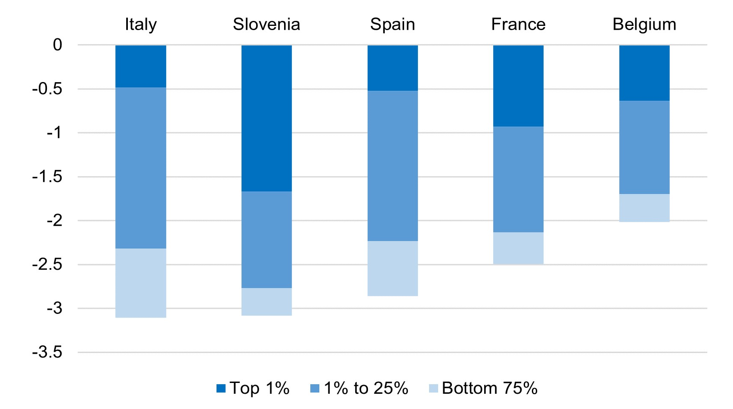
Notes: The chart reports the value-added change (in percentage) coming from a 50% drop in FCI supply from China-aligned countries. Firm size measured in value added (the percentile calculation only includes exposed firms). Only manufacturing firms are included.
The simulated impact is extremely heterogeneous across sectors. The electrical equipment industry stands out as the most affected sector, with a median value-added decline across countries that is more than double the overall median value-added decline (about 7%, compared to less than 3% overall). Other industries experiencing greater than the median declines include chemicals, basic metals, electronics, and machinery (Figure 3). Together, these five industries account for nearly one third of manufacturing value-added in our countries. Some sectors show a similar decline across countries (e.g. electronics), while for other sectors the results are much more dispersed at the country level (e.g. chemicals, machinery), reflecting different sub-sector compositions and firm-specific sourcing patterns.
Figure 3. Change in Value Added (in %) at the Sector Level Across Countries
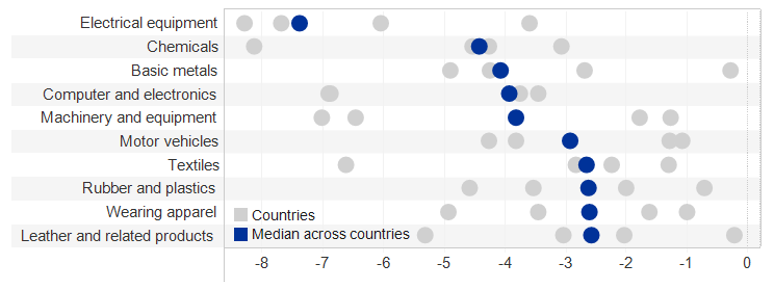
Notes: The chart reports the value-added change (in percentage) across the most exposed manufacturing sectors from a 50% drop in FCI supply from China-aligned countries.
Regional results are also very heterogeneous (Figure 4). The large heterogeneity across regions within countries is driven by two factors: specialisation and concentration. Regions specialised in sectors heavily reliant on FCIs, imported from extra-EU countries, are most affected. For instance, the Italian region of Marche is relatively more specialised than other regions in the production of electrical equipment, which is an industry that heavily relies on sourcing foreign critical inputs from China-aligned countries. The concentration of top producers in some regions also contributes to this heterogeneity: the presence of large exposed firms implies that their effect on the value added of their region is more substantial, which is consistent with the aggregate effects shown in Figure 2.
Figure 4. Change in Manufacturing Value Added (in %) at the Regional Level
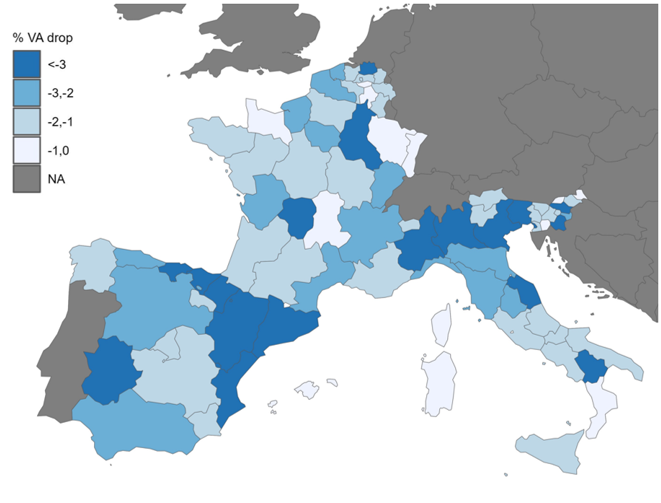
Notes: The chart reports the value-added change (in percentage) across regions coming from a 50% drop in FCI supply from China-aligned countries. Only manufacturing sectors are considered.
Identifying firms exposed to disruptions of critical inputs is key for policy makers to better prepare for forthcoming shocks with potential implications for growth and price stability. We argue that micro data are crucial not only for mapping strategic dependencies, but also for quantifying their importance in the event of a shock materialising. In this context, we support the call of Pichler et al. (2023) for “an alliance to map global supply networks” to design more effective industrial policies and policies aimed at diversifying away from China-aligned countries, and emphasize the importance of collecting micro data and making them available for research purposes.
Arjona, R., W. Connell and C. Herghelegiu (2023): “An enhanced methodology to monitor the EU’s strategic dependencies and vulnerabilities,” European Commission Single Market Economy Paper, 2023/14.
Atalay, E. (2017): “How important are sectoral shocks?” American Economic Journal: Macroeconomics, 9, 254–280.
Attinasi, M. G., D. Ioannou, L. Lebastard and R. Morris (2023): “Global production and supply chain risks: insights from a survey of leading companies,” ECB Economic Bulletin, 7, Box 1.
Barrot, J.-N. and J. Sauvagnat (2016): “Input specificity and the propagation of idiosyncratic shocks in production networks,” The Quarterly Journal of Economics, 131, 1543–1592.
Boehm, C. E., A. Flaaen and N. Pandalai-Nayar (2019): “Input linkages and the transmission of shocks: firm-level evidence from the 2011 Tohoku earthquake,” Review of Economics and Statistics, 101, 60–75.
Bottone M., M. Mancini, A. Boffelli, D. Pegoraro, A. Kutten, I. Balteanu and J. Quintana (2024): “Governance dynamics and de-risking strategies in Europe: a comparative study of Germany, Italy, and Spain”, Unpublished manuscript.
European Commission (2021): “Strategic dependencies and capacities,” Commission Staff Working Document, 352.
Gabaix, X. (2011): “The granular origins of aggregate fluctuations,” Econometrica, 79, 733–772.
Panon, L., L. Lebastard, M. Mancini, A. Borin, P. Caka, G. Cariola, D. Essers, E. Gentili, A. Linarello, T. Padellini, F. Requena and J. Timini (2024): “Inputs in distress: geoeconomic fragmentation and firms’ sourcing”, Bank of Italy Occasional Papers, 861.
Pichler, A., C. Diem, A. Brintrup, F. Lafond, G. Magerman, G. Buiten, T. Choi, V. Carvalho, J. Farmer and S. Thurner (2023): “Building an alliance to map global supply networks,” Science, 382, 270–272.