Credit risk has played a significant role as a catalyst or key factor in many financial crises, including the great financial crisis. More recently, the COVID-19 pandemic highlighted the importance of potential bank credit losses to the private sector. However, there remains a significant gap in terms of reliable economy-level credit risk data for financial stability analysis, given that such information is not publicly available in any systematic manner. We discuss the various credit loss concepts and estimate a time series database of actual as well as forward-looking market- and macro-implied credit loss rates for the majority of jurisdictions around the world, intended as a public good that is freely accessible.
Credit risk has played a central role in many financial crises, including the great financial crisis (GFC). It has contributed to the bulk of banks´ overall crises-related losses, which tend to spike suddenly from the very low levels typically observed during “peacetime.” Major credit-related crises in history include the Great Depression of the 1930s, the Savings and Loan crisis in the late 1980s and early 1990s, and the subprime crisis in 2007 that triggered the GFC, all in the US. Elsewhere, the Latin American debt crisis of the 1980s, Asia’s twin banking and currency crises during the latter part of the 1990s, and Europe’s bank-sovereign debt crisis in 2011–12 stand out. Globally, corporate borrowing has expanded since the GFC. Interestingly, however, the COVID-19 pandemic—followed by the sharp rise in interest rates around the world to address inflationary pressures arising from pent up demand and supply chain disruptions—has not (yet) resulted in the manifestation of massive credit losses.
The COVID-19 pandemic highlighted the importance of being able to properly assess the credit risks on banks’ books. The pandemic put substantial pressure on the balance sheets of firms and households, particularly in the most affected sectors, as widespread lockdowns and social distancing requirements crushed demand for goods and services and sharply increased unemployment. Consequently, banks were faced with deteriorating asset quality in their loan portfolios. In recognition of this threat to financial stability, policymakers introduced wide-ranging measures that included moratoria on debt payments and regulatory forbearance on bank capital and liquidity requirement, as well as their treatment of classified and nonperforming loans (NPLs), amid highly accommodative monetary and fiscal policies. Consequently, corporate and private insolvencies have remained very low—even declined in many economies during 20201—particularly when juxtaposed against the depth of the recession, an outcome referred to as the “COVID-19 bankruptcy gap.”2 However, the concern is that the expansive public support measures may have only postponed firm insolvencies rather than canceled them altogether.3
Our aim is to close the long-standing gap in economy-level credit loss information. Our analysis builds upon the work by Daniel Hardy and Christian Schmieder4, combining time series of actual credit losses with forward-looking market- and macro-implied credit loss rates to develop various credit loss datasets at the economy level, covering as many jurisdictions in the world as possible. Importantly, we make this database freely available for public use, in an effort to extend the reach and improve the transparency of financial stability analysis.5
So, what is the best measure of credit loss? There are several concepts and metrics that have been proposed or adopted to date, for either micro- or macroprudential purposes or both. In this project, we adopt the typology established by Schmieder, Puhr, and Hasan (2011) in the aftermath of the GFC. We express loss rates as a fraction of credit exposures and aim for metrics that are, ideally, representative of economy-wide credit losses across all assets classes.
Forward-looking credit loss rate estimates
Contemporaneous realized credit loss rates
Implied credit loss rates from NPL stock data
Unlike many other types of financial data, real-time contemporaneous and forward-looking credit risk statistics are scarce, and even if available, not regularly published. An important reason for this lack of information is that the nature of credit risk is complex to capture and tends to be relatively sticky. Forward-looking credit risk flow data, such as the Basel III IRB parameters, are typically published in banks’ Pillar 3 reports. However, Pillar 3 information across individual banks is not readily compiled in one place and the flexibility for bank management to comment on the specificities of a bank’s risk profile limits comparability. Then there is a range of credit loss data compiled by vendors, but such information needs to be purchased, typically at very high costs.
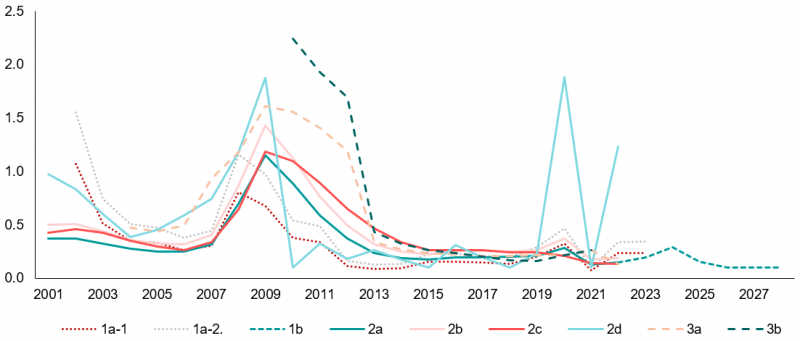
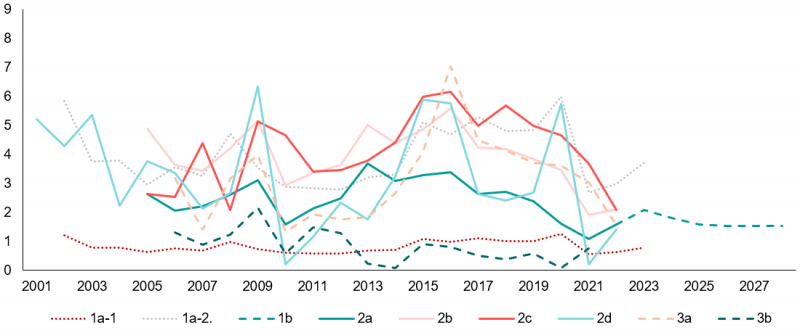
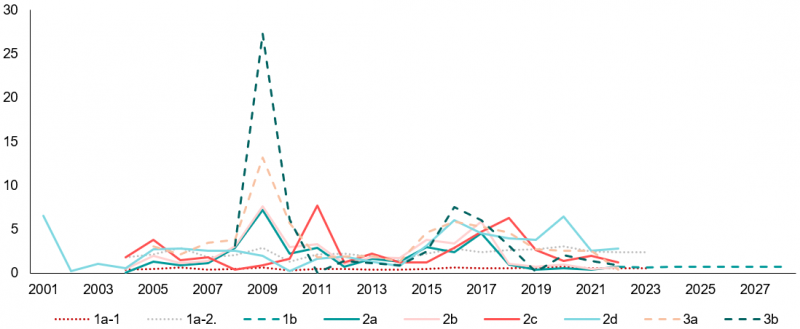
In an effort to address the gaps in and shortcomings of existing data, we estimate three different series of economy-level loss rates, with different purposes: we distinguish between forward-looking credit loss rate estimates, contemporaneous realized credit loss rates, and implied credit loss rates from actual NPL stock data. We distinguish between eight different metrics (Figure 1), which are standardized to annual frequency and, as much as possible, in their definitions. We draw on credit risk information from multiple sources in both the public and private domains in deriving our database:
The data confirm that the impact of the pandemic was unusual, with fairly low credit loss rates across financial systems—at least to date—despite many countries suffering very deep economic recessions. In general and on average, AEs tend to realize lower loss rates compared to EMEs and LIDCs (Figure 1), attributable to: (1) generally more stable economic conditions; (2) stronger corporate governance; (3) better supervision and regulation of banks; (4) more established crisis management capacity and tools; and last but not least, (5) more developed legal systems and efficient bankruptcy laws.
Each metric has its usefulness, given its purpose and country-specific factors. We present two countries—the United States Brazil and Nigeria—to highlight the differences (Figure 1). Aside from the attempt to anticipate (metrics 1a-1, 1a-2, 1b) or nowcast (metrics 2a, 2b) losses, the stock of NPLs and implied NPL flow metrics (metrics 3a, b) characterize the process of writing off losses, which can be fairly swift in some countries, or fairly lengthy in others where bankruptcy processes may be protracted. Moreover, comparisons from using different sources—aggregated information based on bank-specific information and data reported by national authorities—are useful and could potentially reveal the clustering of risks, including at the institution level.
Our framework also allows for multi-year projections based on anticipated GDP trends. Specifically, simplified scenario analyses are possible, to simulate the impact of adverse macroeconomic conditions (Figure 2). As a caveat, users should recognize the limitations of using one macroeconomic variable only, which keeps the framework simple but does not necessarily translate one-to-one into reality, especially if substantial policy support is being provided to mitigate the impact of recessions.
Figure 1: Credit loss Rates (Percent)
Advanced Economy: United States
Emerging Market Economy: Brazil
Low Income Developing Country: Nigeria
Source: Authors’ estimates.
Note: 1a-1: Market -implied credit loss rate, original series; 1a-2: Market -implied credit loss rate, adjusted to economy-average; 1b: Forward-looking credit loss rate implied from GDP; 2a: Realized credit loss (impairment) rate; 2b: Realized loan loss (impairment) rate; 2c: Realized loan loss (charge-off) rate; 2d: Realized credit loss rate implied from GDP; 3a: Loan loss rate implied from (bank-level) NPLs; 3b: Loss rate implied from (economy-level) NPLs.
Figure 2: Credit Loss Simulations of Very Adverse Recessions Scenarios for the US
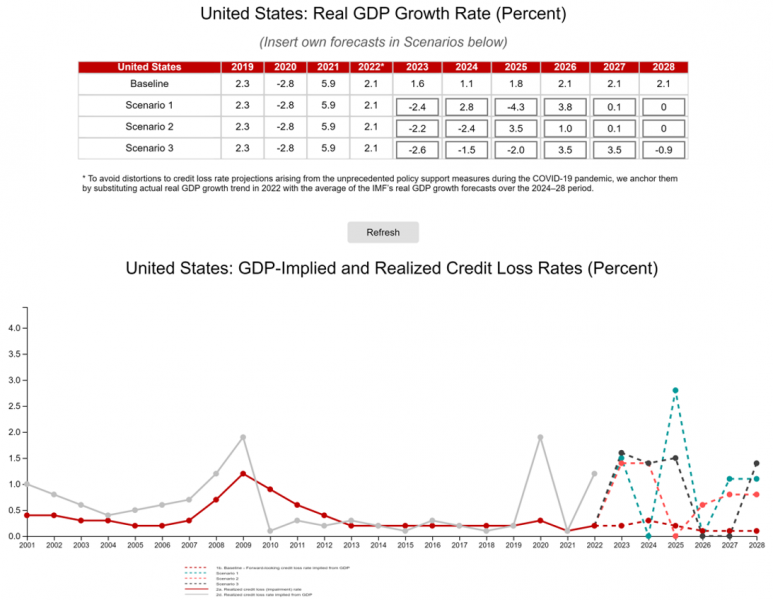
The COVID-19 pandemic exposed a blind spot in the assessment of credit risk on bank balance sheets. Unfortunately, significant gaps in credit risk information for estimating credit losses at the economy level—a key element in financial stability analysis—persists. We attempt to close that gap, especially for countries with less available information on credit risks, such as EMEs and LIDCs, by applying a myriad of macroeconomic, as well as economy-level and institution specific credit-related information. In particular, we estimate a suite of credit loss rate metrics with useful applications in their own right. We also propose GDP-implied loss rate simulations, as is regularly adopted in stress tests, in an effort to anticipate peaks in credit loss rates. Our database can help facilitate credit loss analyses and predictions, but can be continuously improved. Going forward, a promising avenue may be to use concepts anchored in a consistent analytical framework of macro-financial variables.
Banerjee, Ryan Niladri, Giulio Cornelli, and Egon Zakrajšek. 2020. “The Outlook for Business Bankruptcies.” BIS Bulletin No. 30, Bank for International Settlements, Basel, October 12. https://www.bis.org/publ/bisbull30.htm.
Banerjee, Ryan Niladri, Joseph Noss, and Jose Maria Vidal Pastor. 2021. “Liquidity to Solvency: Transition Cancelled or Postponed.” BIS Bulletin No. 40, Bank for International Settlements, Basel, March 25. https://www.bis.org/publ/bisbull40.htm.
Basel Committee on Banking Supervision (BCBS). 2006. “Basel II: International Convergence of Capital Measurement and Capital Standards: A Revised Framework Comprehensive Version.” Basel, June 30. https://www.bis.org/publ/bcbs118.htm.
Djankov, Simeon, and Eva Yiwen Zhang. 2021. “As COVID Rages, Bankruptcy Cases Fall.” VOXEU, Center for Economic and Policy Research, February 2021. https://cepr.org/voxeu/columns/covid-rages-bankruptcy-cases-fall.
Elizondo Flores, Jesús Alan, Tania Lemus Basualdo, Ana Regina Quintana Sordo, and Comisión Nacional Bancaria y de Valores, Mexico. 2010. “Regulatory Use of System-Wide Estimations of PD, LGD, and EAD.” Financial Stability Institute, Basel, September. https://www.bis.org/fsi/awp2010.htm.
Gourinchas, Pierre-Olivier, Ṣebnem Kalemli-Özcan, Veronika Penciakova and Nick Sander. 2021. “COVID-19 and SMEs: A 2021 ‘Time Bomb’?” NBER Working Paper 28418, National Bureau of Economic Research, Cambridge, Massachusetts. https://www.nber.org/papers/w28418.
Hardy, Daniel C., and Christian Schmieder. 2020. “Rules of Thumb for Bank Solvency Stress Testing.” In Stress Testing: Principles, Concepts, and Frameworks, edited by Li Lian Ong and Andreas A. Jobst, Chapter 7. Washington, DC: International Monetary Fund. https://www.elibrary.imf.org/display/book/9781484310717/9781484310717.xml.
Juselius, Mikael, and Nikola Tarashev. 2020. “Forecasting Expected and Unexpected Losses.” BIS Working Paper No. 913, Bank for International Settlements, Basel, December 21. https://www.bis.org/publ/work913.htm.
–––––. 2021. “Could Corporate Credit Losses Turn Out Higher than Expected?” BIS Bulletin No. 46, Bank for International Settlements, Basel, August 18. https://www.bis.org/publ/bisbull46.htm.
Schmieder, Christian, Claus Puhr, and Maher Hasan. 2011. “Next Generation Balance Sheet Stress Testing.” IMF Working Paper 11/83, International Monetary Fund, Washington, DC. https://www.imf.org/en/Publications/WP/Issues/2016/12/31/Next-Generation-Balance-Sheet-Stress-Testing-24798.
Vandenberg, Paul. 2021. “Why Have Bankruptcies Fallen during the Pandemic?” Asian Development Blog, Asian Development Bank, Manila, May 26. https://blogs.adb.org/blog/why-have-bankruptcies-fallen-during-pandemic.
Banerjee, Cornelli, and Zakrajšek (2020), Djankov and Zhang (2021), and Vandenberg (2021).
A detailed exposition of the CLR estimations may be found in the respective BIS and AMRO working papers, and the associated dashboard and database are publicly available.
Juselius and Tarashev (2020, 2021) use metrics such as debt service ratios and credit gaps to forecast baseline (expected) and extreme but plausible deviations from the baseline (unexpected) losses on corporate loans.
Ashbaugh (2015).
For example, if a jurisdiction reported an NPL stock ratio of 2 percent in year t-1 and 3 percent in year t, and the time to resolution is 2 years, then the implied NPL flow ratio (default rate) at year t would be 2 percent (= 3% – 2% + (50% x 2%)).