Climate change and the transition to a low-carbon economy have become part of our society’s urgent and unavoidable agenda. Institutional investors need to respond to the risks and opportunities brought about by the climate challenge in the construction and management of their investment portfolios. In that respect, a growing appetite and need call for the inclusion of sustainable and responsible criteria in the investment process. Our work aims to contribute to the incipient analysis of the inclusion of climate change criteria in fixed income investment processes, incorporating, from an eminently empirical approach, two aspects considered to be of utmost importance: the cost of decarbonisation and the selection of the SRI portfolio construction strategy.
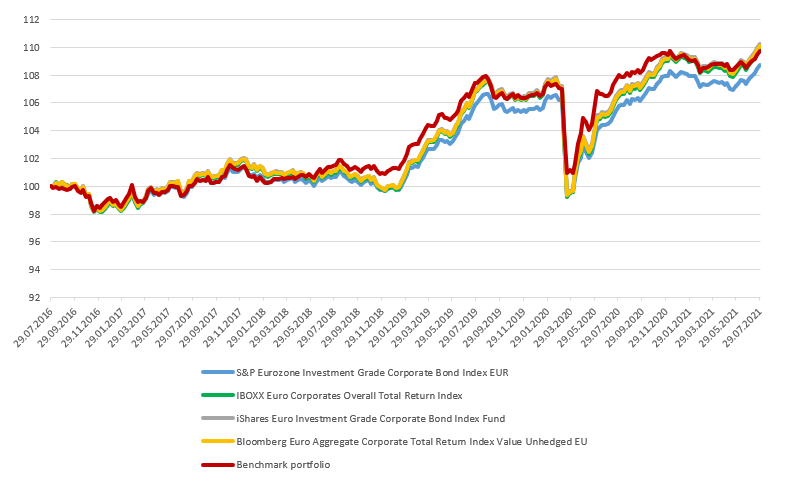
The analysis is based on an initial benchmark portfolio composed of bonds from 19 euro area corporate issuers with an investment-grade credit rating, i.e., with a rating above BBB-. Allocation to the different issuers is made following a market criterion, weighting each of the companies by their long-term debt level (see Chart 1). The selected issuers constitute a highly representative sample of the main indices of the euro area corporate bond market while satisfying the characteristic of maintaining a constant duration throughout the sample period (see Chart 2).
In our analysis we have opted to use carbon intensity as the climate risk metric (2020 Scope 1 and 2 emissions data from Bloomberg and companies’ annual accounts and sustainability reports), not only due to its simplicity but also because the lack of consistency across the ESG scores of the different information providers and the low correlation between this latter metric and the carbon footprint complicate analysis.1
Chart 1: Benchmark composition
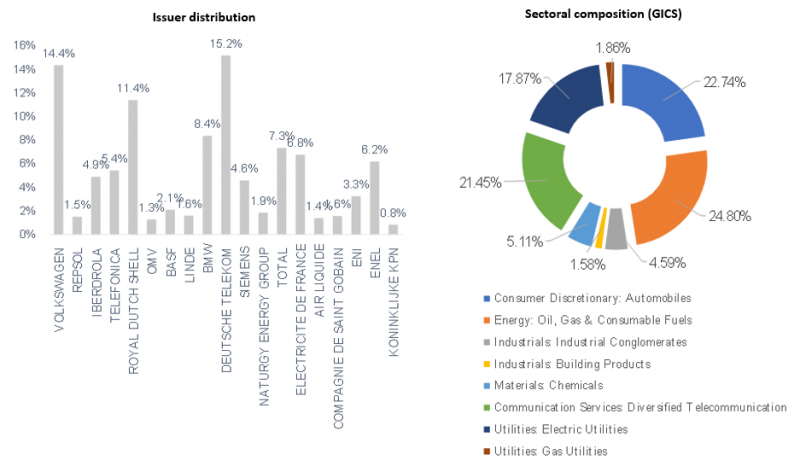
Chart 2: Benchmark portfolio vs. euro area IG Corporate Bond Indices
In the same line of work as Pedersen et al. (2021)2 for equity assets, and starting from three variables (risk, return and a third variable representing the degree of ‘sustainability’), we reduce the problem of the sustainability-concerned investor to the optimisation of two variables in the set of investment opportunities: a climate risk variable, represented by portfolio carbon intensity (Weighted Average Carbon Intensity or WACI), and a financial variable, namely the deviation in terms of Tracking Error (TE) from the benchmark. In their study, Pedersen et al. use the ESG score as an extra-financial variable and the Sharpe ratio as a financial variable.
The aim is to find the vector of weights that generates optimal decarbonised portfolios in the sense that they achieve the reduction in the initial carbon footprint of the benchmark portfolio, while complying with other restrictions on its financial variables. The analysis seeks to derive the optimal reallocation of assets within a passive management mandate, where the preferred or structural position is that of the benchmark portfolio, both in terms of its sectoral distribution and its asset composition, and the manager’s fundamental objective is to minimise the active risk assumed against the benchmark portfolio. TE, defined as the volatility of active returns (excess return between the portfolio and the benchmark), is usually used as a metric for this active risk.
Therefore, with the dual objective of fulfilling a passive management mandate and decarbonising the portfolio, we derive the efficient frontier, consisting of the set of optimal portfolios that minimise TE for each level of carbon intensity (CI), namely, we search for the set of portfolios that reduces the initial WACI with the smallest deviation from the reference portfolio in terms of TE. The efficient frontier thus designed (’SRI Efficient Frontier’) is a function solely of the assets’ characteristics (carbon intensity, risk and return) and does not depend on the investor’s preferences, thus fulfilling the principle of separation of the traditional mean-variance frontier. As a result of the optimisation of TE and WACI, the efficient frontier is decreasing and convex (see Chart 3), showing that a well-defined trade-off between the reduction in the portfolio’s carbon footprint and TE indeed exists: a reduction in the carbon footprint requires an increasing TE against the benchmark portfolio. In other words, in a passive portfolio management context, investors aiming to implement portfolio decarbonisation strategies must accept a certain level of active risk. This cost has to be estimated as a precondition for achieving a realistic carbon footprint reduction in line with the parameters of the investment mandate to which the portfolio is subject.
Chart 3: SRI-Efficient frontier: carbon intensity (WACI) vs. tracking error (TE)
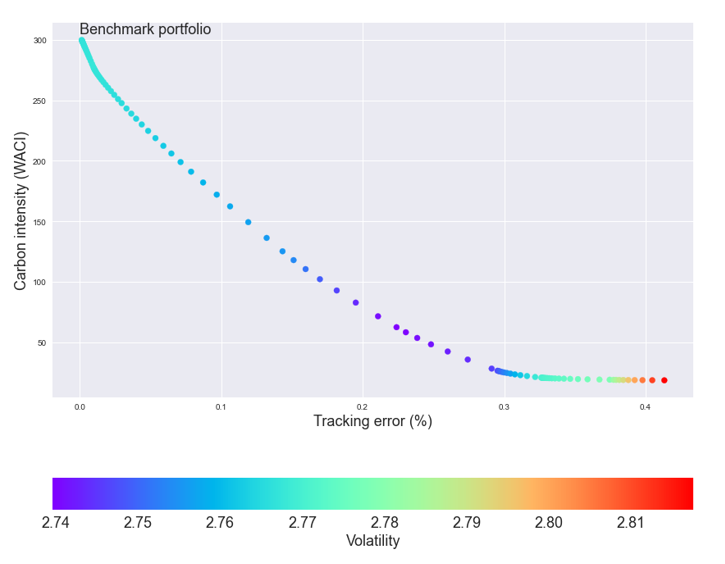
The results of our analysis appear consistent with the conclusions reached in other research studies applied to fixed income portfolios, such as Ben Slimane et al. (2020)3, which also find an inverse trade-off between the decarbonisation metric (in their case the ESG score of each company) and the ex post TE of the portfolio against the benchmark. The increase in active risk is also reflected in a lower diversification, both in terms of a reduction in the number of assets employed and from a sectoral concentration perspective. Once a certain level of carbon footprint reduction is achieved, at the cost of increasing TE, further decarbonisation is accompanied by a lower diversification: fewer assets in the resulting portfolio and a higher sectoral concentration compared with the benchmark.
Ultimately, sustainability-minded investors will need to choose the desired degree of reduction in the portfolio’s carbon footprint and be aware of the cost associated with that level of decarbonisation. In the case of European investors, if their objective is to meet the minimum transition risk standards dictated by the Paris Agreement commitments, in line with the climate benchmarks set out in EU regulation (climate transition benchmarks (CTB) and Paris-aligned benchmarks (PAB)), they will need to aim for an initial 30% (CTB) or 50% (PAB) reduction in the portfolio’s carbon footprint relative to their investment universe.4
For illustrative purposes, Table 1 shows the main metrics comparing the benchmark portfolio with the two portfolios fulfilling the initial decarbonisation required by the CTB and PAB. Both portfolios entail a deviation in terms of TE from the benchmark, increasing with the degree of required decarbonisation. However, the impact on risk-return metrics is limited, with a slight decrease in the Sharpe ratio, especially for the PAB portfolio, surely due to the high correlation between the assets in the portfolio.
As a final note, in the case of an investor being able to adopt short positions in the portfolio, the trade-off becomes a linear function with a greater slope than the efficient frontier of the traditional investor, who progressively assumes a higher cost in terms of TE per unit of WACI reduction. Thus, the possibility of adopting short positions results in a lower cost for the short-selling strategy in terms of active risk, which is lower the higher the decarbonisation objective is. This result is in line with traditional portfolio management theory, which anticipates that when the investor is allowed to assume short positions, the efficient frontier widens, allowing a larger set of investment possibilities, while improving the trade-off between risk and return.
Table 1: Portfolios complying with the CTB and PAB: summary metrics

As discussed above, the fixed income portfolio decarbonisation process may require certain costs in terms of reduced diversification, increased sectoral concentration and higher active risk against the benchmark portfolio. These costs, together with a potential impact on performance metrics, could have negative consequences for the investor’s objectives in a passive management context.
To overcome this drawback, fixed income investors have several strategies at their disposal that should allow them to integrate SRI factors into the management of their investment portfolios, in order to meet both their objectives and the investment mandate. These strategies, broadly used in equity portfolios, are not mutually exclusive and can be efficiently combined to enable the incorporation of these criteria into the fixed income investment process.
In this note, we will use four strategies for the portfolio design, namely, exclusion strategy, best-in-class, tilting, and Green-Parity, to empirically analyse how the application of these green strategies impacts the achievement of the decarbonisation goal and the risk-return metrics versus the market benchmark.
This strategy seeks to exclude from the investment universe certain issuers operating in sectors, products or services that are considered unacceptable according to the investor’s ethical principles or values. In this case, we assume that the threshold is set at 700 tCO2e/sales, which excludes five issuers from the initial universe (19% of those in the benchmark portfolio).
Best-in-class is a variant of positive screening strategies and consists of actively filtering companies according to their position in a ranking based on the chosen SRI metric. In short, the goal is to select the leaders within each sector (those issuers with the lowest carbon intensity), maintaining the same sectoral composition as the benchmark.
This approach is also a variant of positive screening. In this case, the portfolio is constructed by applying a weighting factor (tilting factor) to each issuer which increases or decreases its weight in the strategy, relative to the benchmark, depending on its carbon intensity. The sample is divided into quantiles and the issuers are ranked according to their carbon intensity.
We define Green-Parity as an SRI strategy that sets the optimal weighting so that each of the portfolio’s assets generates the same climate risk budget, i.e., each issuer equally contributes to the portfolio WACI. Under this strategy, as in risk budgeting approaches, risk (in this case, climate risk) is the main criterion for asset allocation, seeking to ensure that no component in the portfolio is more polluting than another.
Table 2 presents the results of applying the above-mentioned SRI strategies to the benchmark where, additionally and for comparison, the equal-weighted naive strategy is incorporated. As can be seen, all the resulting SRI portfolios reduce the carbon footprint compared with the benchmark. The dominant strategy, for the sample and period analysed, is Green-Parity, as it is the most efficient, in relative terms, when comparing the degree of decarbonisation achieved against the cost in terms of TE (WACI/TE) and diversification, both at sectoral (WACI/HI) and asset level (it achieves the highest diversification ratio among the strategies). These green performance ratios would be the equivalent to the traditional risk-return ratios, where financial return is replaced by the CI reduction and the denominator, instead of volatility, is penalised by TE or by the deviation from the benchmark in sectoral composition (measured through Herfindhal Index).
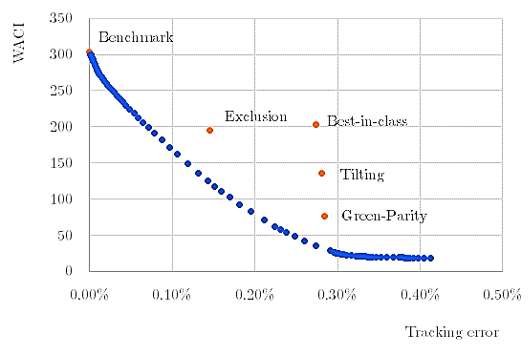
Chart 4 shows, in the WACI-TE space, the result achieved by each strategy, as well as its position relative to the efficient frontier. The Green-Parity strategy dominates the rest by achieving the highest degree of decarbonisation for a given deviation in terms of TE. This result depends, logically, on the parameters chosen for the different strategies, i.e., the exclusion percentage, the distribution and weighting of quantiles in the case of tilting, and the number of leaders selected within each sector in the best-in-class strategy. When it comes to practical implementation, investors must properly calibrate the strategy parameters to reach a position in the WACI-TE space compatible with their financial and climate objectives.
In short, investors must choose the strategy, or mix of strategies, that allows them to simultaneously accomplish their sustainability and financial objectives, striking the desired balance between the two goals. Based on the results obtained for the benchmark portfolio and period analysed, we can conclude that the two objectives are not mutually exclusive, i.e., investors do not necessarily have to forgo a higher risk-adjusted return when setting a decarbonisation objective for a corporate bond portfolio.
Table 2: Results of SRI strategies vs. benchmark portfolio
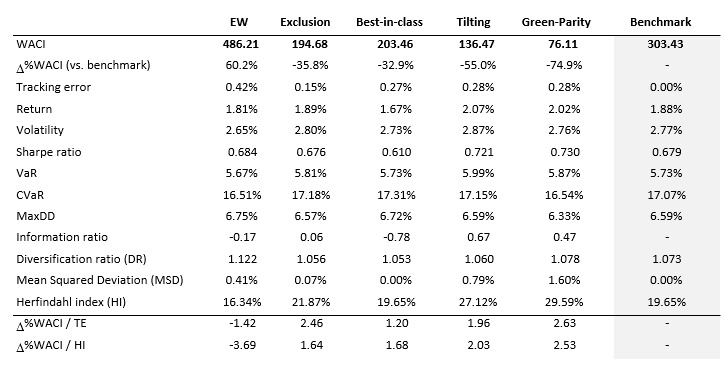
Chart 4: WACI – TE efficient frontier and SRI strategies
For the benchmark portfolio and sample period used, we find a trade-off (a negative and convex relationship) between the carbon footprint and TE, implying that further decarbonisation targets involve an increasing cost in terms of deviation in the risk assumed from the benchmark portfolio, not only in terms of TE but also with respect to diversification and sectoral concentration. To adequately manage this active risk, investors have a variety of strategies at their disposal that will enable them to meet both their sustainability objectives and their investment mandate at the same time. In addition to the more familiar approaches, such as exclusion, best-in-class or tilting, a new strategy called Green-Parity is presented, transferring concepts from risk-based asset allocation to the integration of the carbon footprint into the design of corporate bond portfolios. This proposal is the one that yields the most favourable results among the other strategies used in the study, defining performance ratios (or green return ratios) in which the positive effect of the decarbonisation achieved is compared to the cost assumed in TE or divergence in the sectoral portfolio composition.
Finally, based on the results obtained for the benchmark portfolio and sample period, there is not necessarily a penalty, in terms of risk-return, stemming from the achievement of the decarbonisation objectives.
The carbon intensity of a company is defined as the average volume of metric tonnes of CO2 equivalent emitted in a year divided by its annual sales figure in millions of euro. This relative metric, which normalises emissions by sales or revenues of each company, allows for better comparison between different issuers. Another advantage, compared with absolute metrics, is that it reduces the distribution kurtosis.
Pedersen, L. H., S. Fitzgibbons and L. Pomorski (2021). “Responsible investing: The ESG-efficient frontier”, Journal of Financial Economics, Vol. 142(2).
Ben Slimane, M., E. Brard, T. Le Guenedal, T. Roncalli and T. Sekine (2020). “ESG Investing in Fixed Income: It’s Time to Cross the Rubicon”, Discussion Paper 45, Amundi Research.
See the final report of the EU Technical Expert Group on Sustainable Finance (TEG). For simplicity, only the initial 30% and 50% reduction in carbon footprint against the baseline portfolio is illustrated. EU standards also dictate an additional decarbonisation trajectory of 7% on average per year, along with other exclusion requirements for certain activities and companies.