menu
close

Author(s):

Tihana Škrinjarić | Croatian National Bank

Keywords:

systemic risk , macroprudential policy , countercyclical capital buffer , composite indicators , cyclical risks

JEL Codes:

C14 , C32 , E32 , E44

This note is based on the paper: Š krinjarić , T. (2022), Introduction of the composite indićator of cyclical systemic risk in Croatia: possibilities and limitations, CNB Working Papers, W-68, Croatian National Bank.  The views expressed in this study reflect the author’s opinions and are not necessarily those of Croatian National Bank.

This research compares the advantages and shortfalls of different approaches to monitoring systemic risks that depend on the phase of the financial cycle of an economy. Decision-making and calibration of macroprudential policy instruments depend on many individual indicators, such as credit dynamics, overvaluation of real estate prices, external imbalances, and many others. That is why solutions in the form of composite indicators of cyclical systemic risk exist in practice. They summarize a lot of information in a form that is easier to monitor, communicate with the public and ultimately make decisions about the countercyclical capital buffer. Its calibration depends on the numerous aforementioned indicators that should reflect the accumulation of cyclical systemic risks in the economy. Since there has been no composite indicator of cyclical risks in Croatia so far, this research considers several popular approaches to constructing composite indicators of cyclical risks, specifically for the case of Croatia. The paper is comprehensive because it contrasts popular approaches in practice and comments on the possibilities of adjusting the calculation of indicators for the case of Croatia. Finally, several options for calibrating the countercyclical capital buffer are presented based on the selected best composite indicator.

Motivation for the introduction of a composite indicator

The macroprudential policy monitors different systemic risks, which can be divided into two primary groups: structural and cyclical. Cyclical systemic risks depend on the phase of the financial cycle in which the economy is located. Therefore, to mitigate such risks and their eventual materialization, time-varying macroprudential instruments are applied in practice. One of the main instruments is the countercyclical capital buffer (CCyB), whose calibration is based on indicators that should reflect the accumulation of cyclical risks in the financial system. However, practice and research have shown that it is not enough to monitor credit dynamics alone for these purposes (Tölö et al., 2019). It is necessary to summarize and synthesize a large amount of information. Therefore, increasingly in the practice of central banks, some approaches try to synthesize information about the financial cycle from several indicators into one measure, given the increasing number of indicators considered in practice.
Therefore, macroprudential policymakers may benefit from the results of this research paper, given that the synthesizing of data in the form of composite indicators makes it easier to monitor the dynamics of the individual variables they comprise and given that it guides how to determine the level of the CCyB by taking into account the assessment of the level of accumulation of systemic risks in the system, i.e., the assessment of the position of the economy in the financial cycle. In addition, using such an indicator can contribute to at least mitigating, if not preventing, systemic financial crises that have resulted in significant losses in the past.
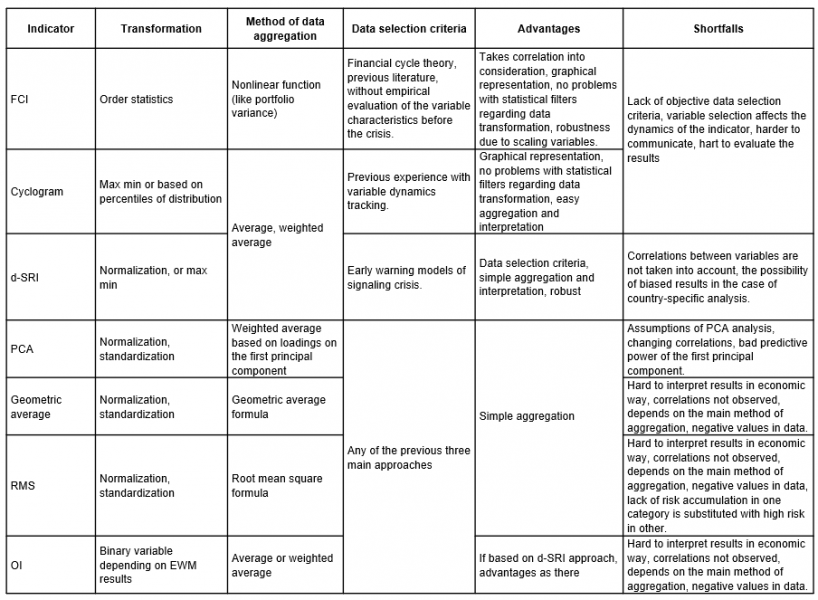
Table 1: Summary of the main approaches for composite indicator construction 
 width=
Sources: author’s preparation based on discussion in the paper Note: FCI – financial cycle indicator, d-SRI – domestic systemic risk indicator, PCA – principal component analysis, RMS – root mean square, OI – overheating index, EWM – early warning model. For full description of each approach, please see the full paper.

Comparison of selected approaches of composite indicator calculation

An extensive presentation of existing approaches and practices was made, in such a way that individual indicators, their ideas, methods of calculation, advantages, and disadvantages were examined. Table 1 provides a brief overview of some of the possible approaches.

Best approach for the Croatian case

Based on the discussion, the selected best indicator for the case of Croatia is analyzed in the second part of the research. A comparison of the composite indicator of the financial cycle, the cyclogram, the indicator of systemic cyclical risk, as well as the additional possibilities of data aggregation concerning the analysis of the main components, the overheating index, and several proposed variants of the way of data transformation and aggregation were made. The results suggest that the importance of certain categories of cyclical measures should be taken into account at the same time risks, but also the interpretation of the final result. Thus, based on the obtained results, it is concluded that currently, a variant of the composite indicator of cyclical systemic risk defined in Lang et al. (2019) adapted for the case of Croatian data is adequate for monitoring the cyclicality of systemic risk. Figure 1 shows the best composite indicator for the case of Croatian data based on the analysis.
Figure 1: Best composite indicator of cyclical systemic risk for the Croatian case 
 width=

Sources: Croatian National Bank, author’s calculation 
The interpretation of the results in Figure 1 is quite intuitive, given that the values of individual risk categories and the final composite indicator itself move in intervals that include both positive and negative values. This facilitates communication with the public, as well as the very interpretation of risk accumulation or release. All indicators reached their highest levels during the economic boom that preceded the global financial crisis, to which all included indicators contributed. With the arrival of the global financial crisis and the entry of the Croatian economy into a multi-year recession, the value of both indicators is rapidly falling due to the slowdown in credit growth, falling residential real estate prices, and the reduction of external imbalances. The lowest value of the indicator was recorded at the end of 2016, after which the recovery began, which, with temporary setbacks, is present until today. The upward trend of both indices points to the recovery of the credit and financial cycle, characterized by a low perception of risk and the accumulation of systemic risks. The most significant contribution to the increase in the value of ICSR (Indicator of cyclical systemic risk) since 2017 is the growing overvaluation of residential real estate and the acceleration of credit activity.

Final considerations

The composite indicators analyzed in the research are a starting point in setting the level of the countercyclical capital buffer. Thus, several approaches were examined: one based on the distributional properties of the composite indicator, another based on the threshold values from the early warning models, and a third one, the “positive neutral rate” approach. Having several approaches available enables policymakers some flexibility in practice. The results are helpful because, on the one hand, synthesizing more information in the form of composite indicators facilitates the monitoring of the dynamics of the individual variables that make them up. On the other hand, guidelines are given on determining the level of CCyB concerning the assessment of the accumulation of systemic risks in the system, that is, the evaluation of the economy’s position in the financial cycle.

References

Lang, J-H., Izzo, C., Fahr, S. i Ruzicka, J. (2019). Anticipating the bust: a new cyclical systemic risk indicator to assess the likelihood and severity of financial crises. Occasional Paper Series, No. 219. European Central Bank.
Tölö, E., Laakkonen, H. i Kalatie, S. (2018.). Evaluating Indicators for Use in Setting the Countercyclical Capital Buffer. International Journal of Central Banking, 14(2), pp. 51-111.

Škrinjarić, T. (2022). Introduction of the composite indicator of cyclical systemic risk in Croatia: possibilities and limitations, CNB Working Papers, W-68, Croatian National Bank, https://www.hnb.hr/en/-/introduction-of-the-composite-indicator-of-cyclical-systemic-risk-in-croatia-possibilities-and-limitations.


About the authors

Tihana Škrinjarić

Tihana Škrinjarić is an Advisor at the Macroprudential Policy and Financial Stability Department at the Croatian National Bank since 2021. She holds a Ph.D. in Economics, and her interests include econometrics applications within macroprudential policy, cyclical risk evaluation and general macroprudential stance assessment. Prior to her work at the national bank, she was an Assistant Professor at the University of Zagreb, where her interests included financial econometrics and time series.

More on these topics

Tags: