menu
close

Author(s):

Matjaž Volk | Bank of Slovenia

Keywords:

monetary policy , transmission , pass-through , effectiveness

JEL Codes:

E52 , E58 , G21

The views expressed in this paper are solely the responsibility of the author and do not necessarily reflect the views of the Bank of Slovenia or the Eurosystem. An extended technical version of this paper is available on the Banka Slovenije website (link).

This policy brief analysis the transmission of the ECB policy rate to bank deposit rates. From June to December 2022, the policy rate increased by 2.5pp, while deposit rates in euro area banks increased only by 0.2pp. The pass-through was not perfect even in the previous cycle between 2005 and 2008, but it was nevertheless much higher compared to the recent one. I show that the two main factors behind a sluggish response in deposit rates are the sizeable amount of deposits and liquidity in banks’ books. These effects are undesirable and work against ECB’s efforts to restore price stability by tightening monetary policy.

1. Introduction

In the middle of 2021, the inflation rate in the euro area started to rise, and by December 2022, it had surged to 9.2%, a level well above the ECB’s target of 2%. In response to that, the ECB started tightening its stance in December 2021, when they announced a step-by-step reduction in the pace of asset purchases.1 In July 2022 the ECB increased key policy rates for the first time since 20112, which was followed by three additional rate hikes, resulting in an overall increase of 2.5pp by end of 2022.
The increase in policy rate has fully transmitted to an increase in market rates, whereas lending and especially deposit rates have shown only a muted response so far. This is undesirable in current conditions of high inflation, as the loan demand decreases by less than it might be anticipated by policy rate hikes and at the same time, low deposit rates incentivise consumption instead of saving.
In this policy brief, I investigate the drivers of the low transmission of policy rate to deposit rates. I compare the pass-through in the current policy hike cycle, with two previous ones in 2011 and 2008. For this purpose, I use bank-level data for a large sample of euro area banks, covering around 80% of eurosystem’s total assets. The analysis uses the data until end of December 2022, i.e. when the deposit facility rate stood at 2%.
The results of my analysis touch upon the effectiveness of the interest rate channel (Mishkin, 1996 and Boivin et al., 2010) and the bank lending channel (Bernanke et al., 1991, Kashyap and Stein, 2000, Altavilla et al., 2020), which is one of the crucial propagation channels in the euro area. According to the results, both channels could currently be significantly impaired in the euro area as in presence of high amount of deposits and liquidity, banks adjusted theirs deposit rates only marginally. This does not incentivise saving and at the same time it results in a lower transmission to lending rates.

2. Policy rate transmission to bank lending and deposit rates

From June to December 2022, the policy rate increased by 2.5pp, which fully transmitted to an increase in EURIBOR (see Figure 1). Over the same time period, lending and deposit rates for new businesses increased only by 1.2pp and 0.2pp, respectively.

Figure 1: Rate increases from June to December 2022


 width=

Note: The figure shows increase in rates between June 2022, which is one month before the initial rate hike, and December 2022. In pp. Source: ECB, MIR, own calculations. 
Figure 2: Features of bank funding and asset structure
 width=

Note: Loan-to-deposit ratio is a ratio between the outstanding amount of loans to NFCs and households and their deposits. Liquidity are banks’ holdings at their ECB accounts. In %. Source: ECB, BSI, own calculations. 
The current pass-through of policy rate to bank lending and deposit rates is much more sluggish compared to the last rate hike cycle. Between November 2005 and July 2008 the ECB policy rate3 increased by 2.25pp, which led to a 2pp increase in lending rate and a 1pp increase in deposit rate (Figure 3). Although the pass-through was not perfect even in the previous cycle, it was nevertheless much higher compared to the recent one (Figure 4). The main difference stems from a very sluggish response in deposit rates, which in turn allows banks to keep lending rates lower.
Long period of low interest rates discouraged households and firms to lock their savings with a bank for a longer period. As a result, 66% of deposits are currently sight deposits, as opposed to around 40% until 2014 when a large package of non-standard measures was announced (Figure 2).4 The rate of remuneration on sight deposits is low and responded negligibly to the recent hikes in policy rate (Figure 1), possibly as an attempt by banks to recoup part of the lost margins experienced during the negative rate period.5

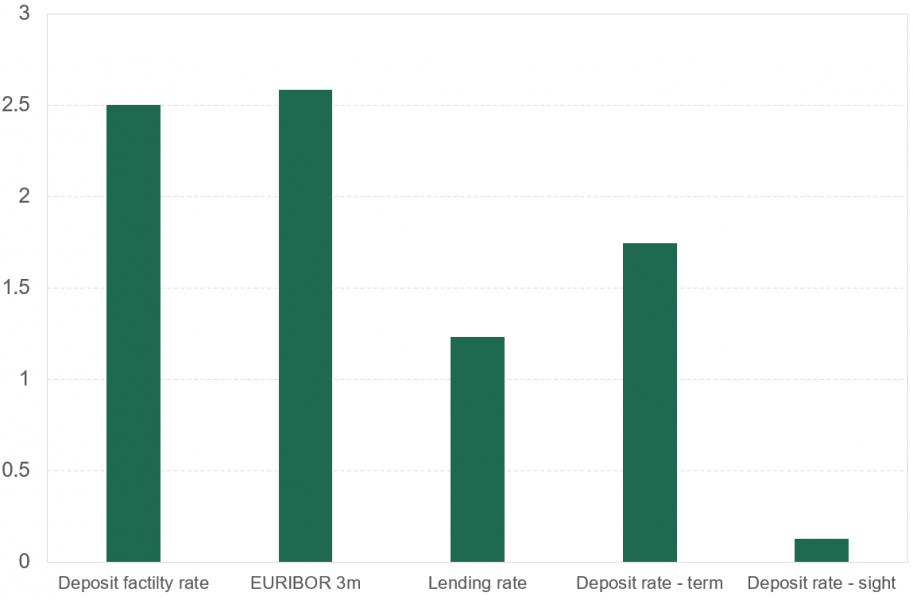
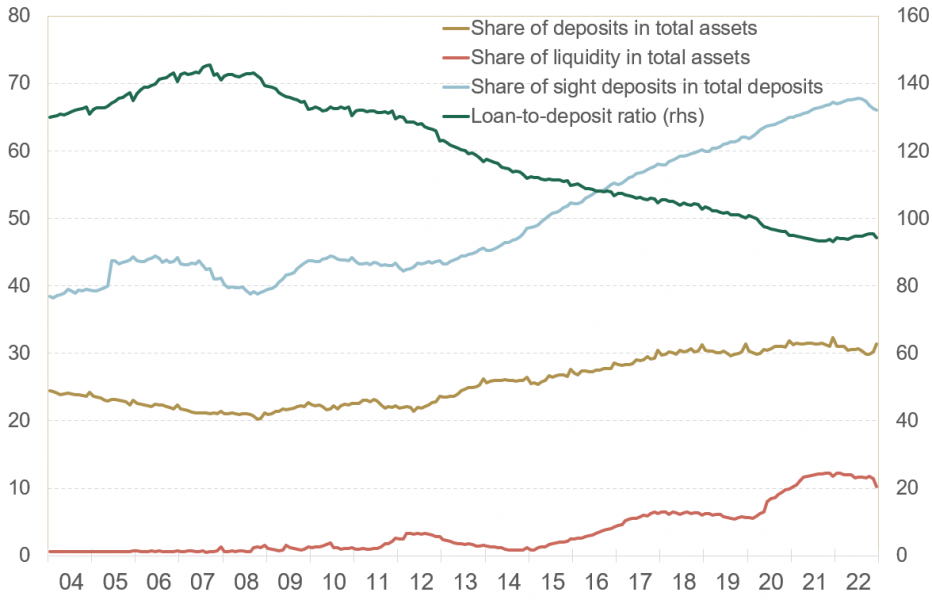
Figure 3: Pass-through of policy rate changes to lending and deposit rates in 2005-2008 tightening cycle


 width=

Note: The figure shows an increment in rates in percentage points from December 2005 on. ECB relevant policy rate is the MRO rate. All the series are normalised to zero one month before the initial rate hike. Source: ECB, MIR, own calculations. 

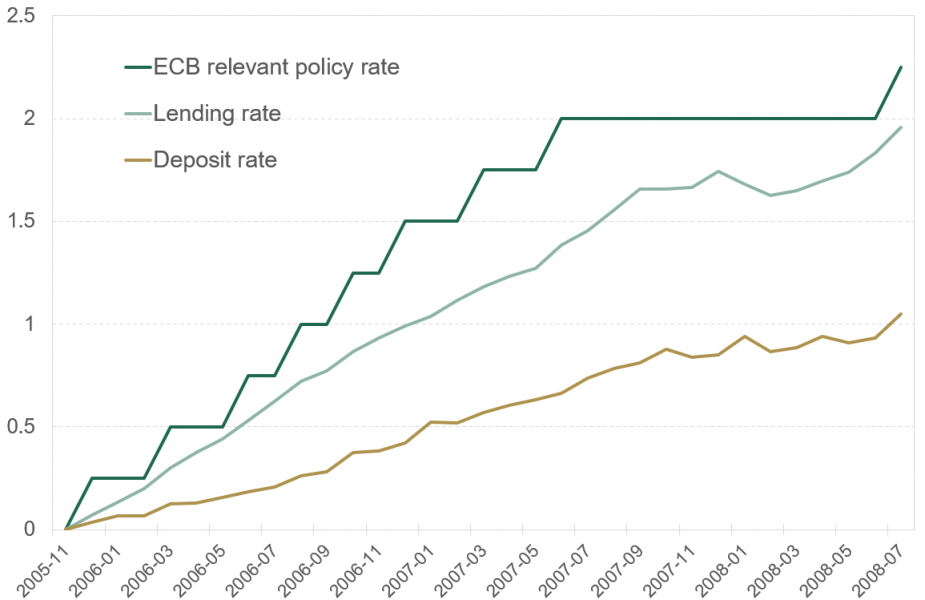
Figure 4: Pass-through of policy rate changes to lending and deposit rates in 2022 tightening cycle


 width=

Note: The figure shows an increment in rates in percentage points from July 2022 on. ECB relevant policy rate is the DFR rate. All the series are normalised to zero one month before the initial rate hike. Source: ECB, MIR, own calculations.
Term deposit rates are also lagging behind the change in policy rate (Figure 1). Banks can afford this due to the current structure of their funding and assets. First, banks have abundance of deposits, which resulted from a stable inflow of deposits over a longer period and especially during the pandemic. Whereas before the GFC banks made more than 1.4 euro of loans from every euro of deposits, the loan-to-deposit ratio started declining thereafter, and in December 2022 stood at 90% (Figure 2). This declining trend happened despite targeted refinancing operations (TLTRO) that were designed to support lending, but a large part of TLTRO funds ended in the deposit facility accounts with the ECB. This, together with asset purchase programs, resulted in large amount of liquidity in banks’ books that stood at 4 EUR trillion (11% of total assets) in December 2022. This implies banks do not need to compete for deposits as they could simply channel excess liquidity to finance possibly more profitable investments.

3. Do the amounts of deposits and liquidity affect banks’ deposit rate policy?

To answer the above question I compare the pass-through of policy rate to term deposit rates6 in the last policy hike cycle, with two previous ones in 20117 and 20088. The dependent variable is a spread between term deposit rate and 3-month Euribor. The interest lies in the change in deposit rate spread after the change of the policy, hence I use the data before and after rate hike within each policy cycle: 2008m3 – 2008m10, 2010m10 – 2011m9 and 2022m1 – 2022m12.9 Most importantly, I estimate how this pass-through depends on the share of deposits and liquidity in bank’s books. The estimates use IBSI and IMIR bank-level data that cover around 80% of euro area banking system’s total assets.
Whereas the difference between term deposit rate and Euribor 3m remained more or less the same after rate hikes in 2008 and 2011, it decreased by about one percentage point after policy change in 2022 (Figure 5). This decrease follows from low response of deposit rates relative to full pass-through of policy rate to Euribor. The impact is economically important, and shows that bank deposit rate policy is currently different and it attenuates the transmission of tighter monetary policy through banks.
Deposit rates increased by less in banks with higher share of deposits and this negative impact became stronger in the recent cycle (Figure 6). This implies that deposits do not only have a dampening impact on the transmission due to the current high amount, but also the elasticity is larger in the current cycle. A median bank had 37% share of deposits in 2011, which, leads to about 1bp lower deposit rate spread after rate hike. In the current cycle, a median bank has 53% share of deposits, which results in 33 and 56bp lower deposit rate spread for households and NFCs, respectively, after rate hike in 2022. This shows that the high stock of deposits in banks’ books is currently an important driver of a sluggish response of deposit rates to policy rate hikes.

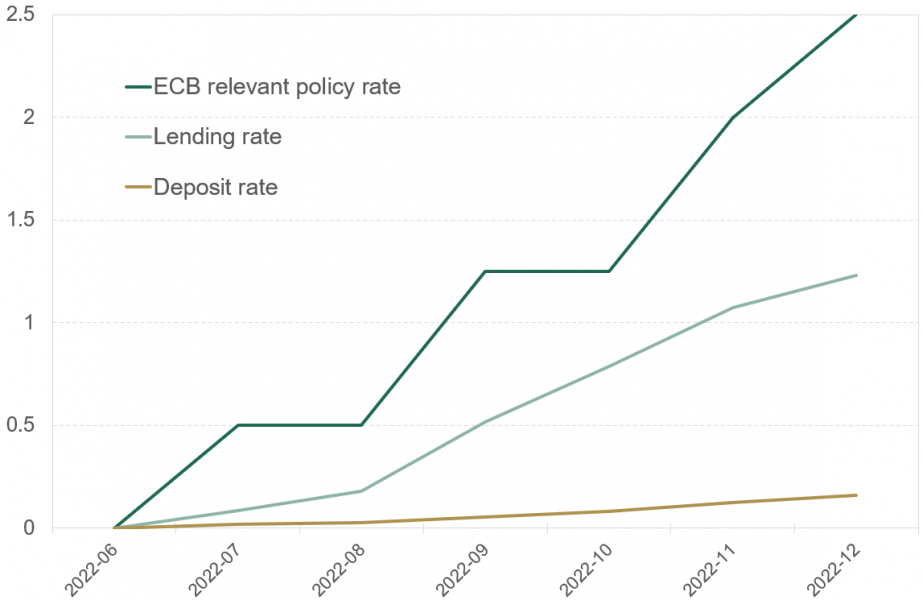
Figure 5: Deposit rate spread response to policy tightening


 width=

Note: The figure shows model-based estimates of a change in term deposit rate spread (over Euribor 3m) after the change in policy (start of tightening). Impact in pp. Source: IMIR, IBSI, own estimates.

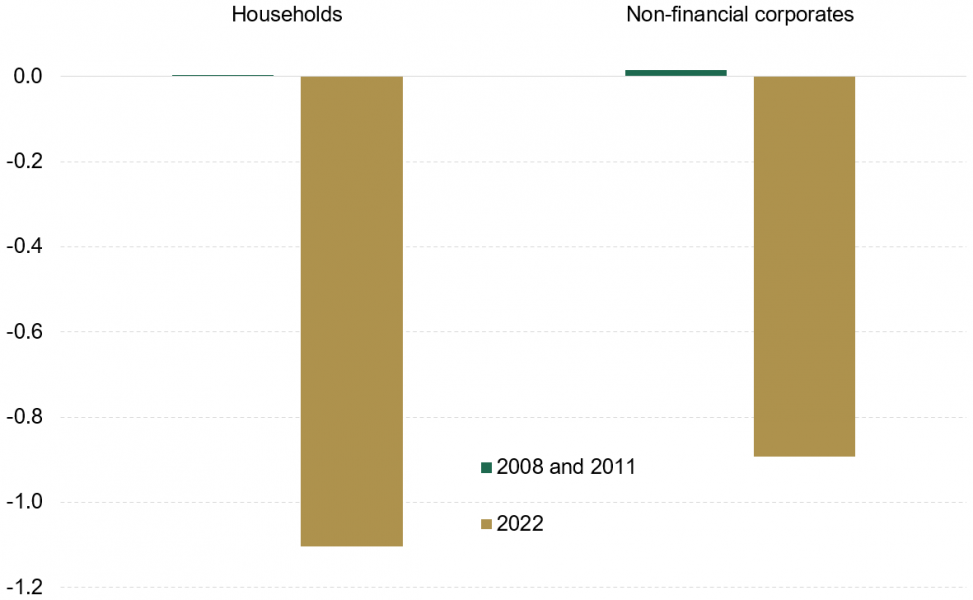
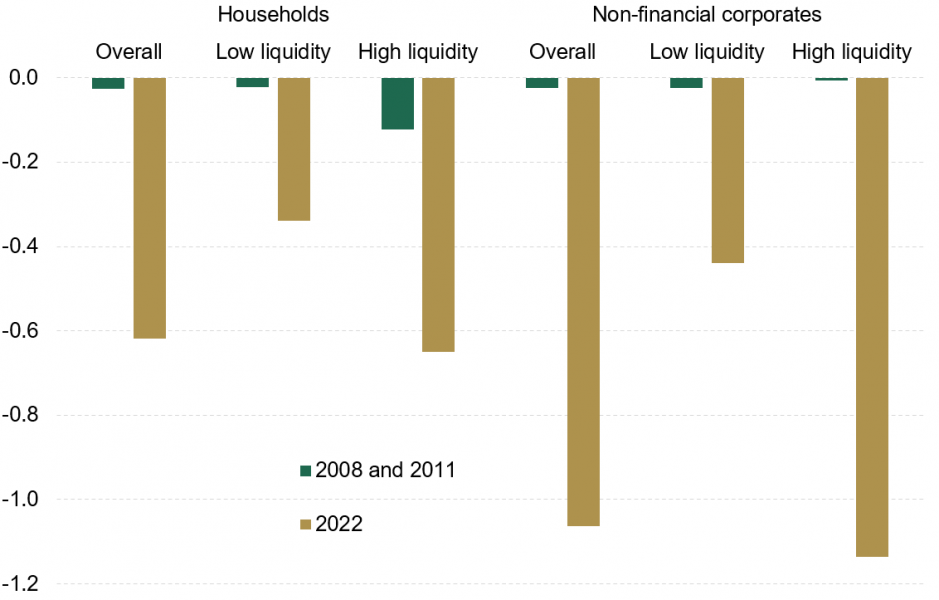
Figure 6: Impact of a 1pp increase in the share of deposits on term deposit rate spread


 width=
Note: The figure shows the impact of a 1pp increase in the share of deposits in bank’s total assets on term deposit rate spread (over Euribor 3m) after the change in policy (start of tightening). Banks with low/high liquidity are banks with below/above share of liquidity in their total assets, measured within each monetary cycle. Impact in pp. Source: IMIR, IBSI, own estimates. 
The response of deposit rates is low especially in banks that have high share of deposits and at the same time hold above median share of liquidity.10 In banks with above median share of liquidity in their total assets deposit rate spread decreases by 1.1bp for each percentage point increase in their share of deposits, while in banks with a lower-than-median share of liquidity the spread to corporate deposits decreases only by 0.4bp (Figure 6). Similar relative relation hold also for households, whereas in previous cycles liquidity did not have an economically meaningful role for banks’ deposit rate policy.

4. Policy implications and discussion

The results have important policy implications. Because euro area banks currently hold a higher proportion of deposits and liquidity in their total assets, about 10 percentage points more than in previous cycles, the transmission to deposit rates has been notably lower. In addition, also the responsiveness of deposit rates to the amount of bank deposits and liquidity is significantly higher in the current tightening cycle, which further attenuates the transmission. Both these effects work against the tightening stance of monetary policy.
Large amount of liquidity in banks’ balance sheets resulted from a long-lasting period of accommodative monetary policy. It is expected that banks will repay the TLTROs with their holdings at deposit facility accounts, which will reduce the amount liquidity by 1.4 EUR trillion by end-2024.11 The remaining part of liquidity holdings (2.6 EUR trillion or 66% of existing amount of central bank liquidity) stems from asset purchase programs. According to the Governing Council decision on 15 December 2022, the APP portfolio will decline with a pace of 15 EUR billion per month. The results of my analysis may warrant a faster pace of quantitative tightening in order to increase the transmission of policy rate to bank deposit rates.

References

Altavilla C., Canova F. and Ciccarelli M. (2020). Mending the broken link: Heterogeneous bank lending rates and monetary policy pass-through. Journal of Monetary Economics, 110, 81-98.
Bernanke B., Lown C. and Friedman B. (1991). The credit crunch. Brookings papers on economic activity, 1991(2), 205-247.
Boivin J., Kiley M. and Mishkin F. (2010). How has the monetary transmission mechanism evolved over time? In Handbook of monetary economics, 3, pages 369-422.
Heider F., Saidi G., and Schepens G. (2019). Life below zero: Bank lending under negative rates. Review of Financial Studies, 32(10), 3728-3761.
Kashyap A. and Stein J. (2000). What do a million observations on banks say about the transmission of monetary policy? American Economic Review, 90(3), 407-428.
Mishkin F. (1996). The channels of monetary transmission: Lessons for monetary policy.
  • 1.

    Monetary policy decisions, 16 December 2021. Net asset purchases under the asset purchase programme further shifted down from April 2022 and concluded in June 2022.

  • 2.

    Monetary policy decisions, 21 July 2022.

  • 3.

    ECB relevant policy rate is main refinancing operations (MRO) rate for 2005-2008 cycle when banks operated with low amount of liquidity, and the deposit facility rate (DFR) for 2022 rate hikes when banks are having a substantial amount of liquidity deposited at their central bank accounts (see Figure 2).

  • 4.

    In mid-2014 the ECB announced the start of asset purchase programme (APP), as well as the first series of targeted longer-term refinancing operations (TLTRO).

  • 5.

    Banks were reluctant to pass negative rates to depositors, especially to households (Heider et al., 2019).

  • 6.

    Similar findings hold also for sight deposit rates. Results are available upon request.

  • 7.

    In 2011, the ECB raised policy rates twice by 25 basis points.

  • 8.

    In July 2008, the ECB raised policy rates by 25 basis points. It was the last increase in the series of policy rate hikes that started in December 2005. Due to lack of bank-level data prior to 2008, I can only estimate the response to the last increase in this cycle.

  • 9.

    Pooling together the data for the three policy cycles results in around 5.600 bank-month observations for both, households and non-financial corporates. The estimates control for other bank characteristics with a series of bank-cycle fixed effects.

  • 10.

    Liquidity in the analysis is defined as bank’s holdings at ECB accounts. Similar results are found also when using a broader measure of liquidity that includes also short-term interbank loans, debt securities and equity investments. Results are available upon request.

  • 11.

    Large part of it is falling due in June 2023. Banks can also decide for an early repayment, the incidence of which increased after October 2022 Governing Council meeting, where interest rate on the funds borrowed in the third series of TLTRO was raised.

About the authors

Matjaž Volk

Matjaž Volk joined the monetary policy analysis division in the Bank of Slovenia in July 2021, where his main field of work is bank-based transmission of monetary policy. Previously he worked in the area of financial stability, starting his career in 2009 in the Bank of Slovenia and later joined the stress test modelling division at the European Central Bank in 2018, where he contributed to development of macroproprudenial stress test model. His research in the field of empirical banking has been published in the Journal of Banking and Finance, International Journal of Central Banking, Quarterly Review of Economics and Finance, and others. He holds a PhD in economics from University of Ljubljana.

More on these topics

Tags: