menu
close

Author(s):

Luis Garcia | European Banking Authority (EBA)
Ulf Lewrick | Bank for International Settlements (BIS)
Taja Sečnik | University of Ljubljana

Keywords:

Systemically important bank , systemic risks , regulatory arbitrage , financial stability

JEL Codes:

Global systemically important banks (G-SIBs) are key nodes in the financial system. The identification of G-SIBs and the attendant calibration of capital surcharges to bolster their resilience is thus a supervisory priority. However, the G-SIB assessment largely relies on year-end snapshots of the banks’ balance sheets, providing incentives for banks to window dress them. We study banks’ year-end window dressing in the European Union (EU) and find that some G-SIBs compress their balance sheet at year-end to an extent that they can reduce their surcharges or avoid G-SIB designation altogether. The compression of intra-financial system assets and liabilities as well as over-the-counter derivatives stand out as key margins of adjustment at year-end. Moreover, G-SIBs that are more tightly constrained by capital requirements window dress more than their peers. Our findings underscore the importance of supervisory judgement in the assessment of G-SIBs and call for greater use of average as opposed to point-in-time data to measure banks’ systemic importance.

The safety and soundness of major banks is of paramount importance given their crucial role in the supply of credit to the economy. The financial crisis of 2007/08 exemplified how concerns about banks’ resilience can send shock waves through the entire financial system. Regulatory reforms since then have thus focused on strengthening bank resilience and mitigating systemic risks, paying particular attention to the risks that can emanate from global systemically important banks (G-SIBs). More stringent capital requirements are one building block of the new rules. The benefit of greater resilience came to the fore with the outbreak of the COVID-19 crisis: a resilient banking sector was a cornerstone of the economic recovery. Yet capital comes at a cost. Higher requirements thus create incentives for banks to search for loopholes in the new rule book.

In recent work (Garcia et al 2021), we assess how G-SIBs lower their capital requirements by window dressing – i.e. they temporarily reduce the size of their balance sheet at year-end. This behaviour exploits the design of the G-SIB framework, which has been developed by the Basel Committee on Banking Supervision (BCBS) to identify G‑SIBs and calibrate the banks’ capital surcharges (BCBS (2011)). We start by sketching the rationale of the framework and the potential for gaming the rules. Next, we approximate the amount of year-end balance sheet compression based on a large sample of banks in the EU and evaluate how window dressing could impact on capital requirements. We then discuss differences in banks’ behaviour and conclude with a brief discussion of policy remedies.

How to identify a global systemically important bank

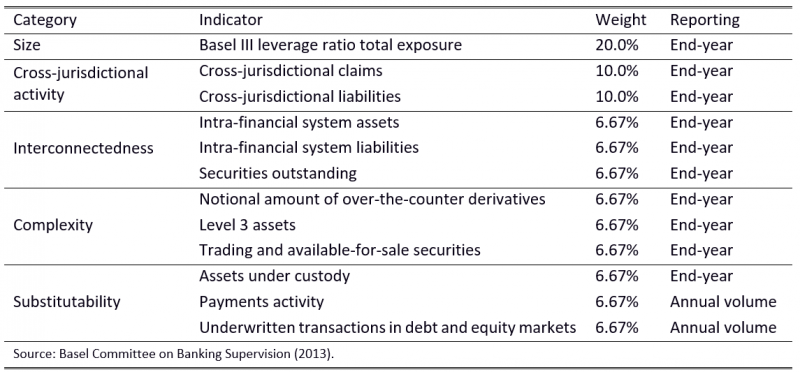
The G-SIB framework relies on a simple and transparent methodology to measure the systemic importance of major banks (BCBS (2013))2. Every year, large internationally-active banks report 12 indicators to the BCBS. These indicators span a broad range of banking activities, reflecting five key categories of systemic importance (Table 1).3 For each indicator, the BCBS calculates the bank’s score based on dividing the bank’s indicator value by the sum of the corresponding values of the roughly 80 banks in the assessment sample (the “global denominator”). The indicator scores can thus be thought of as a bank’s global market share in the corresponding business activity. The bank’s “G-SIB score” (measured in basis points, “bps”) is equal to the weighted average of its 12 indicator scores based on the weights reported in Table 1. All banks with a score of at least 130 bps are designated as G‑SIBs. The most recent G-SIB list, published by the Financial Stability Board in November 2020, comprises 30 banks, of which 11 are headquartered in the EU or the United Kingdom.


Table 1 –
G-SIB score categories and indicators
 width=

Regulatory incentives versus unintended consequences

By imposing higher capital requirements on G-SIBs than on other banks, the framework not only bolsters the G-SIBs’ resilience but also provides incentives for banks to become less systemically important over time. Each G-SIB is allocated into a bucket depending on the bank’s score. These buckets, covering a score range of 100 bps each, determine the additional capital requirement (so-called Higher Loss Absorbency requirement) that the bank has to meet. Starting from a level of 1% of Common Equity Tier-1 (CET1) capital to risk-weighted assets (RWA) in the first bucket for the G-SIBs with the lowest scores (130 to 229 bps), the surcharges increase by increments of 0.5 percentage points up to the fourth bucket. From there onwards, surcharges increase by increments of 1 percentage point.

The simple and transparent design of the assessment methodology opens up the opportunity for banks to game the system. The calculation of the scores largely relies on a snapshot of the balance sheet at the end of the bank’s financial year: 10 out of the 12 indicators rely on year-end data (Table 1). These 10 indicators account for nearly 87% of the banks’ G-SIB score. A bank that temporarily compresses the indicator values ahead of the reporting date can reduce its score, and thus its systemic footprint. If the compression is sufficiently large, the bank moves into a lower bucket and therefore benefits from a discrete decline in its capital requirements by at least 0.5 percentage points. Some banks could even drop off the G-SIB list. Since a bank’s score increases by design if other banks reduce their indicator values, window dressing by peers reinforces banks’ incentives to compress their balance sheet further.

Uncovering window dressing: an approximation

Even though the G-SIB framework leaves the door open for regulatory arbitrage, the question is whether banks exploit this opportunity to an extent that it would meaningfully affect supervisors’ assessment of the banks’ systemic importance. Put differently, is the year-end compression of banks’ balance sheets sufficiently large so that individual banks move into a lower G‑SIB bucket or even drop off the G-SIB list?

Our empirical strategy to answer this question relies on matching the annual G-SIB indicators with closely related balance sheet items available at a quarterly frequency. Our main dataset comprises 166 EU banks (including banks from the United Kingdom) that submitted consistent data to the European Banking Authority from the fourth quarter of 2014 up to the first quarter of 2020. Of these, 37 banks also participated in the BCBS’s G‑SIB assessment and thus reported indicator values at year-end. 32 banks consistently reported data in each year (henceforth “reporting banks”).

The approximation of the quarterly indicator scores proceeds in two steps. First, we map the supervisory data to the ten G-SIB indicators that rely on year-end data (recall Table 1). We cannot match the two indicators that record a bank’s activity over the course of the entire financial year. However, these indicators are less prone to window dressing exactly because they do not rely on year-end snapshots of the balance sheet, making them unlikely to affect our results. Second, we approximate the evolution of the global denominators over the course of the year to calculate quarterly indicator scores for each bank. This second step requires assumptions about the balance sheet adjustments of unobserved non-EU banks since the denominators summarise the activity of the global banking sector. In Garcia et al (2021), we confirm that our findings are robust to considering a variety of possible scenarios for the behaviour of non-EU banks.

Does window dressing matter?

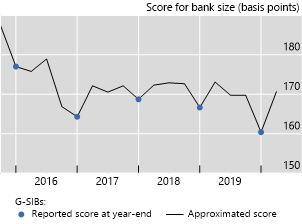
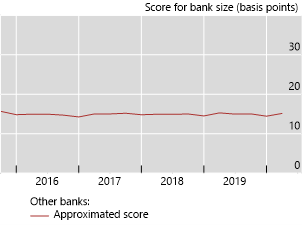
Window dressing abounds in the visual inspection of the G-SIB indicators. We plot the evolution of banks scores for the size indicator in Figure 1. At every year-end, the average score of G-SIBs declines markedly before rebounding again in the first quarter of the year – a V-shape adjustment. The other banks in our sample, by contrast, compress their scores by much less, with the average score remaining nearly flat throughout the year.


Figure 1:
G-SIBs’ scores show a V-shape adjustment at year end, in contrast to other banks

 width=  width=

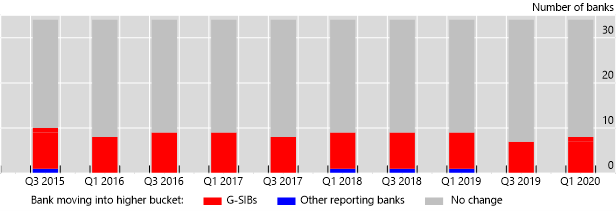
Next, we investigate the year-end adjustment by the 32 reporting banks, for which we can compare the official G‑SIB score with the quarterly proxy scores. We assess whether banks, based on their approximated G-SIB score, would have been allocated into a different G-SIB bucket had the assessment been conducted at the end of the first or third quarter of the year. These “hidden bucket changes” undermine the assessment of systemic importance.

Our approximation suggests that up to 13 different EU banks across the six years studied would have faced higher capital requirements in the absence of year-end adjustments (Figure 2). Of these, three banks would have been added to the G-SIB list, whereas 10 banks would have been allocated to a higher G-SIB bucket. The estimated annual relief amounts to more than EUR 31 billion of CET1 capital (equivalent to 0.6% of RWA) based on the 13 banks’ total RWA in the first quarter of 2020. Several banks cross the bucket threshold year after year, suggesting a systematic approach to their balance sheet compression. Given the size and systemic importance of these banks, this compression is likely to weigh on the liquidity and market depth of the affected financial markets at year-end.

To test the robustness of our results, we consider several alternative scenarios for the evolution of denominators used in the calculation of the scores. All scenarios support our results, and even under the assumption of marked window dressing by all banks reporting to the BCBS (i.e. EU and non-EU banks contributing to the global denominator), we estimate that a total of 11 EU banks move into a higher bucket at least once. We note that these results are based on quarter-end balance sheet information that is disclosed to supervisors and other stakeholders and may thus be window-dressed as well, as suggested by previous research (e.g. Aldasoro et al (2019)). Thus, our estimates can be considered lower bounds of the true magnitude of banks’ window dressing in the run-up to year-end regulatory reporting dates.


Figure 2:
Window dressing leads to hidden bucket changes
 width=

Trends and drivers

We consider a more formal regression analysis to shed more light on banks’ window dressing. This analysis is based on the full sample of banks and has the important advantage that it allows us to control for differences in banks’ characteristics (e.g. profitability, asset quality, capitalisation) that could influence banks’ incentives to window dress.

Our estimates confirm our previous finding of a notable contraction by G-SIBs at year-end. While all banks reduce their scores at year-end relative to their third quarter proxy by around 5 bps, we estimate that reporting banks reduce their score by an additional 4 bps on average at year-end relative to other banks. However, G-SIBs stand out with an average contraction, on top of the former, of more than 12 bps.

Has the year-end contraction intensified over time? Figure 3 illustrates yearly estimates and shows that the year-end contraction by reporting banks relative to other banks has remained stable over time with little variation across banks. For G-SIBs, by contrast, the additional contraction is not only larger, but has also increased during our period of observation.

Figure 3: G-SIB window dressing has intensified over time
 width=

We find that reporting banks compress their balance sheet along all G-SIB categories at year-end. For each of these categories, we also find that G-SIBs reduce their scores over and above the reporting banks’ compression. The difference is most pronounced for interconnectedness, which comprises banks’ intra-financial system assets and liabilities, such as interbank loans and deposits, which can be wound down relatively quickly and at limited cost. Furthermore, we find a notable compression in G-SIBs’ notional amounts of over-the-counter derivatives relative to their peers, as well as for both cross-jurisdictional activity indicators.

We also test whether banks more tightly constrained by capital requirements compress their G-SIB score by more than their peers, in search for immediate benefits from temporary contractions. Our findings imply an additional year-end contraction in the scores of tightly constrained G-SIBs in a range of 22 to 27 bps, on top of the average contraction by G-SIBs. The contraction is strongest for those G-SIBs that are constrained by both the leverage ratio and CET1 capital ratio, at around 37 bps.

Finally, we assess how the introduction of the EU framework for other systemically important banks (O-SIIs) has affected banks’ window dressing. O-SIIs have little leeway to manage down their O-SII capital surcharges. The O-SII framework benchmarks major banks against much smaller peers from the same country. As a result, all EU G-SIBs have also been designated as O-SIIs. To lower their O-SII capital surcharge, these banks would need an unrealistically large year-end reduction in their domestic market share.

In line with this, we observe only a small additional contraction in the scores of O-SIIs relative to other banks even though the sub-sample of O-SIIs comprises all G-SIBs. Moreover, we identify those G-SIBs for which the O‑SII capital surcharge is at least as high as (or “super-equivalent” to) the G-SIB surcharge. For these banks, moving into a lower G-SIB bucket would not lead to a reduction in capital requirements. Consistent with the reduced incentives of these G-SIBs to window-dress their G-SIB score, we find that these banks lower their scores by less than other G-SIBs (although statistical significance cannot be established due to the limited number of such O-SIIs).

Policy implications

Our finding of sizeable window dressing by G-SIBs has several implications for policy. First, a flexible application of the G-SIB methodology seems to be in order. While the G-SIB score can serve as an important reference point, there is value in making more active use of supervisory judgement in designating G-SIBs. In current supervisory practice, the application of such judgement is typically limited to adding banks to the G‑SIB list. Empowering supervisors to allocate banks to higher G-SIB buckets based on evidence of window dressing could help reduce incentives for regulatory arbitrage. The collection of consistent data across major banks at a sufficiently high frequency would be an important first step to assist supervisors in this regard.

In addition, enhancements to the calculation of the G-SIB indicators could further strengthen the framework. Greater use of averaging rather than relying on year-end values could improve the robustness of the assessment. Given the importance of G-SIBs for the functioning of the global financial system, measures to contain their withdrawal around year-end reporting dates could also help to improve the system’s robustness.


References

Aldasoro, I, T Ehlers and E Eren, 2019. “Global banks, dollar funding, and regulation”, BIS Working Papers, no 708.

Basel Committee on Banking Supervision, 2011. Global systemically important banks: assessment methodology and the additional loss absorbency requirement.

——, 2013. Global systemically important banks: updated assessment methodology and the higher loss absorbency requirement.

——, 2018. Global systemically important banks: revised assessment methodology and the higher loss absorbency requirement.

Garcia, L, U Lewrick and T Sečnik, 2021. “Is window dressing by banks systemically important?”, BIS Working Papers, no 960.

  • 1.

    The views expressed in this article are those of the authors and do not necessarily reflect those of the Bank for International Settlements (BIS), the European Banking Authority (EBA), or the European Securities and Markets Authority (ESMA). Taja Sečnik conducted the research on this project while working at the EBA.

    Author contacts: luis.garcia@eba.europa.eu; ulf.lewrick@bis.org; taja.secnik@esma.europa.eu. 

  • 2.

    In addition to the G-SIB assessment methodology and the attendant capital surcharges, discussed in this Policy Brief, regulatory reforms encompass enhanced supervision of G-SIBs and measures to improve these banks’ resolvability.

  • 3.

    A revised assessment methodology, taking effect in 2021, adds the volume of banks’ trading activities as an additional indicator (BCBS (2018)).

About the authors

Luis Garcia

Luis Garcia works for the European Banking Authority, currently in the Statistics Unit of the Data Analytics, Reporting and Transparency Department. He is an experienced economist-statistician who has been managing regulatory reporting and compiling risk indicators for the largest EU banks since 2012, liaising with national supervisors and central banks. He led the drafting of technical standards, guidelines, and reports on the identification of systemically important institutions in the European Union’s banking sector. In the past, he worked for Portugal’s central bank and banking supervisor where he contributed to the international team of experts leading the financial assistance programme to the Portuguese government. Besides central banking and supervision, his professional background includes retail banking experiences. He holds two graduations, in Economics and in Business Administration, along with a joint MBA programme by Católica-Lisbon School of Business & Economics and Nova School of Business & Economics.

Ulf Lewrick

Ulf Lewrick joined the Bank for International Settlements (BIS) in 2012, where he works as a Principal Economist in the Financial Systems and Regulation unit of the Monetary and Economic Department. Before taking up his current assignment in 2015, he worked in the secretariat of the Committee on the Global Financial System, where he supported the work of several study groups on financial market issues. Prior to joining the BIS, Ulf held the position of deputy head of section (2010-12) and economist (2008-10) at the Swiss State Secretariat for International Finance, where he contributed to several of the Swiss government’s financial market reform initiatives. Ulf holds a Ph.D. in economics from the University of Basel, where he is also a research fellow in the faculty of economics. His research focuses on issues pertaining to the structure and regulation of banks, investment funds and financial markets.

Taja Sečnik

Taja Sečnik holds a Master’s degree in financial mathematics from University of Ljubljana’s Faculty of Mathematics and Physics. She gained experience with supervisory banking data while working at the European Central Bank and the European Banking Authority, where she contributed to regular statistical publications and reports, the analysis of trends as well as the design of data requests and data quality assurance. She recently joined the European Securities and Markets Authority to work as a Policy Officer on the regulation and supervision of central counterparties.

More on these topics

Tags: